Veerabathini Sumanraju*![]() | Tinnavelli Ramamohan Rao
| Tinnavelli Ramamohan Rao![]() | Narasimhulu Sanke
| Narasimhulu Sanke![]()
© 2023 IIETA. This article is published by IIETA and is licensed under the CC BY 4.0 license (http://creativecommons.org/licenses/by/4.0/).
OPEN ACCESS
Cogeneration, a process facilitating the simultaneous production of electricity and useful heat from a singular energy source, has been investigated in this study. The primary objective of this research was to assess the performance dynamics of a cogeneration power plant under constant steam inlet conditions. Results revealed that the thermal efficiency (Ƞth) oscillated between 23.76% and 24.44%. The maximum thermal efficiency recorded was 24.44%, corresponding to an Energy Utilization Factor (EUF) of 0.85, under an inlet temperature of 502℃. Conversely, the lowest thermal efficiency measured was 23.76%, with an EUF of 0.72, observed at an inlet temperature of 503℃. These findings underscore the system's proficient energy utilization, notwithstanding minor fluctuations in steam parameters, such as inlet and various stages of operating conditions. A positive relationship was established between the heat-to-power ratio and the overall efficiency, which varied between 70.59% and 76.49% across different pressure values. The peak efficiency was noted at 84.7 kgf/cm2. Moreover, the EUF exhibited a range from 0.72 to 0.85, indicative of the system's energy use efficiency. A higher EUF value implies a more effective use of energy. At an EUF of 0.85, the cogeneration power plant demonstrated an impressive overall efficiency of 75.13%, signifying highly efficient energy conversion and utilization. However, at an EUF of 0.72, the overall efficiency declined to 70.59%, pointing to reduced efficiency in energy utilization. These results emphasize the critical role of maintaining a constant mass flow rate of steam and optimizing inlet parameters to enhance the efficiency of cogeneration power plants. Consequently, this study provides valuable insights into the operational optimization of cogeneration power plants.
cogeneration system, energy utilization factor, heat to power ratio, mass flow rate, overall efficiency, steam inlet conditions, thermal efficiency, energy efficiency
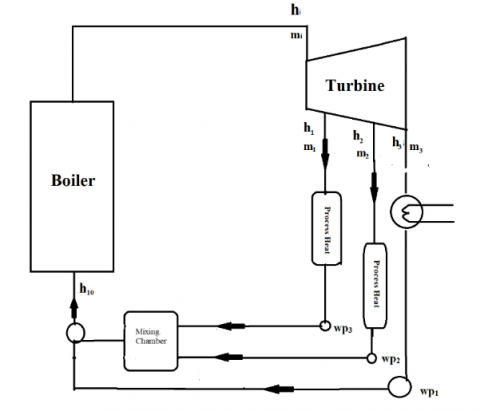
Cogeneration power plants, also recognized as Combined Heat and Power (CHP) systems, distinctively offer the advantage of producing electricity and reusing waste heat concurrently, thereby optimizing energy efficiency. Keeping in view the significance of effective design parameters and operating conditions, this study undertakes an analytical approach to gauge the performance of a cogeneration power plant operating under constant mass flow rate of steam. The investigation is centred around thermal efficiency, power output, and energy utilization, examining the implications of inlet temperature, pressure, and heat-to-power ratio on the system's efficiency. The findings are expected to contribute towards enhanced energy utilization and sustainable power generation methodologies. A cogeneration system, as depicted in Figure 1, is comprised of a steam cogeneration extraction condensing turbine, which demonstrates the path of steam flow, inclusive of the steam conditions at the inlet, extraction points at stage 1 and stage 2, and the steam exhausted to the condenser. The operating pressures at each stage are indicated, with the condenser pressure operating at -0.9 kgf/cm2 under ambient temperature conditions.
The scope of optimizing thermodynamics in cogeneration systems has been explored in previous research. Feidt and Costea [1] examined the optimization of these systems, focusing on maximizing exergy while considering practical constraints such as mechanical energy limitations, heat demand requirements, and physical constraints like heat source availability and temperature limitations of the system. Ahmadi et al. [2] conducted a comprehensive 3-E (energy, exergy, and economic) assessment, highlighting the potential for efficiency enhancement and cost savings. Several comparative studies have also been conducted. Campero et al. et al. [3] compared the efficiency, heat generation, and electricity output of three distinct cogeneration power layouts. Gilewski and Montusiewicz [4] provided extensive technical solutions for combined energy generation systems, particularly beneficial for low-level power plants and diverse public utility locations. Case studies that demonstrate the practical implications of cogeneration systems were conducted by Varma et al. [5] and Negro et al. [6]. The former explored a cement mill with two units, while the latter developed a small-scale cogeneration system for school buildings, emphasizing the economic benefits and efficient use of primary energy. Domnikov et al. [7, 8] investigated theoretical and methodological aspects of competitive energy cogeneration system development and analyzed the energy cogeneration system reliability in the Ural region. Shcheklein and Dubinin [9] offered a novel approach by transforming diesel fuel into synthesis gas for the production of electrical and heat power. Bapat et al. [10] underlined the importance of energy from a thermodynamic perspective as a significant performance measure for CHP systems, using a 20.7 MW CHP system as a case study. Gürtürk and Oztop [11] reported an energy efficiency of 84.65% for the circulating fluidized bed boiler, suggesting that 84.65% of the input energy was efficiently converted into usable work. Kabeyi and Olanrewaju [12] and Khaleel et al. [13, 14] investigated the feasibility of export-based cogeneration by a large Kenyan sugar company and assessed the impact of operational parameters on power plant performance, respectively. Ciuła et al. [15] sought to improve the energy balance of the landfill plant and optimize energy management from a renewable source. Deboni et al. [16] evaluated the properties of biomass and its gradual and steady increase in energy generation in the study region. Srinivas et al. [17] assessed the impact of operational parameters on power plant performance. Bo et al. [18] identified the best working fluid for the MGT + ORC system, offering the highest power output. Lastly, Kabeyi et al. [19] reviewed the performance of an existing bagasse cogeneration power plant and sought to improve its performance by converting it into a coal-bagasse cogeneration plant.
Despite extensive studies on exergy and efficiency analysis to improve the performance of cogeneration plants, there remains a need for comprehensive performance evaluations under varying conditions. This study aims to bridge this gap by evaluating and analyzing the performance of a cogeneration power plant under constant steam inlet conditions. Performance tests are conducted, and the influence of varying inlet parameters, such as pressure and steam temperature, on the thermal efficiency and overall efficiency are examined. The study aims to understand the system's efficiency and identify optimal operating conditions to enhance its overall performance.
The Experimentation in the power plant, the performance of the steam power plant is analyzed through a series of sequential experiments at a constant mass flow rate of steam at inlet to the turbine. Experiments are conducted A daily log sheet, recording the flow parameters for every hour, while technicians work on a shift basis to ensure continuous plant operation and monitor the steam flow parameters based on required load conditions. The step-by-step analysis involves closely examining and recording the values of various steam flow parameters during different operational stages. These sequential experiments are conducted over multiple days, enabling the collection of data to identify trends, patterns, and potential issues in the plant's performance. This involves selecting appropriate design parameters such as the steam inlet pressure and temperature. Analyze the performance of the power plant using the thermodynamic model, focusing on factors such as efficiency, power output, and thermal energy production. Identify any design parameters or operating conditions that can be optimized to improve the performance of the power plant. Figure 1 shows the steam cogeneration extraction condensing turbine layout, it shows that the steam conditions inlet, extraction 1 at stage1 which operates at general pressure of up to 8 kgf/cm2 and extraction point at stage 2 where the pressure operates up to 2.5 kgf/cm2 and finally the steam exhausted to the condenser where the gauge pressure operated at -0.9 kgf/cm2 at ambient temperature conditions. The below Eqs. (1) to (14) is used to find the performance of for the above layout shown Figure 1.
Figure 2 shows the steam turbine setup in a cogeneration power plant, as it converts the energy in steam into mechanical energy, which is then used to drive a generator to produce electricity. In a cogeneration power plant, the steam turbine is typically designed to provide both electricity and thermal energy for other processes, such as space heating or industrial processes. In a cogeneration power plant, the steam turbine is also designed to extract some of the thermal energy from the steam before it exits the turbine. This is typically done through the use of heat exchangers, which transfer the waste heat from the turbine exhaust to other processes, such as space heating or industrial processes. The use of a steam turbine in a cogeneration power plant allows for the efficient use of the thermal energy generated by the plant, as well as the production of electricity. This can result in higher overall efficiency and lower greenhouse gas emissions compared to traditional power plants that only produce electricity.
Cogeneration of heat and power implies the generation of two distinct types of energy. To determine the efficiency of a cogeneration plant, a common denominator should first be established. The first and most direct criteria are the thermal efficiency of conventional plants and the utilisation of heat energy in cogeneration plants, which are based on the first law analysis, which only deals with the quantitative side of energy.
Figure 1. Steam cogeneration system extraction method
Figure 2. Steam turbine setup in cogeneration power plant
Eq. (1) is used to analyze the heat input to the steam turbine.
Heat input to the turbine, $(\mathrm{Qs}), \mathrm{kW}=\dot{\mathrm{m}}_{\mathrm{i}}\left(\mathrm{h}_{\mathrm{i}}-\mathrm{h}_{10}\right)$ (1)
where, hi. is the specific enthalpy at inlet of the steam turbine; h10: Specific enthalpy of feed water.
The heat output of the plant.
Heat recovery at extraction $1, \mathrm{~kW}=\dot{\mathrm{m}}_1 \mathrm{~h}_1$ (2)
Heat recovery at extraction $2, \mathrm{~kW}=\dot{\mathrm{m}}_2 \mathrm{~h}_2$ (3)
Heat output, $\mathrm{kW}=\dot{\mathrm{m}}_2 \mathrm{~h}_2+\dot{\mathrm{m}}_3 \mathrm{~h}_3$ (4)
Total output, $\mathrm{kW}=\mathrm{W}_{\text {net }}+\dot{\mathrm{m}}_1 \mathrm{~h}_1+\dot{\mathrm{m}}_2 \mathrm{~h}_2$ (5)
$\mathrm{W}_{\text {net }}=$ Net Power, $\mathrm{kW}$
Heat supplied to the plant $(\mathrm{Qi})=$ $\dot{\mathrm{m}}_{\mathrm{f}} \mathrm{X} \mathrm{C} . \mathrm{V}$ of the fuel (6)
where, mf denotes the mass flowrate of fuel, kg/s and C.V denotes the calorific value of bagasse is found by using ultimate analysis of the fuel with 50% moisture content. Which gives the value of 9889 kJ/kg.
Overall efficiency = Total output/Heat input to the plant (7)
Above Eqs. (1) to (7) are used to find the actual performance rate of the turbine which gives efficiency value wherever increasing and decreasing with respect to the inlet parameters but reasons to find the efficiencies decreasing and increasing by using energy utilizing factor according to first law of the thermodynamics using energy balance is given below Eq. (8).
Energy input $\left(E_i\right)=$ Energy output (Eo)+Work done (8)
Energy input $\left(E_i\right), \mathrm{kW}=\dot{\mathrm{m}}_{\mathrm{i}} \mathrm{h}_{\mathrm{i}}$ (9)
where, m1 is the mass flow rate of steam at inlet to the turbine.
h1 is the specific enthalpy at corresponding inlet pressure and temperature.
Energy output (Eo), $\mathrm{kW}=\dot{\mathrm{m}}_1 \mathrm{~h}_1+\dot{\mathrm{m}}_2 \mathrm{~h}_2+\dot{\mathrm{m}}_3 \mathrm{~h}_3$ (10)
where, m2, is the mass flow rate of steam at extraction stage 1 from the turbine.
h2, is the specific enthalpy at corresponding stage 1 inlet pressure and temperature.
m3, is the mass flow rate of steam at extraction stage 2 from the turbine h3, is the specific enthalpy at corresponding stage 2 inlet pressure and temperature.
m3, is the mass flow rate of steam to the condenser.
h3, is the specific enthalpy of the condenser or exhaust.
where, h3 is the wet steam enthalpy need to find by using isentropic expansion equation from inlet to the exhaust to the turbine using the entropy equation given below.
$s_1=s_3$ (11)
S1 is the specific entropy of superheated steam at inlet to the turbine.
S4 is the specific entropy of steam at Exhaust from the turbine.
$s_1=s_{f 3}+X S_{f g 3}$ (12)
Above equation is to find the dryness fraction value of the steam at condenser the value is nearly 81 to 83% then after using the dryness fraction with corresponding pressure the specific enthalpy (h3) of steam found from mollier chart.
Work done, $\mathrm{kW}=\mathrm{E}_i-\mathrm{E}_{\mathrm{o}}$ (13)
Energy Utilization Factor (EUF) of turbine is given by.
$\mathrm{EUF}=\frac{\mathrm{W}_{\text {net }}}{\text { Work done }}$ (14)
Wnet is the Actual Power generated from the turbine.
A performance test on a cogeneration power plant was carried out by varying the input parameters, specifically inlet pressure and steam inlet steam temperature, while maintaining a constant mass flowrate of steam inlet to the turbine mentioned in Table 1. Specific enthalpies, specific entropies are mentioned in Table 2 at corresponding input parameters of Table 1.
The thermal efficiency (Ƞth) and energy utilization factor (EUF) for a system at various intake temperatures (Ti) ranging from 500℃ to 510℃ are shown in Figure 3. The thermal efficiency ranges from 23.76% to 24.44%. The majority of the measurements fell within a narrow range of 24.15% to 24.3%. Thermal efficiency quantifies how well a system turns input energy into usable output energy. Other energy utilisation factors range between 0.72 and 0.85. The majority of the measurements are between 0.78 and 0.84. The energy utilisation factor quantifies how efficiently a system uses energy. A higher score suggests that the system is consuming less energy. Based on these measurements, the system looks to be consuming energy quite efficiently. The highest thermal efficiency of 24.44% and EUF of 0.85 were obtained at 502℃, while the minimum thermal efficiency of 23.76% and EUF of 0.72 were obtained at 503℃. Because of other parameters such as inlet pressure and stage 1 and stage 2 operating conditions, which influenced both the thermal efficiency and energy utilisation factor, these minimum and maximum values were obtained with only a 1℃ difference. The energy utilisation factor measures how efficiently a system uses energy. A greater number suggests that the system is using energy more efficiently. Based on these observations, it appears that the system is using energy relatively efficiently, with the majority of the readings falling within a tight range.
From Figure 4, Thermal efficiency (Ƞth) and Energy Utilization Factor (EUF) for a thermal system at various Inlet Pressure (Pi) ranging from 81.3 kgf/cm2 to 85.4 kgf/cm2. Thermal efficiency range between 23.76% and 24.44%. Energy Utilization Factor range from 0.72 to 0.85.
Energy utilization factor is a measure of how effectively a system uses energy. A higher value indicates that the system is using energy more efficiently. Based on these measurements, it appears that the system is using energy relatively efficiently with most of the measurements falling within a narrow range. However, the maximum thermal efficiency 24.44% and EUF 0.85 at a pressure of 82 kgf/cm2 and minimum thermal efficiency 23.76% and EUF 0.72 achieved at a pressure of 80 kgf/cm2
Table 1. Operating parameters for turbine
|
S.No. |
mi, kg/sec |
Ti, ℃ |
Pi, kgf/cm2 |
m1 kg/sec |
T1, ℃ |
P1, kgf/cm2 |
m2, kg/sec |
T2, ℃ |
P2, kgf/cm2 |
m3 kg/sec |
T3, ℃ |
P3, kgf/cm2 |
|
1 |
22.69 |
502 |
82 |
1.5 |
240 |
5.11 |
14.28 |
156 |
0.88 |
6.72 |
29.3 |
-0.9 |
|
2 |
22.69 |
503 |
80 |
1.5 |
238 |
5.1 |
13.06 |
154 |
0.87 |
6.73 |
31.4 |
-0.91 |
|
3 |
22.69 |
510 |
81.3 |
1.4 |
241 |
5 |
13.53 |
156 |
0.89 |
6.75 |
30.9 |
-0.89 |
|
4 |
22.69 |
501 |
84.9 |
1.6 |
228 |
5.2 |
13.75 |
146 |
0.87 |
6.70 |
32.3 |
-0.91 |
|
5 |
22.69 |
504 |
83 |
1.6 |
213 |
5.2 |
14.17 |
148 |
0.8 |
6.72 |
31.6 |
-0.9 |
|
6 |
22.69 |
507 |
81.6 |
1.5 |
230 |
5.5 |
13.06 |
149 |
0.84 |
6.74 |
33.0 |
-0.91 |
|
7 |
22.69 |
500 |
85.4 |
1.6 |
220 |
5.2 |
13.36 |
144 |
0.78 |
6.69 |
33.2 |
-0.91 |
|
8 |
22.69 |
505 |
84.7 |
1.6 |
234 |
5.3 |
14.67 |
145 |
0.87 |
6.72 |
33.8 |
-0.9 |
|
9 |
22.69 |
508 |
82.3 |
1.5 |
230 |
5.4 |
14.25 |
148 |
0.83 |
6.74 |
34.4 |
-0.91 |
Table 2. Specific enthalpies, specific entropies and generated Power from the above Table 1
|
S.No. |
h1, kJ/kg |
S1, kJ/kg K |
h2, kJ/kg |
S2, kJ/kg K |
h3, kJ/kg |
S3, kJ/kg K |
h4, kJ/kg |
S4, kJ/kg K |
h10, kJ/kg |
S10, kJ/kg K |
|
1 |
3403.83 |
6.723 |
2935.9 |
7.1414 |
2781.8 |
7.341 |
2161.67 |
7.341 |
621.329 |
1.78955 |
|
2 |
3404.31 |
6.726 |
2931.6 |
7.1332 |
2777.8 |
7.334 |
2161.67 |
7.391 |
583.2 |
1.78955 |
|
3 |
3422.82 |
6.753 |
2938.3 |
7.1537 |
2781.8 |
7.338 |
2170.47 |
7.342 |
625.532 |
1.79982 |
|
4 |
3396.34 |
6.700 |
2910.0 |
7.0831 |
2761.4 |
7.295 |
2152.63 |
7.399 |
596.041 |
1.72777 |
|
5 |
3406.03 |
6.722 |
2877.8 |
7.0179 |
2766.0 |
7.32 |
2159.77 |
7.398 |
574.616 |
1.67636 |
|
6 |
3415.07 |
6.741 |
2913.1 |
7.0681 |
2767.8 |
7.317 |
2150.1 |
7.341 |
604.226 |
1.74881 |
|
7 |
3394.87 |
6.694 |
2892.9 |
7.0487 |
2758.0 |
7.309 |
2150.25 |
7.342 |
583.364 |
1.69672 |
|
8 |
3406.54 |
6.715 |
2922.4 |
7.1006 |
2759.3 |
7.290 |
2157.39 |
7.341 |
604.546 |
1.74831 |
|
9 |
3416.74 |
6.740 |
2913.5 |
7.0758 |
2765.8 |
7.315 |
2170 |
7.341 |
604.29 |
1.74871 |
Table 3. Energy flow rates, thermal efficiency and energy utilization factor for the input conditions for the turbine
|
S.No. |
mf kg/sec |
Ti, ℃ |
Pi |
E1, kW |
E2, kW |
Wnet, kW |
Qo, kW |
Ƞth, % |
EUF |
ȠO, % |
|
1 |
28.33 |
502 |
82 |
4322.29 |
39718.3 |
15437 |
59478 |
24.44 |
0.85 |
75.13 |
|
2 |
28.33 |
503 |
80 |
4397.50 |
36265.8 |
15217 |
55880 |
23.76 |
0.72 |
70.59 |
|
3 |
28.33 |
510 |
81.3 |
4244.32 |
37631.0 |
15225 |
57100 |
23.98 |
0.80 |
72.13 |
|
4 |
28.33 |
501 |
84.9 |
4688.39 |
37968.9 |
15407 |
58064 |
24.24 |
0.83 |
73.34 |
|
5 |
28.33 |
504 |
83 |
4476.62 |
39185.4 |
15590 |
59252 |
24.26 |
0.84 |
74.84 |
|
6 |
28.33 |
507 |
81.6 |
4369.65 |
36134.9 |
15183 |
55688 |
24.21 |
0.78 |
70.34 |
|
7 |
28.33 |
500 |
85.4 |
4500.09 |
36849.5 |
15413 |
56763 |
23.80 |
0.81 |
71.70 |
|
8 |
28.33 |
505 |
84.7 |
4627.16 |
40470. |
15455 |
60552 |
24.15 |
0.84 |
76.49 |
|
9 |
28.33 |
508 |
82.3 |
4370.25 |
39412.7 |
15481 |
59264 |
24.30 |
0.83 |
74.86 |
Figure 3. Inlet temperature Vs thermal efficiency & plant efficiency
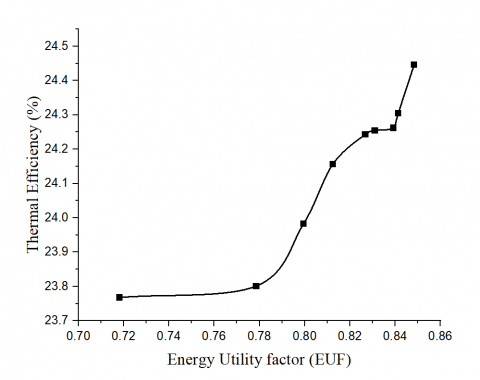
According to Figures 3 and 4, there is no trend in thermal efficiency with inlet pressure and inlet temperature, indicating that other parameters are also influencing thermal efficiency, and thus the energy utilisation factor (EUF) Eq. (14) was used to find the thermal efficiency trend shown in Figure 5. It reveals a range of energy utilisation factor values ranging from 0.72 to 0.85 and a range of thermal efficiency values ranging from 23.76% to 24.44%. However, some overlap exists in these ranges, with some measurements having a small fractional difference in thermal efficiency but a different energy utilisation factor, and vice versa. Even a fraction of a percentage difference saves a lot of energy.
Looking at the overall trend, it is observed that higher energy utilisation factor values tend to be associated with higher thermal efficiency values, which makes sense since a more efficient use of energy should result in a greater output.
Figure 4. Inlet pressure vs thermal efficiency & EUF
Figure 5. EUF vs thermal efficiency
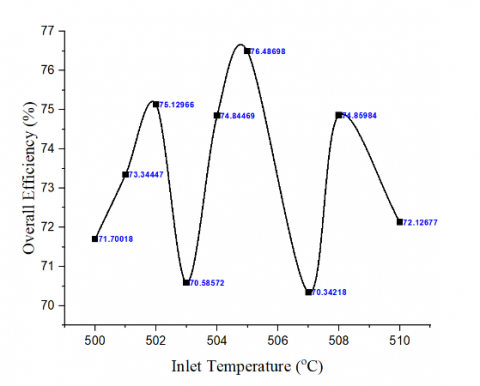
Figure 6. Inlet temperature Vs overall efficiency
Based on the data, the maximum thermal efficiency recorded is 24.46%. However, in a cogeneration power plant, a combination of high-grade and low-grade energy or heat recovery through steam extraction in stages is used to assess the overall efficiency. Additional findings related to overall efficiency, considering a constant fuel mass, are presented in Table 3. Figure 6 illustrates how overall efficiency values vary between 70.59% and 76.48% for temperatures ranging from 500℃ to 510℃, with the peak efficiency observed at 505℃ and the lowest at 503℃. Comparing efficiency ratings at different temperatures, it becomes evident that the impact of temperature on the system's efficiency diminishes at very high temperatures.
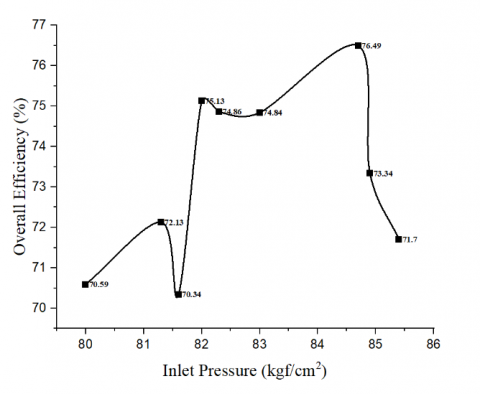
Figure 7 depicts the total efficiency values of a plant at various pressure settings. The pressure values range from 80 kgf/cm2 to 85.4 kgf/cm2, and the associated overall efficiency values range from 70.59% to 76.49%. At the maximum pressure of 85.4 kgf/cm2, the overall efficiency value is 72.92%, which is lower than the maximum overall efficiency of 76.49%. at a pressure of 84.7 kgf/cm2. This implies that the system's efficiency reduces at very high pressures. At a minimum pressure of 80 kgf/cm2, the overall efficiency is 70.59%. This demonstrates that the system's efficiency increases as the pressure increases. Overall, the evidence suggests that there is a relationship between pressure and overall efficiency, with efficiency being highest at moderate pressures and declining at both very high and very low pressures. It implies that the system's efficiency is reliant on the pressure at which it works and that there is an optimal pressure range for the system to run at in order to attain the best efficiency.
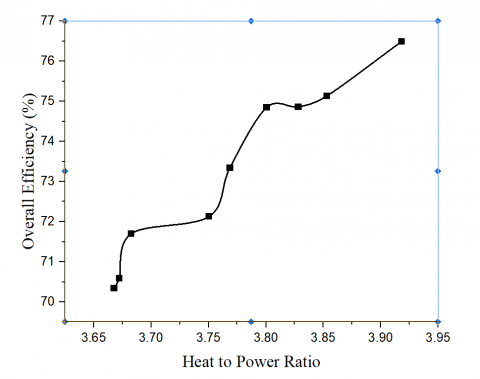
Figure 8 depicts the positive relationship between the heat-to-power ratio and the system's overall efficiency. The overall efficiency tends to grow as the heat-to-power ratio increases. Overall efficiency shows a clear growing trend as the heat-to-power ratio grows. For example, as the heat-to-power ratio rises from 3.67 to 3.92, efficiency rises from 70.34% to 76.49%. Overall, the results indicate that raising the heat-to-power ratio can lead to improved overall system efficiency.
Figure 7. Inlet pressure vs overall efficiency
Figure 8. Heat to power ratio vs overall efficiency
The performance test on the cogeneration power plant revealed valuable insights into the system's efficiency and energy utilization. The thermal efficiency (Ƞth) and energy utilization factor (EUF) were analyzed at various inlet temperatures (Ti) ranging from 500℃ to 510℃, with thermal efficiency ranging from 23.76% to 24.44%to 0.85, with the majority of measurements lying between 0.78 and 0.84. This indicates that the system uses energy efficiently, with higher scores suggesting reduced energy usage.
The highest thermal efficiency of 24.44% and EUF of 0.85 were achieved at 502℃, while the minimum thermal efficiency of 23.76% and EUF of 0.72 were recorded at 503℃. The data suggested that the system effectively utilized energy, with minor variations in thermal efficiency and EUF due to other influencing parameters.
The overall efficiency of the plant tends to increase as the Heat to Power Ratio rises. The data shows a clear increasing trend in overall efficiency as the Heat to Power Ratio increases from 3.67 to 3.92. The maximum power generation of 15,590 kW was achieved at a pressure of 83 kgf/cm2 with a temperature of 504°C, resulting in overall efficiency and thermal efficiency of 74.84% and 24.26%, respectively.
The study concludes that the thermal efficiency (Ƞth) and overall efficiencies of the cogeneration power plant are influenced not only by the inlet operating conditions but also by other operating parameters, such as stage 1 and stage 2 steam extraction conditions, determined by the effective energy utilization factor (EUF).
The maximum overall efficiency of 76.49% was attained at a pressure of 84.7 kgf/cm2 with a temperature of 505℃, while the minimum overall efficiency of 70.34% was recorded at a pressure of 80 kgf/cm2 with a temperature of 503℃. These findings indicate that there is an optimal pressure range for the system to operate to achieve the best overall efficiency.
Based on the findings, future research should concentrate on better understanding the interplay of numerous aspects influencing the overall performance of the cogeneration power plant. Experimenting with different inlet pressure and temperature combinations can help improve the system's efficiency and energy utilisation. Furthermore, performing a thorough investigation into the impact of various fuel types and their mass on overall efficiency will provide insights into optimising energy utilisation in the cogeneration process.
Authors would like to thank Matrusri Education Society, Hyderabad and LOKNATHE SUNDERRAOJI SOLANKE SAHAKARI SAKHAR KHARKHANA LTD., TELGAON for supporting in carryout the experimental work.
|
FW |
Feed water |
|
Pi |
Inlet pressure, kgf/cm2 |
|
h |
Specific enthalpy, kJ/kg |
|
S |
Specific entropy, kJ/kg K |
|
$\dot{m}_{f}$ |
Mass flowrate of fuel, kg/sec |
|
Ti |
Inlet temperature, ℃ |
|
$\dot{m}_{i}$ |
Mass flowrate of steam at inlet, kg/sec |
|
Wnet |
Net power |
|
δ |
Heat to power ratio |
|
P1 |
Pressure at Stage 1, kgf/cm2 |
|
T1 |
Temperature at Stage 1 |
|
P2 |
Pressure at stage 2, kg/cm2 |
|
T2 |
Temperature at stage 2 |
|
P3 |
Pressure, kg/cm2 |
|
h1 |
Specific enthalpy at stage 1, kJ/kg |
|
S1 |
Specific entropy at stage 1, kJ/kg K |
|
$\dot{\mathrm{m}}_1$ |
Mass flowrate of steam at stage 1, kg/sec |
|
h2 |
Specific enthalpy at stage 2, kJ/kg |
|
S2 |
Specific entropy at stage 2, kJ/kg K |
|
$\dot{\mathrm{m}}_2$ |
Mass flowrate of steam at stage 2, kg/sec |
[1] Feidt, M., Costea, M. (2012). Energy and exergy analysis and optimization of combined heat and power systems. Comparison of various systems. Energies, 5(9): 3701-3722. https://doi.org/10.3390/en5093701
[2] Ameri, M., Mokhtari, H., Bahrami, M. (2016). Energy, exergy, exergoeconomic and environmental (4E) optimization of a large steam power plant: A case study. Iranian Journal of Science and Technology, Transactions of Mechanical Engineering, 40: 11-20. https://doi.org/10.1007/s40997-016-0002-z
[3] Campero, L.A.C., Wang, W., Martin, A. (2023). Thermodynamic and exergetic analyses of a biomass-fired Brayton-Stirling cogeneration cycle for decentralized, rural applications. Energy Conversion and Management, 292: 117350. https://doi.org/10.1016/j.enconman.2023.117350
[4] Gilewski, J., Montusiewicz, J. (2014). Combined systems of energy generation–a characterisation and classification. Advances in Science and Technology. Research Journal, 8(23): 53-61. https://doi.org/10.12913/22998624.1120323
[5] Varma, G.P., Srinivas, T. (2015). Design and analysis of a cogeneration plant using heat recovery of a cement factory. Case Studies in Thermal Engineering, 5: 24-31. https://doi.org/10.1016/j.csite.2014.12.002
[6] Negro, E., Cardinale, N., Rospi, G. (2017). Design of small cogeneration system for public buildings in the town of Matera. International Journal of Heat and Technology, 35(1): 228-235. https://doi.org/10.18280/ijht.35Sp0132
[7] Domnikov, A., Khodorovsky, M., Domnikova, L. (2020). Competitive development of energy cogeneration systems in conditions of economic imbalances. International Journal of Energy Production and Management, 5(4): 342-354. http://doi.org/10.2495/EQ-V5-N4-342-354
[8] Domnikov, A., Khodorovsky, M. (2021). Methodological approach to the research of energy cogeneration systems operational reliability indicators. International Journal of Energy Production and Management, 6(3): 263-276. https://doi.org/10.2495/EQ-V6-N3-263-276
[9] Shcheklein, S.E., Dubinin, A.M. (2019). Thermodynamic modeling of cogeneration mini CHP using air conversion of diesel fuel and electrochemical generator. International Journal of Energy Production and Management, 4(4): 273-286. http://doi.org/10.2495/EQ-V4-N4-273-286
[10] Bapat, S.M., Gokak, G.D. (2019). Exergetic evaluation and optimization of Combined Heat and Power (CHP) plant of 20.7 MW capacities under varying load conditions: A case study. European Journal of Electrical Engineering, 21(2): 207-219. https://doi.org/10.18280/ejee.210212
[11] Gürtürk, M., Oztop, H.F. (2016). Exergy analysis of a circulating fluidized bed boiler cogeneration power plant. Energy Conversion and Management, 120: 346-357. https://doi.org/10.1016/j.enconman.2016.05.006
[12] Kabeyi, M.J.B., Olanrewaju, O.A. (2022). Performance analysis and electricity potential for Nzoia sugar factory. Energy Reports, 8: 755-764. https://doi.org/10.1016/j.egyr.2022.10.432
[13] Khaleel, O.J., Ismail, F.B., Ibrahim, T.K., bin Abu Hassan, S.H. (2022). Energy and exergy analysis of the steam power plants: A comprehensive review on the Classification, Development, Improvements, and configurations. Ain Shams Engineering Journal, 13(3): 101640. https://doi.org/10.1016/j.asej.2021.11.009
[14] Khaleel, O.J., Ibrahim, T.K., Ismail, F.B., Al-Sammarraie, A.T. (2021). Developing an analytical model to predict the energy and exergy based performances of a coal-fired thermal power plant. Case Studies in Thermal Engineering, 28: 101519. https://doi.org/10.1016/j.csite.2021.101519
[15] Ciuła, J., Kowalski, S., Generowicz, A., Barbusiński, K., Matuszak, Z., Gaska, K. (2023). Analysis of energy generation efficiency and reliability of a cogeneration unit powered by biogas. Energies, 16(5): 2180. https://doi.org/10.3390/en16052180
[16] Deboni, T.L., Simioni, F.J., Brand, M.A., Lopes, G.P. (2019). Evolution of the quality of forest biomass for energy generation in a cogeneration plant. Renewable Energy, 135: 1291-1302. https://doi.org/10.1016/j.renene.2018.09.039
[17] Srinivas, T., Gupta, A.V.S.S.K.S., Reddy, B.V., Nag, P.K. (2006). Parametric analysis of a coal based combined cycle power plant. International Journal of Energy Research, 30(1): 19-36. https://doi.org/10.1002/er.1119
[18] Bo, Z., Zhang, K., Sun, P., Lv, X., Weng, Y. (2019). Performance analysis of cogeneration systems based on micro gas turbine (MGT), organic Rankine cycle and ejector refrigeration cycle. Frontiers in Energy, 13: 54-63. https://doi.org/10.1007/s11708-018-0606-7
[19] Kabeyi, M.J.B., Olanrewaju, O.A. (2021). Preliminary design of a bagasse based firm power plant for a sugar factory. In 2021 Southern African Universities Power Engineering Conference/Robotics and Mechatronics/Pattern Recognition Association of South Africa (SAUPEC/RobMech/PRASA), Potchefstroom, South Africa, pp. 1-9. https://doi.org/10.1109/SAUPEC/RobMech/PRASA52254.2021.9377242