Balamurugan Karnan* | Arunkarthikeyan Kuppusamy
© 2021 IIETA. This article is published by IIETA and is licensed under the CC BY 4.0 license (http://creativecommons.org/licenses/by/4.0/).
OPEN ACCESS
Cryogenic treatment is a sustainable manufacturing process preferred to improve the properties of the material. In the present study, the effect of cryo treated tungsten carbide cobalt bonded insert (WC-Co) measured in terms of tool life and surface finish on dry turning on high strength AISI4340 steel at different machine parametric conditions. The observations of Untreated (UT) and Deep Cryo Treated (DCT) inserts were compared. Formation and the distribution of eta phase carbides are verified by Scanning Electron Micrograph (SEM). The DCT insert shows a reduction in 27.27% tool wear with an acceptable level of surface finish. Taguchi's coupled Graph Theory and Matrix Approach (TC-GTMA) is used to predict the optimum machining condition and to substantiate the results the validation experiment is conducted and found satisfactory.
deep cryo treatment, hardened steel, machinability, surface roughness, taguchi’s graph theory, tool wear rate
The manufacturing sector strives to improve product quality at an affordable cost. Citti et al. [1] stated that AISI 4340 steel has nickel and chromium as the element compositions with martensite structure, high fatigue, and hardness increase the utilization of materials in gears and shafts for power transmission, aircraft landing gear, etc. According to Krolczyk et al. [2], machining of advanced materials like nickel and titanium-based superalloys will reduce the tool life. As such materials have higher strength and low thermal conductivity and the ability to strain to harden that progressively decreases the machining efficiency. Rakesh and Datta [3] reported that the higher hardness and difficult to machine materials will considerably reduce the machining performance with rapid tool wear, increase in cutting temperature, power consumption, and high influence on surface finish.
Shalaby and Veldhuis [4] confirmed that machining of nickel-based superalloys progresses to excess tool wear because of the low heat conduction and strain hardening properties at elevated machining temperatures. Padhan et al. [5] have claimed that machining of austenitic stainless steel is considerably complicated than superalloys as the nickel-chromium structure resists heat transformation and creates excess tool wear and coarse surface profile roughness.
Panda et al. [6] stated that excess tool wear creates coarse surface roughness (Ra), and increases in machine idle time, cost of production, etc. Balamurugan et al. [7] stated that the tool life has a significant role in production, and progress to have a reduction in manufacturing cost. Arunkarthikeyan and Balamurugan [8] reported that the modern machining process requires a higher degree of Material Removal Rate (MRR) with surface quality even at high-speed machining. According to Das et al. [9], excessive MRR increases the cutting force on the tool material and it softens the tool material that progresses to tool tip loss and causes surface variability. As reported by Raja and Malayalamurthi [10] to have the maximum MRR, the cutting tool should be rigid, strong, wear-resistant, tough, chemically inert, and antifriction with the chip material to avoid premature failure.
To overcome the machining difficulties, Korade et al. [11] proposed to enhance the properties of cutting tool materials with high resistance to wear and thermal resistance. Mukkoti et al. [12] reported that the interaction effect between the cutting parameters would greatly influence the tool materials. As the tool material properties have to withstand the stresses and temperature that are developed at the high-speed machining. Sartori et al. [13] claimed that the cutting tool suffers from flank and crater wear is because of the abrasion action exists between the tool and workpiece. This action may result in a considerable increase in Ra, cutting force, and power consumption. The machinability study by Gong et al. [14] revealed that the higher cutting speeds will facilitate diffusion tool wear, which results in tool nose failure.
Deshpande et al. [15] found an improvement in the tool life with the cryogenic condition than other enhancing processes like coating, heat treatment, minimum quantity lubrication (MQL). According to Akincioglu et al. [16], cryo treatment a low-temperature treatment and it was categorized as Shallow Cryogenic Treatment (SCT) and Deep Cryogenic Treatment (DCT). The cryo or sub-zero treatment is preferred to improve the tool material properties that are with various grades such as tool steels, ferrous alloys, aluminium alloys, magnesium alloys, and non-metallic composites.
Li et al. [17] identified that an improvement in tool properties may change based on the tool material quality, cryo holding temperature and holding duration, post-tempering temperature, and holding duration, test conditions, heating rate, and cooling rate. The study further confirms that the tempering process followed by cryo treatment will relieve the internal stresses that are created during the tool manufacturing process. The investigation by Khan an Maity [18] reported that cryo treated tool has 9% improved hardness compared to the UT tools. In contrarily, Seah et al. [19] claimed that cryogenic treatment on WC inserts shows no significant improvement such as wear-resistance and hardness of the WC insert. Further, Thakur et al. [20] substantiate the result as there was no improvement in cryo treated carbide tools.
A machinability study by Kara et al. [21] claimed that deep cryo treated tool have an improved tool life while turning of AISI D2. Saini et al. [22] adopted various cryo treatment cycles on a cutting tool to enhance tool life and surface finish. Sivalingam et al. [23] performed the end milling operation on Ti-based alloy using DCT tools and found an improved Ra.
There are different multi-response optimisation techniques such as Artificial Neural Networks (ANN), Grey Relational Analysis (GRA), Taguchi's Coupled Genetic Algorithms (TC-GA), and Response Surface Methodology (RSM) are used to optimize the process parameters in machining. Such optimization methods have constraints in terms of processing time, understanding, software compatibility, level of precision of optimization, etc. Hussain [24] applied Taguchi's technique for the multi responses conditions on less tool wear and Ra in turning the high carbon stainless steel and found improved machining performance. Balamurugan et al. [25] performed the abrasive water jet machining (AWJM) on Lanthanum/Yittria based ceramic composites and optimized the machining conditions using Taguchi integrated GRA. The statistical models was developed for Ra, and energy consumption to optimize the machining parameters.
Arunkarthikeyan et al. [26] used Taguchi based GRA on turning of AISI 1040 using cryo treated WC-Co inserts and optimized the input parameters for the improved machinability. Rao et al. [27] applied Taguchi-based GTMA and utility concept approaches to optimize the machining parameters in terms of Ra, tool wear, and workpiece vibration velocity during the drilling studies on AISI 1040 steel. Latchoumi et al. [28] developed optimization algorithms using Particle Swarm Optimization for advanced waterjet machining on the ceramic composite samples. Rao and Patel [29] reported on the decision making approaches, such as analytical hierarchical model, analytical network method, and fuzzy methods to quantify response weights. These techniques increase computation complexity and time-consuming.
Graph Theory and Matrix Approach (GTMA) is a systemic methodology based on combinatorial science which will reduce the mathematical complicity. GTMA recognizes the system as a whole by discrimination between the framework and the module at the section level. Also, helps to make the most rational choice from a huge number of alternatives for a specific problem. Recent works are being carried out using the integrated approaches to weighting and optimizing the process parameters as required for the customers. Ahilan et al. [30] have developed an enhanced decision-making model with neural networks to identify the optimal turning conditions.
The objective of the present work is to study the performance enhancement of DCT WC-Co tools in terms of TWR and Ra during the turning of the AISI 4340 alloy steel and aimed to suggest the optimized machining condition to perform the economic machining. The turning experiments are performed based on Taguchi's L27 orthogonal array on a NAGMATI 175 semi-automatic lathe with DCT and UT WC-Co inserts. Taguchi integrated GTMA is applied to weighting and optimizing the turning process parameters. The validation exercise is performed to substantiate the observations.
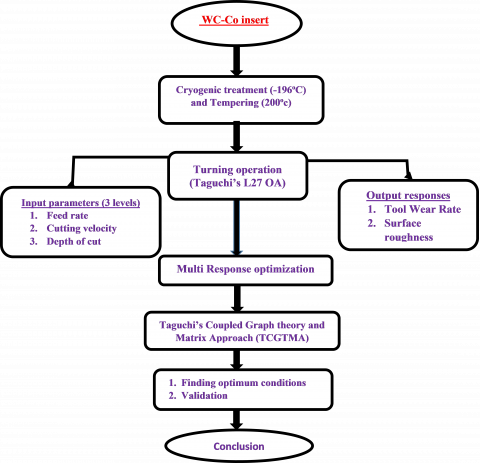
The experimental workflow is shown in Figure 1. The WC-Co insert is subjected to sub-zero treatment and the machinability characteristics are measured on turning of AISI4340 in terms of TWR and Ra. TWR is calculated by the weight-loss method and the Ra is measured using the Mitutoyo surface roughness analyzer. The elemental composition of the workpiece AISI 4340 (EN24) is shown in Table 1. EN24 material with a length of 500 mm and a diameter of 100 mm is used for a machining length of 300mm. The ISO designated DNMG 150608 uncoated WC-Co insert used for the right-hand tool holder ISO PSBNR2020K11 is taken as the tool material. The process adopted for the cryo treatment is shown in Figure 2.
Figure 1. Workflow diagram
Table 1. AISI 4340 steel composition
|
Work-piece |
C |
Si |
Mn |
Ni |
Cr |
Mo |
S |
P |
Fe |
|
AISI 4340 Comp. (%) |
0.4 |
0.3 |
0.55 |
1.70 |
1.4 |
0.35 |
0.035 |
0.04 |
Remaining |
Figure 2. Process of deep cryo heat treatment
Microhardness is measured at a weight load condition of 300 gram for a dwell period of 10 Seconds using the Mitutoyo Vickers microhardness tester. Three input parameters such as Cutting Velocity (CV), Feed Rate (FR), Cutting Depth (DOC), with three levels (low, medium, and high) were taken as the turning conditions. The morphology and microstructure analysis on cryo-treated WC-Co inserts is examined through the Scanning Electron Microscope (SEM).
2.1 TC-GTMA
Graph theory is a systematic and standardized method. The advanced graph theory and its implementations are well known. Rao [31] introduces this approach and discusses several of its implementation techniques in the book, the title of “Decision in the manufacturing environment utilizing graph theory and ambiguous multiple attribute decision-making approaches”. Graph / Digraph Model representations are effective for modeling and evaluating different forms of environments and issues in different fields in engineering science and technology. The matrix method is useful for the quick study of graph/digraph models to extract the device feature and index to achieve the objectives. Graph theory and matrix approaches are composed of digraph interpretation, matrix interpretation, and permanent function interpretation. The digraph is a schematic description of the factors and their interconnections. The matrix transforms the digraph into a computational form and the permanent function is a graphical expression that helps to decide the numerical index.
The TC-GTMA steps are as follows.
Step 1: Identify the attributes and the alternatives involved in study
Determine the dependent responses for the provided engineering component and narrow down the experimental runs based on the parameters that fulfil the criteria. Each detected component may be allocated a statistical or qualitative value, or a set of parameters, as a limiting value or threshold value for acceptability in the examined application.
Step 2: Making the graphical interconnections between the attributes
Figure 3. Interconnection of attributes
The graph model depicts the output variables and their interrelationships. A collection of nodes V = vi, with i = 1, 2,.... N, and a set of directed edges D = dij constitute this graph. The i-th output factor is represented by the node ni, and the edges show the relative significance of the factors. The number of output factors N is proportional to the quantity of nodes evaluated. Whenever a node i in the objective function has a higher relative importance than another node ‘j,' a straight edge or arrow is constructed from node i to node j. (i.e. dij). If node j is more important than node i a straight edge or arrow is constructed from node j to node i. (dji).
Step 3: Normalize the attributes
$N_{i j}=\frac{a_{i j}}{\sqrt{\sum_{i=1}^{m} a_{i j}^{2}}}$ (Beneficial) (1)
$N_{i j}=1-\frac{a_{i j}}{\sqrt{\sum_{i=1}^{m} a_{i j}^{2}}}$ (Non-beneficial) (2)
aij is the performance of i th alternative concerning the j th attribute
Step 4: Develop the permanent matrix P(H) for the attributes graph
The output factors graph is represented as a matrix, which offers a one-to-one representation. The output factors matrix is defined as a matrix. This is a N × N matrix that assesses all of the variables (i.e. Ri) and their relative significance (i.e. rij). The attributes graph in Figure 3 is represented by the matrix P(m):
$\mathrm{P}(m)=\left[\begin{array}{cccccc}R_{11} & r_{12} & r_{13} \cdots & \cdots & r_{1 j} \\ r_{21} & R_{22} & r_{23} \cdots & \cdots & r_{2 j} \\ r_{31} & r_{32} & R_{33} \cdots & \cdots & r_{3 j} \\ \vdots & \vdots & \vdots \ddots & \ddots & \vdots \\ \vdots & \vdots & \vdots \ddots & \ddots & \vdots \\ r_{i 1} & r_{i 2} & r_{i 3} \cdots & \ldots & R_{i j}\end{array}\right]$ (3)
rij is the relative importance of i th alternative concerning the j th attribute.
Step 5: Calculate the determinant of the matrix
$|P(m)|=\left[\begin{array}{cccccc}R_{11} & r_{12} & r_{13} \cdots & \cdots & r_{1 j} \\ r_{21} & R_{22} & r_{23} \cdots & \cdots & r_{2 j} \\ r_{31} & r_{32} & R_{33} \cdots & \cdots & r_{3 j} \\ \vdots & \vdots & \vdots & \ddots & \vdots \\ \vdots & \vdots & \vdots & \ddots & \ddots & \vdots \\ r_{i 1} & r_{i 2} & r_{i 3} \cdots & \ldots & R_{i j}\end{array}\right]$ (4)
Step 6: Find the value of the permanent function for the attributes
$\mathrm{P}(m)=[p(m)]_{\mathrm{i} \times j}$ (5)
$P(m)_{i j}$ is the permanent function of i th alternative (i=1,2,3….N) concerning the j th attribute (j=1)
Step 7: Calculate the Signal to Noise ratio (S/N) for the alternatives
$\frac{s}{N}$ ratio $=-10 \log \left(\frac{1}{n}\right) \sum_{i=1}^{n} \frac{1}{Y i j^{2}}$ (Larger the best) (6)
$\frac{s}{N}$ ratio $=-10 \log \left(\frac{1}{n}\right) \sum_{i=1}^{n} Y i j^{2}$ (Smaller the best) (7)
Step 8: Rank the alternatives depending on the S/N ratio values
3.1 Microstructural and micro hardness
The three main phases comprised in the WC-Co inserts are the tungsten carbide process (α-alpha), the Cobalt binder process (β-beta), and the various tungsten carbide and cobalt layer (a mixture of two). A microstructural study confirms the presence of the expanded WC grains with a high-density Co matrix and the formation of fine eta (substantial) distribution after treatment. The enlarged WC phase increases the thermal conductivity of the materials that signify the high heat transfer. The microstructure features of DCT and UT WC-Co inserts after machining is shown in Figure 4(a-b) & 4(c-d) respectively. The formation of fine carbide during cryo treatment results in a positive effect of cryo treatment on the cutting tool, which improves the microstructure. After the cryo and tempering treatment, the fine eta carbides have occupied the void left behind by the β phase and uniformly distribute the grains, create a denser, more cohesive, and tougher surface matrix. Whereas in the UT tool, the void regions with irregular grain distribution are noticed.
The microhardness test is performed at three distinct places and the mean values are recorded and shown in Figure 5. Cryogenic treatment increases the hardness is improved by 6.5 % relative to the untreated tool. The incident is associated with the uniform distribution of grains and the development of fine carbides across the surface of the cryo-treated tool.
|
DCT |
UT
|
|
(a) |
(c) |
|
(b) |
(d) |
Figure 4. SEM images for the WC-Co inserts (a-b) DCT (c-d) UT
Figure 5. Microhardness comparison of WC-Co inserts
Figure 6. TWR comparison for WC-Co inserts
3.2 Tool wear rate analysis
The crater wears caused due to the rubbing action of the cutting tool on the work surface attribute to have different wear mechanisms such as abrasive, adhesive, and diffusive wears. Further result in the increase of machining temperature that leads to have the tool nose distortion.
A variation occurred on the TWR for the UT and DCT inserts are shown in Figure 6. For UT inserts, maximum and minimum TWR is recorded for T1 and T9 experimental runs with the values are 27.5 mg/min, and 15 mg/min, respectively. Maximum and minimum TWR for DCT insert is observed for the T9 and T2 experimental run with the values of 23 mg/min, and 12 mg/min, respectively. It is found that, T9 experimental run shows the maximum TWR for all cutting inserts is mainly because of the machining conditions. As it has higher level of CV and DOC combined with low feed. The increases in machining time generate high cutting temperatures that progress to have maximum TWR. On the other hand, a higher level of FR reduces TWR. In general, cryogenically treated inserts shows better tool life characteristics.
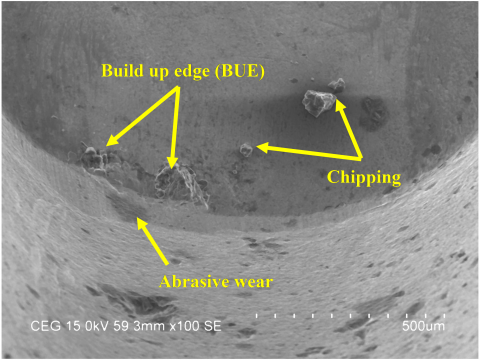
Figure 7 shows the wear comparison between the UT and DCT insert after dry turning for the T9 experimental run. In Figure 7(a), a sharp edge is worn out due to abrasive wear. The built-up edge (BUE) is formed due to adhesive and chipping action formed due to the diffusion behavior of particles. Arulkirubakaran et al. [32] reported that the abrasion wear mechanism is the predominant wear in high-speed machining which almost resembles in the present work.
The foreign particles from the workpiece adhered to the tool surface are confirmed through the BUE formation. Microchipping and fracture on the UT tool are because of the ultimate plastic deformation encountered due to the cutting force and temperature and it can be verified from Figure 7(a). The micrograph for the cryo treated insert is shown in Figure 7(b). The DCT insert nose is stable and resists the plastic deformation as the presence of ղ-eta phase particles in the microstructure allows heat transfer and provides stability at high machining temperature, less wear, and free from diffusive wear. The percentage of TWR and Ra reduction for the treated WC-Co insert in comparison with the UT is shown in Table 2. Maximum and minimum TWR reduction percentage is observed for T17 and T24 experimental runs and the values are 33.3, and 13.3% respectively. The investigation by Ozbek et al. [33] claimed that the cryo treatment process will enhance the tool life to 48%.
3.3 Surface profile roughness analysis
Variation in Ra for UT and DCT inserts are showed in Figure 8. It is identified that the DCT insert gives a superior surface finish compared to the UT insert because of the tool nose stability even at high cutting temperatures. In the absence of eta phase carbides in the UT tool, workpiece particles sticking with the UT tool material during the high-speed machining cause rough surface finish.
Table 2. TWR reduction percentages
|
Trail. No |
FR (mm/rev) |
CV (m/min) |
DOC (mm) |
TWR Reduction |
Ra Reduction |
|
% |
% |
||||
|
T1 |
0.102 |
79 |
0.4 |
16.7 |
16.0 |
|
T2 |
0.102 |
79 |
0.4 |
27.3 |
16.1 |
|
T3 |
0.102 |
79 |
0.4 |
16.7 |
13.6 |
|
T4 |
0.102 |
121 |
0.6 |
21.4 |
15.4 |
|
T5 |
0.102 |
121 |
0.6 |
15.0 |
24.9 |
|
T6 |
0.102 |
121 |
0.6 |
26.1 |
25.1 |
|
T7 |
0.102 |
188 |
0.8 |
18.5 |
14.3 |
|
T8 |
0.102 |
188 |
0.8 |
13.5 |
14.2 |
|
T9 |
0.102 |
188 |
0.8 |
16.4 |
14.3 |
|
T10 |
0.143 |
79 |
0.6 |
26.5 |
9.3 |
|
T11 |
0.143 |
79 |
0.6 |
18.8 |
9.4 |
|
T12 |
0.143 |
79 |
0.6 |
22.2 |
10.2 |
|
T13 |
0.143 |
121 |
0.8 |
27.1 |
5.4 |
|
T14 |
0.143 |
121 |
0.8 |
32.0 |
4.8 |
|
T15 |
0.143 |
121 |
0.8 |
26.5 |
6.4 |
|
T16 |
0.143 |
188 |
0.4 |
25.0 |
14.3 |
|
T17 |
0.143 |
188 |
0.4 |
33.3 |
15.4 |
|
T18 |
0.143 |
188 |
0.4 |
27.5 |
15.6 |
|
T19 |
0.191 |
79 |
0.8 |
18.8 |
17.9 |
|
T20 |
0.191 |
79 |
0.8 |
22.2 |
19.6 |
|
T21 |
0.191 |
79 |
0.8 |
27.0 |
18.3 |
|
T22 |
0.191 |
121 |
0.4 |
20.0 |
3.0 |
|
T23 |
0.191 |
121 |
0.4 |
18.8 |
3.5 |
|
T24 |
0.191 |
121 |
0.4 |
13.3 |
3.9 |
|
T25 |
0.191 |
188 |
0.6 |
24.0 |
15.4 |
|
T26 |
0.191 |
188 |
0.6 |
23.1 |
15.6 |
|
T27 |
0.191 |
188 |
0.6 |
29.4 |
15.7 |
The Ra reduction percentage for the treated tools is displayed in Table 2. T21 experimental run shows the higher value of Ra for both tools and the values for DCT and UT are 3.089 µm, and 3.783µm, respectively. The higher operating level of FR and DOC increases the tool-chip contact area and subsequently cause tool charter vibration that induces tool marks on the machined surface. Minimum Ra for DCT is 2.562 µm and it was observed for the T7 experimental run. Surface finish increases with increasing the CV concerning FR and DOC. Maximum and minimum Ra reduction is observed for T6 and T22 experimental runs with a percentage of 25.1%, and 3%, respectively. It is observed that DCT insert exhibits the better surface profile finish while machining of AISI 4340 steel compared to UT insert. Arunkarthikeyan et al. [34-37] reported that cryo treated carbide tools will provide improved surface characteristics even at high-speed machining.
Figure 8. Ra comparison of WC-Co inserts
3.4 3D interaction plot analysis for TWR
Figure 9(a-c) shows that the combined effect of cutting parameters such as CV and DOC, FR and CV, FR, and DOC on the TWR for DCT carbide tools. It is identified that CV predominantly influences in the tool life for DCT and UT tools. On the other hand, FR and DOC have minimal effect. The DOC when it is combined with CV has rapidly increased the tool wear rate rapidly. Figure 9(d-f) shows the interaction effect of cutting parameters such as CV and DOC, FR and CV, FR, and DOC on TWR for the UT tool. The lower level of FR combined with higher levels of CV progress to excessive wear. TWR will be increased with increasing in CV and DOC irrespective of FR.
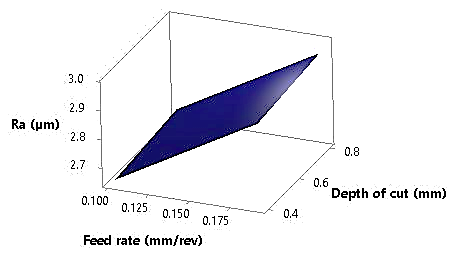
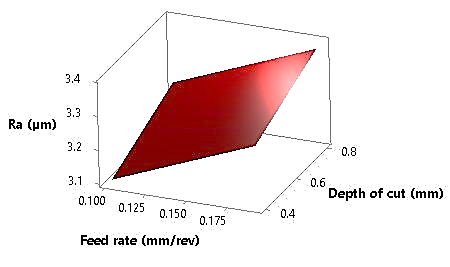
3.5 3D interaction plot analysis for Ra
The interaction plot analysis is used to identify the effect of process parameters concerning the output responses. Figure 10 (a-c) shows that the interaction effect of cutting parameters on the Ra for DCT insert. The FR and CV show significant observations in Ra also, it gets increased with the improvement in the levels of DOC. The interaction effect of cutting parameters such as CV and DOC, FR and CV, FR, and DOC on Ra for UT insert is shown in Figure 10 (g-i). The interaction effect of FR and DOC with lower CV leads to the increment in Ra.
Turning experiments are performed according to the Taguchi’s L27 Orthogonal Array (OA) experimental design. TWR and Ra are the dependent variables taken as for defining the optimum cutting conditions for the multi-objective optimization study. Taguchi’s coupled Graph Theory and Matrix Approach (TC-GTMA) is performed for multi-response optimization.
(Step-I) In the present work, the factors considered are Tool Wear Rate (TWR) and Surface profile roughness (Ra). (Step-II) The interconnections between the attributes are graphically drawn and it's displayed in Figure 11. (Step-III) The quantitative values of the machinability attribute such as TWR and Ra, are to be normalized. For the given machinability problem, both are considered beneficial attributes. Values of both responses are normalized, as explained in Section 2.1 and given in Table 3 in the respective columns. (Step-IV) The relative importance of factors (rij) is also assigned the values as explained in Section 2.1. In this problem, both the factors are considered as equal importance one over another. According to that, the permanent matrix is developed. (Step-V) However, the determinant of the permanent matrix is calculated to eliminate the negative sign. (Step-VI) Then the permanent function values are calculated for all the alternative experimental trails, which are tabulated in Table 3. (Step- VII) Furthermore, Taguchi’s technique is then converted to the GTMA Permanent matrix P(m) value into Signal to Noise ratio (S/N), based on the experiments.
To identify the experimental value that is nearer to an idle solution, P (m) value is taken as a target value. (Step- VIII) The results obtained from Step VII ranked according to the descending order. In that, experimental trial T2 shows the highest value.
The multiple responses are converted into a single response by using GTMA and are shown in Table 3. The responses are considered as equal importance in this study and the interconnections between the responses are shown in Figure 11.
|
TWR_DCT |
TWR_UT |
|
(a) |
(d) |
|
(b) |
(e) |
|
(c) |
(f) |
Figure 9. Surface plot for TWR (a-c) DCT (d-f) UT
|
Ra_DCT |
Ra_UT |
|
(a) |
(d) |
|
(b) |
(e) |
|
(c) |
(f) |
Figure 10. Surface plot for Ra (a-c) DCT (d-f) UT
The statistical software (MINITAB 17.0) is used to calculate the means of the P (m) values in individual levels of the considered input parameters. The results are displayed in Table 4. CV is the most influencing factor on the response, followed by DOC and the FR. The maximum means of means is taken as optimum and the corresponding machining condition (FR3-CV1-DOC1) is selected for validation and the observations are shown in Table 5.
Table 3. TC-GTMA calculations
|
Trail No |
TC-GTMA calculations |
Interaction effect of cutting parameters on Perm. Function |
||||
|
TWR Norm. |
Ra Norm. |
Perm. function |
S/N Ratio |
Rank |
||
|
T1 |
0.9600 |
0.1885 |
0.4309 |
-7.311 |
3 |
|
|
T2 |
1.0000 |
0.1890 |
0.4390 |
-7.151 |
1 |
|
|
T3 |
0.9600 |
0.1887 |
0.4311 |
-7.308 |
2 |
|
|
T4 |
0.7273 |
0.1950 |
0.3918 |
-8.139 |
13 |
|
|
T5 |
0.7059 |
0.1948 |
0.3875 |
-8.235 |
15 |
|
|
T6 |
0.7059 |
0.1949 |
0.3876 |
-8.233 |
14 |
|
|
T7 |
0.5455 |
0.2036 |
0.3611 |
-8.848 |
25 |
|
|
T8 |
0.5333 |
0.2036 |
0.3586 |
-8.909 |
26 |
|
|
T9 |
0.5217 |
0.2032 |
0.3560 |
-8.971 |
27 |
|
|
T10 |
0.9600 |
0.1791 |
0.4219 |
-7.495 |
5 |
|
|
T11 |
0.9231 |
0.1785 |
0.4148 |
-7.644 |
7 |
|
|
T12 |
0.9231 |
0.1789 |
0.4152 |
-7.636 |
6 |
|
|
T13 |
0.6857 |
0.1845 |
0.3765 |
-8.485 |
19 |
|
|
T14 |
0.7059 |
0.1838 |
0.3798 |
-8.410 |
17 |
|
|
T15 |
0.6667 |
0.1844 |
0.3730 |
-8.567 |
21 |
|
|
T16 |
0.6154 |
0.1982 |
0.3719 |
-8.591 |
22 |
|
|
T17 |
0.6667 |
0.1988 |
0.3825 |
-8.347 |
16 |
|
|
T18 |
0.6486 |
0.1988 |
0.3790 |
-8.428 |
18 |
|
|
T19 |
0.9231 |
0.1693 |
0.4063 |
-7.823 |
10 |
|
|
T20 |
0.8571 |
0.1724 |
0.3978 |
-8.007 |
12 |
|
|
T21 |
0.8889 |
0.1689 |
0.4001 |
-7.956 |
11 |
|
|
T22 |
1.0000 |
0.1739 |
0.4239 |
-7.456 |
4 |
|
|
T23 |
0.9231 |
0.1751 |
0.4116 |
-7.710 |
9 |
|
|
T24 |
0.9231 |
0.1772 |
0.4135 |
-7.670 |
8 |
|
|
T25 |
0.6316 |
0.1867 |
0.3679 |
-8.685 |
23 |
|
|
T26 |
0.6000 |
0.1865 |
0.3619 |
-8.829 |
24 |
|
|
T27 |
0.6667 |
0.1871 |
0.3747 |
-8.526 |
20 |
|
Figure 11. The inter-relationship between the responses
Table 4. Means of Means (Permanent function)
|
Factors |
Permanent function values (TC-GTMA) |
||||
|
Low |
Medium |
High |
Delta |
Rank |
|
|
FR |
0.3937 |
0.3905 |
0.3953 |
0.0048 |
3 |
|
CV |
0.4175 |
0.3939 |
0.3682 |
0.0493 |
1 |
|
DOC |
0.4093 |
0.3915 |
0.3788 |
0.0305 |
2 |
Table 5. Validation of P (m) optimum condition
|
Validation |
Input machining conditions |
Optimized process parameters using P(m) |
Change in results at the optimum conditions over initial parameter setting |
|
|
Predicted |
Experiment |
|||
|
Levels |
FR3-CV2-DOC2 |
FR3-CV1-DOC1 |
FR3-CV1-DOC1 |
% |
|
TWR (mg/min) |
16.5 |
|
12 |
27.27 (Reduction) |
|
Ra (µm) |
2.904 |
2.904 |
0 (No improvement) |
|
|
P (m) |
0.3807 |
0.4357 |
0.4297 |
12.87 (Improvement) |
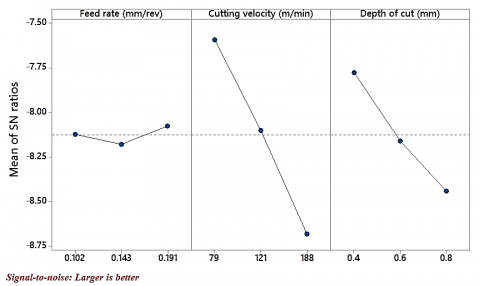
Figure 12. Means of S/N ratio plot
The means of the S/N ratio for three input factors and three levels are graphically summarized in Figure 12. From the observation, the FR3-CV1-DOC1 combination is selected as a predicted optimum and the corresponding values are FR=0.191 mm/rev, CV=79 m/rev, DOC=0.4mm.
4.1 Validation of experiment
A confirmation turning experiment is performed to validate the optimum conditions predicted from the TC-GTMA (FR3-CV1-DOC1).
Eq. (1) has been used to determine the predicted TC-GTMA value and it is tabulated in Table 5. As identified, the predicted conditions reduce the TWR from 16.5 mg/min to 12 mg/min with no significant observations in Ra. The improvement of P (m) is recorded to be 12.87%.
$\mu$ predited $=\mu m+\sum_{i=1}^{n}(\mu o-\mu m)$ (8)
µ o = Mean of the P (m) at the optimal levels
n = Total number of machining factors
The alternative, based on the aforementioned facts, is the right approach for the present machinability problem. The suggested Hybrid-Multiple Attribute Decision-Making (H-MADM) technique, which combines Taguchi's approach and Graph Theory and a Matrix Approach, is a new methodology that can be used in any sort of decision-making situations and outperforms many attribute decision-making approaches. In comparison to other H-MADM approaches, the calculation employed is quite basic. Furthermore, utilising the graphical representation, the suggested technique not only allows for the analysis of the alternatives but also for the depiction of the many components present and their interrelationships. The variables' ratings and relative significance are combined to rank the alternatives, resulting in a more accurate assessment of the alternatives. The application of the perpetual concept assists in a better understanding of the variables and specifies the machinability problem under consideration since it comprises all conceivable structural components of the elements and their relative significance.
The present study examines the effect of cryo treatment on tungsten carbide insert and machinability characteristics of AISI 4340 steel under dry turning operation. The improved machining performance was noted at the TC-GTMA technique and it is suggested to be an appropriate method for solving the multi-response problem for enhancing the machinability characteristics of AISI 4340 steel within a given range of process variables under a dry turning operation. The microhardness of the DCT improved by 6.5 % and a significant reduction in TWR and Ra up to 33.3% and 25.1%, respectively. The optimal cutting conditions are evaluated from the TC-GTMA as FR3= 0.191 mm / rev, CV1= 79 m/min and DOC1= 0.4 mm. At this condition, the TWR reduces to 27.27% with no significant change in Ra.
|
ANN |
artificial neural network |
|
AWJM |
abrasive water jet machining |
|
BUE |
built up edge |
|
CV |
cutting velocity, mm/rev |
|
DCT |
deep cryogenically treated/treatment |
|
DOC |
depth of cut, mm |
|
FR |
feed rate, mm/rev |
|
GA |
genetic algorithm |
|
GRA |
grey relational analysis |
|
H-MADM |
hybrid-multi attribute decision making |
|
MQL |
minimum quantity lubrication |
|
MRR |
material removal rate (mm3/sec) |
|
OA |
orthogonal array |
|
P(m) |
permanent matrix |
|
Ra |
surface profile roughness (µm) |
|
RSM |
response surface methodology |
|
SCT |
shallow cryogenic treatment |
|
SEM |
scanning electron micrograph/microscope |
|
TC-GTMA |
taguchi coupled graph theory based matrix approach |
|
TWR |
tool wear rate |
|
UT |
Untreated |
|
WC-Co |
cobalt bonded tungsten carbide |
[1] Citti, P., Giorgetti, A., Millefanti, U. (2018). Current challenges in material choice for high-performance engine crankshaft. Procedia Structural Integrity, 8: 486-500. https://doi.org/10.1016/j.prostr.2017.12.048
[2] Krolczyk, G.M., Maruda, R.W., Krolczyk, J.B., Wojciechowski, S., Mia, M., Nieslony, P., Budzik, G. (2019). Ecological trends in machining as a key factor in sustainable production–a review. Journal of Cleaner Production, 218: 601-615. https://doi.org/10.1016/j.jclepro.2019.02.017
[3] Rakesh, M., Datta, S. (2019). Effects of cutting speed on chip characteristics and tool wear mechanisms during dry machining of Inconel 718 using uncoated WC tool. Arabian Journal for Science and Engineering, 44(9): 7423-7440. https://doi.org/10.1007/s13369-019-03785-y
[4] Shalaby, M.A., Veldhuis, S.C. (2019). Wear and tribological performance of different ceramic tools in dry high speed machining of Ni-Co-Cr precipitation hardenable aerospace superalloy. Tribology Transactions, 62(1): 62-77. https://doi.org/10.1080/10402004.2018.1486494
[5] Padhan, S., Das, A., Santoshwar, A., Dharmendrabhai, T. R., Das, S.R. (2020). Sustainability assessment and machinability investigation of austenitic stainless steel in finish turning with advanced ultra-hard SiAlON ceramic tool under different cutting environments. Silicon, 1-29. https://doi.org/10.1007/s12633-020-00409-1
[6] Panda, A., Das, S.R., Dhupal, D. (2019). Machinability investigation of HSLA steel in hard turning with coated ceramic tool: Assessment, modeling, optimization and economic aspects. Journal of Advanced Manufacturing Systems, 18(4): 625-655. https://doi.org/10.1142/S0219686719500331
[7] Balamurugan, K., Uthayakumar, M., Kumaran, S.T., Samy, G.S., Pillai, U.T.S. (2019). Drilling study on lightweight structural Mg/SiC composite for defence applications. Defence Technology, 15(4): 557-564. https://doi.org/10.1016/j.dt.2019.01.002
[8] Arunkarthikeyan, K., Balamurugan, K. (2020). Performance improvement of Cryo treated WC-Co insert turning of AISI 1018 steel using Multi objective optimization. Computational Intelligence for Smart Power System and Sustainable Energy (CISPSSE), 33: 1-4. https://doi.org/10.1109/CISPSSE49931.2020.9212247
[9] Das, A., Patel, S.K., Biswal, B.B., Das, S.R. (2019). Machinability investigation and cost estimation during finish dry hard turning of AISI 4340 steel with untreated and Cryo treated cermet inserts. Journal of Superhard Materials, 41(4): 247-264. https://doi.org/10.3103/S1063457619040051
[10] Raja, P., Malayalamurthi, R. (2017). Effects of deep cryo treatment of high speed steel on the turning process of a medium carbon steel. Materials Testing, 59(9): 763-768. https://doi.org/10.3139/120.111069
[11] Korade, D., Ramana, K.V., Jagtap, K. (2019). Influence of cryogenic treatment on the tribological behaviour of AISI H21 tool steel. Materials Research, 22(1). https://doi.org/10.1590/1980-5373-mr-2017-0745
[12] Mukkoti, V.V., Sankaraiah, G., Yohan, M. (2018). Effect of cryogenic treatment of tungsten carbide tools on cutting force and power consumption in CNC milling process. Production Manufacturing Research, 6(1): 149-170. https://doi.org/10.1080/21693277.2018.1436011
[13] Sartori, S., Moro, L., Ghiotti, A., Bruschi, S. (2017). On the tool wear mechanisms in dry and cryogenic turning Additive Manufactured titanium alloys. Tribology International, 105: 264-273. https://doi.org/10.1016/j.triboint.2016.09.034
[14] Gong, F., Zhao, J., Pang, J. (2017). Evolution of cutting forces and tool failure mechanisms in intermittent turning of hardened steel with ceramic tool. The International Journal of Advanced Manufacturing Technology, 89(5-8): 1603-1613. https://doi.org/10.1007/s00170-016-9178-z
[15] Deshpande, Y.V., Andhare, A.B., Padole, P.M. (2018). How cryogenic techniques help in machining of nickel alloys? A review. Machining Science and Technology, 22(4): 543-584. https://doi.org/10.1080/10910344.2017.1382512
[16] Akincioglu, S., Gokkaya, H., Uygur, I. (2015). A review of cryogenic treatment on cutting tools. The International Journal of Advanced Manufacturing Technology, 78(9-12): 1609-1627. https://doi.org/10.1007/s00170-014-6755-x
[17] Li, B., Zhang, S., Zhang, T., Zhang, J. (2019). Effect of deep cryogenic treatment on microstructure, mechanical properties and machining performances of coated carbide tool. Journal of the Brazilian Society of Mechanical Sciences and Engineering, 41(1): 27. https://doi.org/10.1007/s40430-018-1533-6
[18] Khan, A., Maity, K. (2017). Comparative study of some machinability aspects in turning of pure titanium with untreated and cryogenically treated carbide inserts. Journal of Manufacturing Processes, 28: 272-284. https://doi.org/10.1016/j.jmapro.2017.05.018
[19] Seah, K.H.W., Rahman, M., Yong, K.H. (2003). Performance evaluation of cryogenically treated tungsten carbide cutting tool inserts. Proceedings of the Institution of Mechanical Engineers, Part B: Journal of Engineering Manufacture, 217(1): 29-43. https://doi.org/10.1243/095440503762502260
[20] Thakur, D., Ramamoorthy, B., Vijayaraghavan, L. (2008). Influence of different post treatments on tungsten carbide–cobalt inserts. Materials Letters, 62(28): 4403-4406. https://doi.org/10.1016/j.matlet.2008.07.043
[21] Kara, F., Karabatak, M., Ayyıldız, M., Nas, E. (2020). Effect of machinability, microstructure and hardness of deep cryogenic treatment in hard turning of AISI D2 steel with ceramic cutting. Journal of Materials Research and Technology, 9(1): 969-983. https://doi.org/10.1016/j.jmrt.2019.11.037
[22] Saini, A., Pabla, B.S., Dhami, S.S. (2020). Improvement in performance of cryogenically treated tungsten carbide tools in face milling of Ti-6Al-4V alloy. Materials and Manufacturing Processes, 35(5): 598-607. https://doi.org/10.1080/10426914.2019.1615079
[23] Sivalingam, V., Sun, J., Selvam, B., Murugasen, P.K., Yang, B., Waqar, S. (2019). Experimental investigation of tool wear in cryogenically treated insert during end milling of hard Ti alloy. Journal of the Brazilian Society of Mechanical Sciences and Engineering, 41(2): 110. https://doi.org/10.1007/s40430-019-1612-3
[24] Hussain, Z. (2020). Multi performance optimization in machining of EN31-535A99SS with interchangeable straight cemented tungsten carbide-cobalt mixed (WC–Co) insert grade (CSTC—K20) using Taguchi coupled grey relational analysis. SN Applied Sciences, 2(2): 197. https://doi.org/10.1007/s42452-020-2011-1
[25] Balamurugan, K., Uthayakumar, M., Sankar, S., Hareesh, U.S., Warrier, K.G.K. (2018). Preparation, characterisation and machining of LaPO4-Y2O3 composite by abrasive water jet machine. International Journal of Computer Aided Engineering and Technology, 10(6): 684-697. https://doi.org/10.1504/IJCAET.2018.095203
[26] Arunkarthikeyan, K., Balamurugan, K., Nithya, M., Jayanthiladevi, A. (2019). Study on deep cryogenic treated-tempered WC-CO insert in turning of AISI 1040 steel. In 2019 International Conference on Computational Intelligence and Knowledge Economy (ICCIKE), pp. 660-663. https://doi.org/10.1109/ICCIKE47802.2019.9004422
[27] Rao, K.V., Murthy, P.B.G.S.N., Vidhu, K.P. (2017). Assignment of weightage to machining characteristics to improve overall performance of machining using GTMA and utility concept. CIRP Journal of Manufacturing Science and Technology, 18: 152-158. https://doi.org/10.1016/j.cirpj.2016.12.001
[28] Latchoumi, T.P., Balamurugan, K., Dinesh, K., Ezhilarasi, T.P. (2019). Particle swarm optimization approach for waterjet cavitation peening. Measurement, 141: 184-189. https://doi.org/10.1016/j.measurement.2019.04.040
[29] Rao, R.V., Patel, B.K. (2011). Novel method for decision making in the manufacturing environment. Proceedings of the Institution of Mechanical Engineers, Part B: Journal of Engineering Manufacture, 225(3): 422-434. https://doi.org/10.1177/2041297510394074
[30] Ahilan, C., Kumanan, S., Sivakumaran, N., Dhas, J.E.R. (2013). Modeling and prediction of machining quality in CNC turning process using intelligent hybrid decision making tools. Applied Soft Computing, 13(3): 1543-1551. https://doi.org/10.1016/j.asoc.2012.03.071
[31] Rao, R.V. (2007). Decision making in the manufacturing environment: using graph theory and fuzzy multiple attribute decision making methods. Springer Science & Business Media.
[32] Arulkirubakaran, D., Balasubramanian, K., Raju, R., Palanisamy, D., Manikandan, N. (2019). Machinability studies on precipitation hardened stainless steel using Cryo-Treated Textured Carbide Inserts. http://nopr.niscair.res.in/handle/123456789/46939.
[33] Ozbek, N.A., Çiçek, A., Gulesln, M., Ozbek, O. (2016). Application of deep cryogenic treatment to uncoated tungsten carbide inserts in the turning of AISI 304 stainless steel. Metallurgical and Materials Transactions A, 47(12): 6270-6280. https://doi.org/10.1007/s11661-016-3767-1
[34] Arunkarthikeyan, K., Balamurugan, K., Rao, P.M.V. (2020). Studies on cryogenically treated WC-Co insert at different soaking conditions. Materials and Manufacturing Processes, 35(5): 545-555. https://doi.org/10.1080/10426914.2020.172694
[35] Arunkarthikeyan, K., Balamurugan, K. (2021). Experimental studies on deep cryo treated plus tempered tungsten carbide inserts in turning operation. In Advances in Industrial Automation and Smart Manufacturing, Springer, Singapore: 313-323. https://doi.org/10.1007/978-981-15-4739-3_26
[36] Arunkarthikeyan, K., Balamurugan, K. (2020). Studies on the effects of deep cryogenic treated WC–Co insert on turning of Al6063 using multi-objective optimization. SN Applied Sciences, 2(12): 1-14. https://doi.org/10.1007/s42452-020-03940-3
[37] Arunkarthikeyan, K., Balamurugan, K. (2021). Studies on the impact of soaking time on a cryogenic processed and post tempered WC-Co insert. Materials Today: Proceedings, 44(Part 1): 1692-1699. https://doi.org/10.1016/j.matpr.2020.11.869