Ilaf N. Rasool![]() | Ranj S. Abdullah*
| Ranj S. Abdullah*![]()
© 2023 IIETA. This article is published by IIETA and is licensed under the CC BY 4.0 license (http://creativecommons.org/licenses/by/4.0/).
OPEN ACCESS
Due to high solar irradiation and the high ambient temperature in Iraq, the solar cell temperature rises, and the electrical power output drops accordingly. In this study, an experimental photovoltaic (PV) panel prototype was developed to study the PV module's performance and power production efficiency. The developed photovoltaic module uses a water-cooling chamber for cooling. This experimental study uses a water-cooling system chamber technique at the rear side of the PV panel. The cooling system solar panel is a closed cycle, and the cooling water contacts the panel directly through the rear side of the PV panel using different flow rates. The results showed that the electrical efficiency increased by 10.42%, 11.87%, 13.77%, 18.1%, and 19.72% when mass flow rates of 1.5, 2, 2.5, 3, and 3.5 l/min, respectively, were used. The thermal efficiency at 1.5 and 3.5 l/min is 49.7% and 79.2%, respectively.
photovoltaic panel, water cooling system, electrical efficiency, thermal efficiency
The sources of energy can be divided into non-renewable and renewable sources. Non-renewable sources of energy have limited resources and pollute the environment, causing increasing people's health issues [1, 2]. A renewable source has a natural resource that has no negative effect on the environment and is environmentally friendly. Solar photovoltaic systems use solar radiation to generate electricity. About 19-21% of solar radiation has been transformed directly into electricity [3], and the remaining solar energy is either reflected or absorbed as heat. As a result, it raises the operational temperature of the photovoltaic cell and lowers its electrical efficiency [4, 5].
To achieve optimal and improved solar cell performance, cooling techniques are required to keep the temperature of the solar cell low. Depending on the type of photovoltaic, every 1℃ increase in surface temperature results in a 0.3% to 0.50% decrease in efficiency [6]. The previous studies in this field showed that a monocrystalline panel was more efficient than a polycrystalline one [7, 8]. Previous research has looked into the cooling of a photovoltaic panel.
Water and air have been used as working fluids in the majority of ways to cool solar panels. Air cooling consumes less energy than water, while water's cooling capacity is higher than air's. Water has a high heat capacity. It takes heat from the top of the solar panel's surface in an effective way, and the amount of heat extracted increases as the water flow rate increases [9-12]. In contrast, the air-cooling system for PV panels uses both natural and forced convection [13-15].
Many other techniques were used to improve the performance of photovoltaic panels, such as back and front face cooling. The back cooling system can reduce the temperature of the photovoltaic panel cell by 8.4% and increase power by 4.9% [16]. Other studies used both sides' cooling processes [17, 18]. Water and nanofluid were used to develop the cooling technique for the backside of the photovoltaic panel [19-21]. Through water cooling technology, different design ideas were tested to improve the efficiency of the solar panel. These techniques optimize the performance and efficiency of the cooled PV panels using different materials, designs, and layouts. Depending on the method and design, the percentage increase in power ranges from 9% to 11% [6, 22, 23]. In an experimental and theoretical study [24], two different modules were used: in the first, the water channel includes 15 galvanized steel baffles attached to the rear side of the photovoltaic panel, in the second, rectangular aluminum fins. As a result, the power output of non-cooling, water cooling, and fin cooling was 207, 220 and 218 W, respectively. In another technique [25] for increasing overall electrical efficiency in photovoltaic systems, the cooling chamber is created by attaching water passageways in contact with the solar PV module's back surface. Water was used in two different directions (up-flow and down-flow) at four main flows of 1-4 l/min. Three different designs for the backside of the PV cell were used. The result of the experiment was that electrical efficiency increased by 17% for the first case, 15.3% for the second case, and 13.6% for the third case with the use of 4 l/min compared to the non-cooling system. Also, the temperature reduction of the first case for up-flow and down-flow was 32.9% and 32%, respectively.
A new cooling approach using a backside water chamber was investigated experimentally and numerically as reported by Reda et al. [26], Al-Kayiem and Reda [27], and Reda et al. [28]. They circulated the cooling water through a ground heat exchanger. The approach solved two problems in PV technology; first, they managed to reduce the PV surface temperature during the hot daytime and warm the PV module at night to eliminate the condensed formation.
The high ambient temperature during the summer season in Iraq is considered a crucial factor that affects the performance of photovoltaic panels. When the photovoltaic temperature rises significantly above 55℃, the solar panel's power generation is permanently damaged. This challenge prompts us to develop and enhance the cooling process of the PV panel. According to the literature reviewed, water-cooling techniques are more efficient for cooling solar panels. The water cooling chamber allows water to come into direct contact with the panel by passing through the rear of the PV panel. This cools most of the back of the photovoltaic panel to achieve improved electrical efficiency. This technique also ensures that the water passageways are in contact with the solar PV module's back surface. The cooling chamber techniques have been demonstrated experimentally to increase the overall efficiency of the PV panel using a new design and concept of distributing water from the backside.
2.1 Photovoltaic solar module
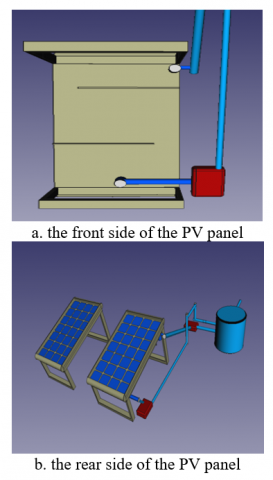
The research has been performed in the north of Iraq, particularly in Erbil city. Erbil City is located at latitude 36.191 and longitude 44.009. The yearly tilt angle in Erbil City is 36°. This research uses two monocrystalline PV panels to produce electric energy. The first PV panel is developed and modified to be cooled by the water chamber cooling at the panel's back surface. In contrast, the second panel is used as a reference without any design modification. Figure 1 illustrates the developed prototype's schematic plan and the components comprising two photovoltaic solar models (with and without a cooling chamber), a water tank, a motor for the water-cooling system, and water tubes for the inlet and outlet. Table 1 shows the technical specifications of the PV panels used in the experiment.
Figure 1. A schematic diagram of the cooled PV panel
Table 1. Mechanical data at standard test conditions @ (1000 W/m2, 25℃, 1.5 m/s)
|
Nominal power |
170 W |
|
Cell type |
Monocrystalline |
|
Module dimension |
1230×670×30 mm |
|
Maximum power current |
7.54 A |
|
Maximum power voltage |
22.55 V |
|
Open circuit voltage ($V_{o c}$) |
26.65 V |
|
Short circuit current ($I_{S C}$) |
8.05 A |
|
Working temperature |
-40℃ ⁓ +80℃ |
2.2 Water-cooling chamber design concept
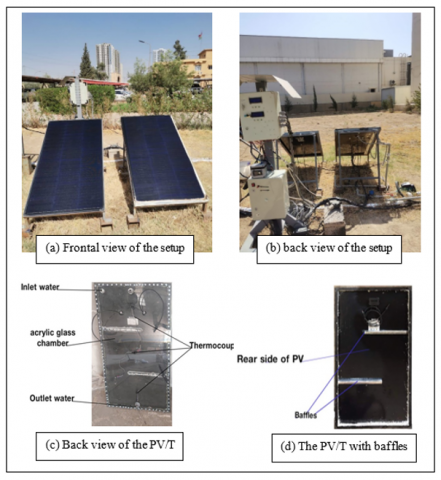
The cooling chamber of the PV panel is made of acrylic glass 8 mm thick. Compared to window glass of equal thickness, acrylic glass is nearly 50% lighter and has higher transparency. The glass chambers were fixed to the rear side of the photovoltaic panel. The acrylic glass was fixed and attached to a PV frame by silicon. The water chamber has an inlet from the top and an outlet from the bottom of the back-installed water tank, as shown in the schematic diagram of Figure 1. Also, the developed chamber has been designed to have two paths of water flow through the baffles to increase the surface heat transfer between water and Tedlar. The length of each baffle is 48 cm, as shown in Figure 2d. Figure 2 shows the water-cooling system pipe connection to the solar panel, which is mounted on an iron stand with a tilted angle of 36⁰. The cooling water is circulated through a water pump to pump water from the water storage tank to the water chamber to cool down the panel. Then, another pump is used to return the water from the chamber to the tank. The water pump capacity is 0.55 hp. The inlet and outlet water temperatures and the PV panel temperature are measured using a data acquisition system using type-K thermocouples. The three thermocouples were installed on the rear of the photovoltaic panels to measure their respective temperatures.
Figure 2. Various views of the experimental setup
2.3 Measurements and instruments
The experimental results were recorded by a data logger (Arduino), including the panel temperature, water inlet and outlet temperature, ambient temperature, power, voltage and water flow rate. K-type thermocouples were used to measure the temperatures. The water flow rate was measured using a YF-s201 sensor. The ambient temperature was measured by a Digital Humidity Temperature (DHT) sensor. A DBTU1300 solarimeter was used to measure solar irradiation. The produced current and voltage were measured by an ACS712 current sensor and Sen32 voltmeter.
Based on the experimental data, the electrical and thermal efficiency are calculated using the relevant theory.
3.1 Electrical efficiency
The solar panel's performance can be expected to be based on electrical efficiency. The electrical efficiency is determined by the proportion of maximum power output to the solar radiation incident on the photovoltaic panel region:
electrical efficiency $=\frac{P_{m p}}{G \times A}$ (1)
where, $P_{m p}$ is the maximum power output (W), G is solar radiation in W/m2 and A is the area of PV panel in m2.
The maximum electrical power of a PV system could be expressed as
$P_{m p}=V_{m p} \times I_{m p}=F F \times V_{o c} \times I_{s c}$ (2)
where, the fill factor FF is a measure of the performance of a solar cell.
3.2 Thermal efficiency
The generated heat by the PV panel can be absorbed by the water flow inside the cooling chamber. The thermal efficiency is defined as the heat gain of the water to the solar radiation incident on the photovoltaic module region as shown in the equation below
Thermal efficiency $=\frac{Q}{G \times A}$ (3)
with the heat gain given by
$Q=m \times c_p \times\left(T_{\text {out }}-T_{\text {in }}\right)$ (4)
where, m is the mass flow rate of water (kg/s), cp is the specific heat of water (4182 j/kg. K), Tin inlet water temperature in ℃, and Tout outlet water temperature in ℃.
An experimental programme was performed during the summer of 2022 in Erbil city to investigate the effect of using a water-cooling chamber design on the electrical and thermal efficiency of the PV panel using different flow rates. The prototype was installed at the Research Centre at Erbil Polytechnic University, Erbil-Iraq.
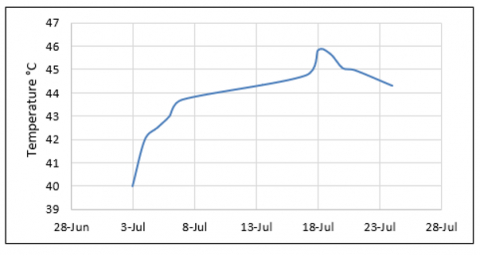
4.1 Ambient temperature and solar irradiation
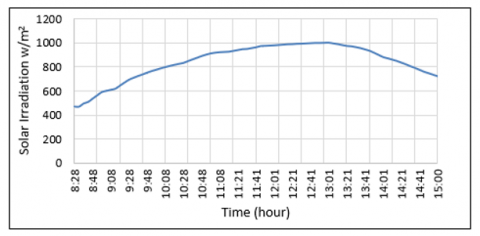
The outdoor temperature was recorded during the July month, as illustrated in Figure 3. As this figure shows, the outdoor temperature for the month peaked at 46℃ on July 18th. Therefore, the data on solar irradiation for this day is chosen. While in Figure 4, the recorded solar irradiation during the same day (July 18th) is shown. During that day, measurements of solar irradiation started at 8:00 a.m. with a value 470 W. They went up slowly until they reached 1002 W at 13:00. As a result, when there was high solar irradiation intensity, the high temperature of the panel was recorded as shown in Figure 5.
Figure 3. Average daily ambient temperature (summer season)
Figure 4. Total solar irradiation during the day of maximum average ambient temperature (July 18th)
4.2 Thermal analysis
In Figure 5, the ambient air temperature and the panel temperature variation during the day of maximum average ambient temperature are shown. The PV panel temperature was recorded with and without a cooling system. On the day of the experiment, the PV panel with a cooling system had the lowest temperature of 37℃ in the early morning and the highest temperature of 49.2℃ at 15 o'clock. The highest PV panel temperature without any additional cooling was found to be around 66.10℃ when the ambient temperature was 48.9℃. High operating cell temperatures are produced by high-intensity solar irradiance. This heat energy generation from solar energy increases the temperature of the PV cells. However, when the water-cooling system was used in the photovoltaic panels, the temperature was lowered to 41.16℃ under the same conditions. The average backside cell temperature without and with water cooling was 61℃ and 39.98℃, respectively. The percentage of reduction in the PV panel temperature was 34.46%.
Figure 5. Variation of surface temperature of the PV panel and ambient temperature during July 18th
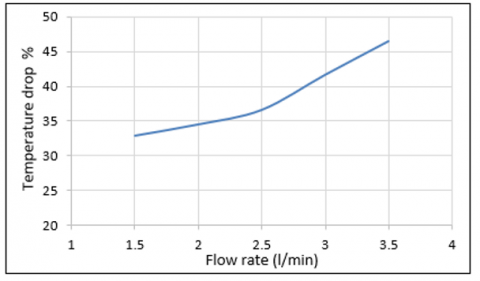
Figure 6 illustrates how the temperature of a photovoltaic panel changes when different mass flow rates are appled. Using a 3.5 l/min, water cooling system significantly reduced the average temperature of the PV panel's back side. The temperature drop percentage of the PV panel was 32.83%, 34.46%, 36.55%, and 41.62%, for flow rates of 1.5, 2, 2.5, and 3 l/min, respectively. Based on these results, it may be concluded that, as the water-cooling system's mass flow rate increases, the PV panels' temperature decreases.
Figure 6. The temperature of the collector's backside at different water mass flow rates
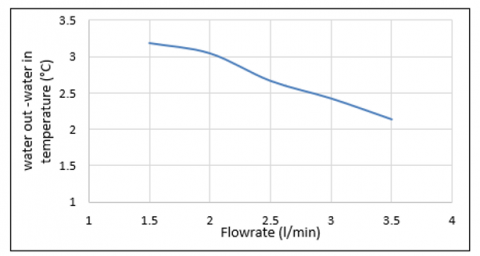
Figure 7. Difference between water out and water in temperature for varying flow rates
Figure 7 shows the difference in the cooling water temperature between the inlet and the outlet. It can be observed that with an increase in the water flow rate, the temperature difference decreases. The maximum and minimum values recorded at the experimental when using 1.5 and 3.5 l/min were 3.19℃ and 2.13℃, respectively.
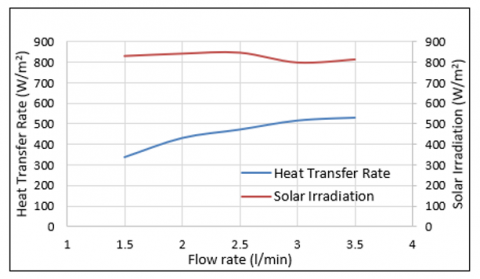
Figure 8 shows the effect of different water mass flow rates on the heat transfer rate between the water and the panel. The heat transfer rate increased with the mass flow rate since the velocity state and the turbulence fluctuated. The minimum heat transfer rate was recorded as 340.18 W/m2 at 1 l/min, while the highest rate was 530 W/m2 at 3.5 l/min.
Figure 8. Heat transfer rate of the cooling system and total solar irradiation
4.3 Performance analysis
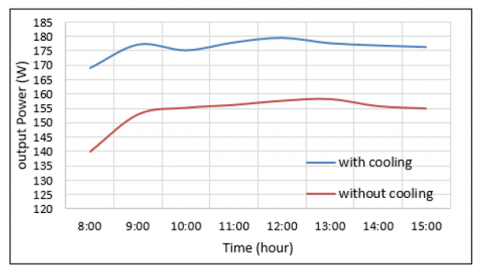
The PV panel efficiency and power production are presented in the figures of this section. The electric power output is shown in Figure 9 during July 18th, when the mass flow rate was controlled at 2 l/min. The power output started in the morning with a value of 140 W without cooling and 169 W with the cooling system. At noon, the non-cooled PV panel's maximum output power was recorded at 158.26 W. The highest power produced by the water chamber cooling system is 179.38, while the highest power enhancement percentage is 11.77%.
Figure 9. Electrical power generated by PV panel (July 18th)
Moreover, the enhancement in the power output is demonstrated in Figure 10 at different water flow rates. The results show that the cooling system's output power increased as the water mass flow rate increased. The power increases by 10.42%, 11.87%, 13.77%, 18.09%, and 19.72% when applying flow rates of 1.5, 2, 2.5, 3, and 3.5 l/min, respectively.
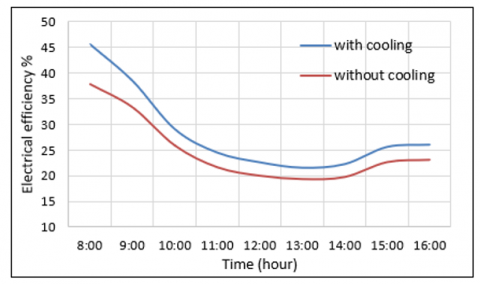
The electrical efficiency was calculated based on the data of July 18th, as shown in Figure 11. With the increase of solar irradiation, the PV panel surface temperature is raised. The results show that the average electrical efficiency with and without the cooling system was 26.6% and 23.4%, respectively. From the results, the overall enhancement in the electrical efficiency is 12.03% when using the proposed cooling system and compared to the non-cooled PV panel’s electrical efficiency.
Figure 10. Rate of power at a different water flow rate
Figure 11. PV panel electrical efficiency during July 18th
The enhanced electrical efficiency at different mass water flow rates is illustrated in Figure 12. Based on these results, it may be concluded that using a PV panel with a water chamber cooling system makes electricity production much more efficient, while the electrical efficiency varied with the rate of water flow.
Figure 12. Electrical efficiency at different water flow rates
4.4 A comparative study of the results
A previous study [29] found that a water-cooling heat exchanger installed on the back of the cell lowered the cell’s temperature by 20%, and electrical efficiency increased by 9%. Also, according to Fakouriyan et al. [30], their experimental study’s design container was direct water cooling at the rear side of the PV panels and the rise in electrical efficiency achieved was 12.3%.
Another study by Muslim et al. [25] considered the water-cooling chamber connected to the rear side of the photovoltaic panel applying flow of 4 l/min at three different angles: 60°, 30°, and 0°. The increase in electrical efficiency was 17%, 13.6%, and 15.3%, respectively. In an additional study by Mohammed et al. [6], the PV panel was placed on the back side of the water-cooling chamber, and the electrical efficiency with and without cooling was 10% and 9.17%, respectively. The PV/T system performance achieved in this experimental study can be compared to the earlier studies by referring to Figure 13.
Figure 13. The comparison between the current investigation and the earlier suggested designs for water cooling
The conclusions from this study, when compared to the earlier studies mentioned above, are that the proposed strategy in this research improves a PV’s performance. In this study, the module’s efficiency improved in a way similar to that observed in other studies with the consideration of using a new backside water chamber design.
4.5 Evaluation of the error range
In the experimental analysis performed here, a guaranteed error variance based on the technical sheet data of the equipment was specified. To measure the current, the ACS712 Current Sensor was used. The accuracy measurement is 0.1% A. The MAX6675ISA K type thermocouple was used for measuring the temperature. The measurement accuracy for temperature was 1.5℃. A DBTU1300 solar power meter was used to measure solar radiation. The error in the measurement was ±0.38 W/m2. To measure voltage, the Sen32 rev1.1 sensor module was used; its measurement accuracy was ± 0.2 V. The water flow rate module was the YF-S201; its measurement error was ± 5%. Based on the previous discussion of the expected error range, it can be seen that the effect of a guaranteed error range is neglected.
High-intensity solar irradiance and the temperature of a PV module have a strong effect on the PV panel performance. This study investigated a cooling system using monocrystalline panels that affects the performance of solar panels under outdoor conditions. The cooling water system uses a chamber at the rear side of the solar panel. When the solar panel’s temperature is high, water can remove excess heat from the PV cell. The experimental test and data were recorded in July 2022. The operating temperatures with and without cooling were 39.98℃ and 61℃, respectively. Five different water mass flow rates were applied. As a consequence, the temperature reduction was 32%, 34%, 36%, 42%, and 47% when using flow rates of 1.5, 2, 2.5, 3, and 3.5 l/min, respectively. Operating cell temperature changes have the largest effect on electrical efficiency. The results led to the conclusion that increasing mass flow increases both electrical and thermal efficiency. Additionally, the PV panel’s life span will increase, leading to higher system feasibility.
The authors would like to express their appreciation to the staff of the research center laboratory at Erbil Polytechnic University, Erbil, Iraq.
[1] Patel, M.R., Beik, O. (2021). Wind and Solar Power Systems: Design, Analysis, and Operation. CRC Press.
[2] Ahmed, W.K., Salam, A.Q., Mahdiy, M.T., Chaichan, M.T. (2020). Environmental impact of using generators in the university of technology in Baghdad, Iraq. Journal of Thermal Engineering, 6(6): 272-281. https://doi.org/10.18186/thermal.822496
[3] Sainthiya, H., Beniwal, N.S. (2020). Comparative analysis of electrical performance parameters under combined water cooling technique of photovoltaic module: An experimental investigation. Energy Sources, Part A: Recovery, Utilization, and Environmental Effects, 42(15): 1902-1913. https://doi.org/10.1080/15567036.2019.1604894
[4] Bahaidarah, H.M., Baloch, A.A., Gandhidasan, P. (2016). Uniform cooling of photovoltaic panels: A review. Renewable and Sustainable Energy Reviews, 57: 1520-1544. https://doi.org/10.1016/j.rser.2015.12.064
[5] Leary, P. (2019). Design & Evaluation of Cooling Systems for Photovoltaic Modules. Union College, Schenectady, NY.
[6] Mohammed, F.M., Mohammed, J.A.K., Sanad, M.A.S. (2019). Performance enhancement of photovoltaic panel using double-sides water glazing chambers cooling technique. Al-Nahrain Journal for Engineering Sciences, 22(1): 22-30. http://doi.org/10.29194/NJES.22010022
[7] Mirzaei, M., Mohiabadi, M.Z. (2017). A comparative analysis of long-term field test of monocrystalline and polycrystalline PV power generation in semi-arid climate conditions. Energy for Sustainable Development, 38: 93-101. https://doi.org/10.1016/j.esd.2017.01.002
[8] Bashir, M.A., Ali, H.M., Amber, K.P., Bashir, M.W., Ali, H., Imran, S., Kamran, M.S. (2018). Performance investigation of photovoltaic modules by back surface water cooling. Thermal Science, 22(6 Part A): 2401-2411. https://doi.org/10.2298/TSCI160215290B
[9] Ali, R., Çelik, S. (2017). Effect of cooling on solar panel performance. Int. Proceedings of Chemical, Biological and Environmental Engineering, 10: 118-123.
[10] Hadipour, A., Zargarabadi, M.R., Rashidi, S. (2021). An efficient pulsed-spray water cooling system for photovoltaic panels: Experimental study and cost analysis. Renewable Energy, 164: 867-875. https://doi.org/10.1016/j.renene.2020.09.021
[11] Govardhanan, M.S., Kumaraguruparan, G., Kameswari, M., Saravanan, R., Vivar, M., Srithar, K. (2020). Photovoltaic module with uniform water flow on top surface. International Journal of Photoenergy, 2020: 1-9. https://doi.org/10.1155/2020/8473253
[12] Mohammed, F.M., Mohammed, J.A.K., Nouri, R.A. (2018). Efficiency enhancement of a dual-axis solar PV panel tracker using water-flow double glazing technique. Al-Khwarizmi Engineering Journal, 14(3): 32-47. https://doi.org/10.22153/kej.2018.12.008
[13] Misha, S., Abdullah, A.L., Tamaldin, N., Rosli, M.A.M., Sachit, F.A. (2020). Simulation CFD and experimental investigation of PVT water system under natural Malaysian weather conditions. Energy Reports, 6: 28-44. https://doi.org/10.1016/j.egyr.2019.11.162
[14] Sultan, T.N., Farhan, M.S., ALRikabi, H.T.S. (2021). Using Cooling System for Increasing the Efficiency of Solar Cell. In Journal of Physics: Conference Series, 1973(1): 012129. https://doi.org/10.1088/1742-6596/1973/1/012129
[15] Amelia, A.R., Irwan, Y.M., Irwanto, M., Leow, W.Z., Gomesh, N., Safwati, I., Anuar, M.A.M. (2016). Cooling on photovoltaic panel using forced air convection induced by DC fan. International Journal of Electrical and Computer Engineering, 6(2): 526-534. https://doi.org/10.11591/ijece.v6i2.9118
[16] Hasan, D.J., Farhan, A.A. (2019). Enhancing the efficiency of Photovoltaic panel using open-cell copper metal foam fins. International Journal of Renewable Energy Research, 9(4): 1849-1855.
[17] Agyekum, E.B., PraveenKumar, S., Alwan, N.T., Velkin, V.I., Shcheklein, S.E. (2021). Effect of dual surface cooling of solar photovoltaic panel on the efficiency of the module: Experimental investigation. Heliyon, 7(9): e07920. https://doi.org/10.1016/j.heliyon.2021.e07920
[18] Hachicha, A.A., Ghenai, C., Hamid, A.K. (2015). Enhancing the performance of a photovoltaic module using different cooling methods. International Journal of Energy and Power Engineering, 9(9): 1106-1109.
[19] Hussein, H.A., Numan, A.H., Abdulrahman, R.A. (2017). Improving the hybrid photovoltaic/thermal system performance using water-cooling technique and Zn-H2O nanofluid. International Journal of Photoenergy, 2017: 6919054. https://doi.org/10.1155/2017/6919054
[20] Sharma, M., Bansal, K., Buddhi, D. (2015). Real time data acquisition system for performance analysis of modified PV module and derivation of cooling coefficients of electrical parameters. Procedia Computer Science, 48: 582-588. https://doi.org/10.1016/j.procs.2015.04.139
[21] Nasrin, R., Hasanuzzaman, M., Rahim, N.A. (2019). Effect of nanofluids on heat transfer and cooling system of the photovoltaic/thermal performance. International Journal of Numerical Methods for Heat & Fluid Flow, 29(6): 1920-1946. https://doi.org/10.1108/HFF-04-2018-0174
[22] Kumar, P., Dubey, R. (2018). Efficiency improvement of photovoltaic panels by design improvement of cooling system using back water cooling tubes. International Journal of Engineering Research & Technology (IJERT), 7(1): 74-77.
[23] Abass, K.I., Al-Waeli, A., Al-Asadi, A.N. (2019). The use of water cooling photovoltaic thermal (PV/T) system in domestic heating water. International Journal of Trend in Research and Development, 6(6): 1-4.
[24] Gomaa, M.R., Hammad, W., Al-Dhaifallah, M., Rezk, H. (2020). Performance enhancement of grid-tied PV system through proposed design cooling techniques: An experimental study and comparative analysis. Solar Energy, 211: 1110-1127. https://doi.org/10.1016/j.solener.2020.10.062
[25] Muslim, N.H., Ghadhban, S.A., Hilal, K. (2020). Enhancement of solar photovoltaic module performance by using a water-cooling chamber for climatic conditions of Iraq. International Journal of Renewable Energy Research (IJRER), 10(3): 1103-1110.
[26] Reda, M.N., Spinnler, M., Al-Kayiem, H.H., Sattelmayer, T. (2021). Assessment of condensation and thermal control in a photovoltaic panel by PV/T and ground heat exchanger. Solar Energy, 221: 502-511. https://doi.org/10.1016/j.solener.2021.05.004
[27] Al-Kayiem, H.H., Reda, M.N. (2021). Analysis of solar photovoltaic panel integrated with ground heat exchanger for thermal management. International Journal of Energy Production and Management, 6(1): 17-31. https://doi.org/10.2495/EQ-V6-N1-17-31
[28] Reda, M.N., Spinnler, M., Al-Kayiem, H.H., Sattelmayer, T. (2020). Analysis of ground thermal control systems for solar photovoltaic performance enhancement. WIT Transactions on Ecology and the Environment, 246: 41-50. https://doi.org/10.2495/EPM200051
[29] Bahaidarah, H., Subhan, A., Gandhidasan, P., Rehman, S. (2013). Performance evaluation of a PV (photovoltaic) module by back surface water cooling for hot climatic conditions. Energy, 59: 445-453. https://doi.org/10.1016/j.energy.2013.07.050
[30] Fakouriyan, S., Saboohi, Y., Fathi, A. (2019). Experimental analysis of a cooling system effect on photovoltaic panels' efficiency and its preheating water production. Renewable Energy, 134: 1362-1368. https://doi.org/10.1016/j.renene.2018.09.054