Sundus S. Al-Azawiey*![]() | Mohamed M. Mohamed
| Mohamed M. Mohamed![]() | Aqilah B. Arifin
| Aqilah B. Arifin
© 2023 IIETA. This article is published by IIETA and is licensed under the CC BY 4.0 license (http://creativecommons.org/licenses/by/4.0/).
OPEN ACCESS
An existing PV system is cooled by heat dissipation to air by straight fins arrays attached at the backside of the panels. However, a little average temperature drop has been achieved in the plant. The current research aims to simulate and investigate the low cooling performance experienced in the plant and recommend improved PV cooling by backside installed fins. A CAD model was constructed with CATIA software and imported to ANSYS-Fluent to simulate and investigate the cause of low cooling performance. In addition, cooling performance by 45°, 90° and 135° have been studied. The solar PV panel has 1000-mm-width and 2000-mm-length, whereas the fins' base dimensions are 830-mm-width, and 1260-mm-length and each fin has 80-mm-height. The reference case study's average temperature measured in the actual site is 46.9℃, while the simulation prediction is 48.4℃. The 3.3% difference suggests that the simulation procedure is sufficient to investigate the other cases. Solar PV is paired with the fins air cooling system, stimulating the PV/T with only a 2.7% difference between the actual measurements and the simulation prediction. The bare panel simulation results predicted the backside temperature to be 13.4℃ above the ambient temperature. The 45° and 90° oriented fins reduced the backside temperature to 4.2℃ and 9.54℃ above the ambient temperature. In contrast, the 135° oriented fins have a negative cooling effect, as they increased the backside temperature to 19.05℃ above the ambient temperature. The analysis suggests that the low-performing cooling in the physical system is due to the bad thermal contact between the array base plate and the panel's backside.
PV/T, renewable energy, PV/T cooling, passive cooling, PV/T efficiency
Photovoltaics (PV) is undoubtedly the most widespread approach to harnessing solar power and converting it directly to electrical current. Solar PV technology has advanced at an astounding rate and carries an important role in solar energy conversion. Globally, the PV market has shown immense growth since a decade ago at a rate greater than 34% for the average annual compound [1]. The industry focuses on enhancing the efficiency of the PV panel as it is the key parameter to establishing the product in the market. Its efficiency depends on the type of PV cell. The generated electrical current can be instantly used, stored or connected to a grid. PV panels typically have an efficiency of around 15% to 20%. The standard test conditions (STC) are typically applied to record the efficiency of each cell. The PV's efficiency continuously increases by +2% per year [2].
Like each energy conversion technology, the PV technique has its operational problems. As Alim et al. [3] highlighted, shading is one of the operational problems of PV. Nevertheless, Al-Kayiem and Reda [4] pointed out that the main factors that directly affect the efficiency of the PV are surface temperature and condensate formation, which leads to mud formation on the surface and prevents the cells from receiving solar radiation. Arifin et al. [5] found that every 1℃ temperature rise in solar PV panels will correspond to a drop in efficiency of around 0.5%, indicating that the panel's temperature significantly affects the energy conversion. Around 80% of the energy is transformed into heat during energy conversion [4, 6]. Continuous energy conversion to heat increases the temperature of the PV panel. With the improvement of the current solar technologies, the efficiency reduction is decreased to 0.4% for each 1℃ of temperature increment instead of the 0.5% reduction of solar energy conversion efficiency in previous years [5]. Hence, every 10℃ temperature increment leads to a reduction of 4% in terms of efficiency. An increase in the panel temperature reduces the produced power. Even the slightest temperature rise of the solar PV panel critically reflects the voltage, which results in low power and efficiency. The temperature coefficient of voltage is -0.3%/℃, i.e., every 1℃ rise in temperature leads to a voltage drop of 0.3% [7].
The idea of solar PV cooling has been developed, and the technology is progressing under R&D. The state of the art of PV cooling techniques are compiled and reported by Dwivedi et al. [8] and Sharaf et al. [9]. They concluded that PV surface temperature rise is associated with the absorbed solar radiation that is converted into heat, resulting in reduced power output, energy efficiency, performance and life of the panel. The use of cooling techniques can offer a potential solution to avoid excessive heating of PV panels and reduce cell temperature. The technology can be divided into active and passive methods [10, 11]. The active cooling mechanism is any cooling mechanism that uses external power, such as a water tube in which water passes at the backside of the PV panel using a pump, forced air convection by fans etc. In contrast, the passive cooling mechanism does not use any power to impose the motion of the working fluid [10]. Sharaf et al. [9] concluded that the passive cooling technique is easy and simple, and a low heat transfer rate characterises low cost. Still, it does not provide a high enhancement in the photovoltaic performance. The active cooling technique is considered an effective way to improve PV performance. Still, it depends on an external power source, so the external power is derived from the produced power, reducing the net output.
There are numerous attempts to enhance PV performance using cooling water. Fudholi et al. [12] presented a performance analysis of the PV/T using water collectors at the backside of the PV panel. They studied the water flow rate variation and found that it is insignificant, up to 0.024 kg/s. An innovative active cooling technology incorporating a ground heat exchanger with the PV panel has been developed by Reda et al. [13, 14]. They reported that the water ground heat exchanger reduced the temperature of the PV panel surface by around 8-10℃, which achieved 9.0% more efficiency than the non-cooled PV panel. Bayrak et al. [15] studied three different cooling techniques in their experimental investigations, namely, Phase Change Material (PCM), Thermoelectric (TEG) and aluminium fins. The fins have the highest enhancement of power output. By water spray, Jailany et al. [16] and Lubon et al. [17] carried out an experimental evaluation on PV performance enhancement by water spray. Forced water spray cooling of PV [16] resulted in a decrease in solar cell temperature by 9.07℃ and an increase in the solar cell output power by 1.73 Volt, which is an increase in power gain and efficiency by 9.27% and 0.71%, respectively. Lubon et al.’s [17] experiment by spray water cooling showed that the cooled modules dropped to almost 25℃, whilst the temperature of the non-cooled module was 45℃. This temperature reduction resulted in a 20% increase in power. Supian et al. [18] tested the effect of flowing water on the upper surface on the temperature reduction. They found the temperature of the solar panel without cooling is about 52.83℃ and with the cooling system is about 31.85℃.
Cooling by phase change material is another approach to reduce the PV temperature. The PCM can maintain a constant temperature of the PV panel and has the advantage of being a passive technique as there is no need for circulation. The technique has been reviewed by Seto et al. [19]. Dixit and Yadav [20] investigated how an RT 35 (Rubitherm) PCM reduces the operating temperature of the photovoltaic panel and tries to maintain its temperature close to the ambient temperature, while Sharaf et al. [21] investigated an aluminium metal foam (AMF) with PCM for thermal regulation of a PV system. Their experiments revealed that the power produced from PV-PCM/AFM system was 1.85%, 3.38%, and 4.14% higher than conventional PV in December, January, and February, respectively.
PV cooling by airflow is another approach to enhance the PV module performance by reducing the panel temperature. Most air PV cooling is performed by fins installation at the panel's backside. Air may dissipate heat from the panel back surface by natural or forced cooling. Some of the enhancements of the PV system by air cooling have been carried out experimentally, and some numerically. Arifin et al. [5] performed an experimental and numerical investigation of air cooling for PV panels using aluminium fins. They found that the panel temperature reduces as the number of fins increases. The numerical analysis using ANSYS Fluent temperature shows it can be reduced to 10.2℃ on average, equating to a 2.74% increase in efficiency. Through numerical techniques, Popovici et al. [22] studied the cooling performance of ribs installed at the backside of the PV panel with a focus on the rib’s inclination angle. The power production is enhanced by 6.97% to 7.55% compared to the base case, for angles of the ribs of 90° and 45°, respectively. A built-in heat sink model attached to the backside of the PV panel was analysed by Kim et al. [23] using Fluent software. They simulated two cases of the heat sink, metal mesh and fins. The simulation showed that the metal mesh and cooling fins generated 48.25℃ and 46.56℃, respectively, while the result for the base case without a heat sink was 49.74℃. The panel temperature differences calculated regarding the base case were 1.49℃ for metal mesh and 3.18℃ for cooling fins. Ahmad et al. [24] conducted a numerical simulation to investigate electrical and cooling performance for PV modules by truncated multi-level fin heat sink fin. In their study, it was seen that the proposed fin gives a lower average temperature and higher electrical power for the PV module than the plane fin. Many previous studies aimed to extend the heat transfer surface to refine the heat transfer performance in a PV/T collector for a large-size PV system.
In conclusion, the attempts at PV cooling are either active or passive. The cooling fluids are mainly water or air. Passive air cooling by backside fins has been adopted to cool the PV panels of a power plant in Malaysia, a tropical country. The site measurements showed a small decrease of less than 2℃ by the fins’ natural cooling, whereas the average temperature reduction should typically be around 4℃ to 8℃, as demonstrated in the literature. Thus, this study investigates this underwhelming performance and recommends solutions to enhance the PV cooling by backside installed fins. A computational simulation of the PV/T cooling by naturally air-cooled fins at the panel's backside has been developed and validated to achieve the objective. ANSYS Fluent is utilised to simulate and analyse the air-thermal field near the fins array and evaluate the cooling performance of PV panels by predicting the temperature distribution in terms of contours.
The research has experimental and computational methodological approaches. In-situ measurement results have been acquired from an experimental setup of PV and PV/T systems. The computational simulation has been performed utilising the CFD capability of ANSYS Fluent commercial software.
The research involved the following methodologies:
I. Experimental measurement of the bare PV system.
II. Experimental measurements of PV/T system after attaching fins arrays at the backside of the PV panels.
III. Numerical simulation of the bare PV panel.
IV. Numerical simulation of the PV/T, where heat sink of fins is attached to the backside of the PV panel.
V. Numerical simulation of the PV/T with different fins orientation of 45°, 90°, 135°.
2.1 Experimental system description and site measurements
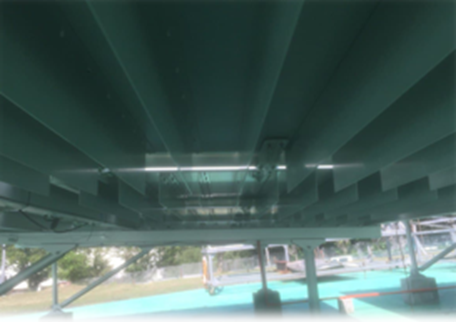
The experimental system consists of 14 PV panels. Each PV panel has a 2 m length×1 m width. The fin dimensions are 830 mm in length, 60 mm in height and 2 mm in thickness. A total of 11 fins were installed, and the distances between the fins are uniform at 105 mm. The fins are made of aluminium. The dimensions of the base plate are 1260-mm-length×830-mm-width×2-mm-thickness. The fin array at the backside is shown in Figure 1, and the specifications of the panels and the installed fins array are provided in Table 1. The setup is arranged in 2 rows. Each raw consists of seven panels.
Figure 1. The backside of the experimental PV setup
Table 1. Specifications of the panels and fins
|
PV Cell |
|
|
Length |
2000 mm |
|
Width |
1000 mm |
|
Fins |
|
|
Base Length |
1260 mm |
|
Base Width |
830 mm |
|
Base Thickness |
2 mm |
|
Fin Length |
830 mm |
|
Fin Height |
60 mm |
|
Fin Thickness |
2 mm |
|
Distance between Fins |
105 mm |
|
Number of Fins |
11 Fins |
|
Heat Sink Material |
Aluminium |
2.2 Measurement procedure
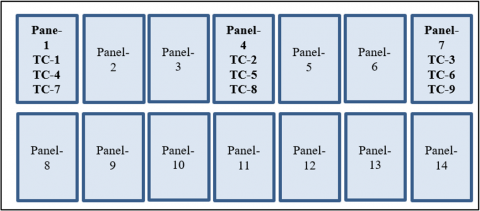
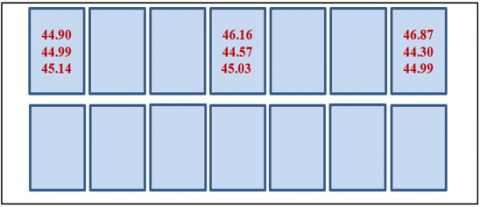
Figure 2. The selected panels from the experimental setup and the coding of the K-type thermocouples on each PV module
Figure 3. The location of thermocouples fixed at the backside of the PV panel, TC-number refers to the coding of the thermocouples (Sample is Panel-4)
Among the 14 PV/T panels of the actual system, experimental investigations have been carried out using three different PV/T panels to monitor the temperature changes over the day. K-type thermocouples are placed at the longitudinal centreline of the backside of the solar PV panel. DT80 Data Logger was used to store the temperature records. The locations of the selected PV modules are shown in Figure 2. The data gathered are in sequence with its thermocouples, as shown in Figure 3.
2.3 Modelling and simulation
The main aim of the simulation is to detect the reason for the low influence of the installed fins on the PV panel’s cooling. In addition, the study is further extended to compare the fins’ performance at various inclination angles. Hence, the generated model of the PV panel is similar in geometries, materials and operational conditions to the experimental system.
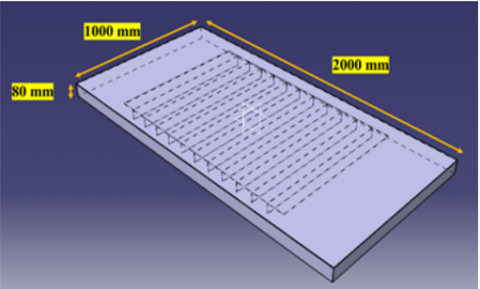
First, the heat sink, including the base plate and the fins, is generated, as shown in Figure 4. The plate is 1260 mm in length, and the fins are 830 mm in length and 60 mm in height. Second, the PV panel was simulated with five rectangular layers of Glass, EVA film, PV cell, PVF, and EVA film. The geometries of the PV panels are provided earlier in Table 1. Third, the heat sink and the PV models are compiled together to simulate the PV/T configuration of the system.
Figure 4. Configuration of the fin base plate and the extended surfaces attached to the panels’ backside
The fin’s base plate was assumed to have perfect contact with the panel’s backside. The fluid domain dimensions used in the simulation are 2000-mm-length and 1000-mm-width, while the height is 80-mm-thickness. The compiled PV/T is shown in Figure 5.
Figure 5. Schematic of the completed assembly of the system PV/T
CATIA software is used to design the model. The model is then saved in “.igs” format and imported to ANSYS software to read and simulate the model. ANSYS-Fluent is used for the thermal simulation to predict the fluid flow, heat and mass transfer, the chemical reaction in the PV module and other related processes.
2.4 Simulation conditions
The conditions used as inputs were adopted from the experimental system, as presented in Table 2. Values of the heat transfer coefficient and the turbulence intensity are adopted from Popovici et al. [22].
Table 2. Simulation conditions
|
Parameter |
Simulation value |
|
Ambient Temperature |
35℃ (Uniform Temperature) as the mean of the experimental data |
|
Initial Temperature |
35℃ |
|
Solar Irradiance |
Adopted from experimental data (W/m2) |
|
Wind Velocity |
0.5 m/s, as the mean of the experimental data |
|
Heat Transfer Coefficient |
8 W/m2℃ |
|
Turbulence Intensity |
5.5% |
2.5 Materials
It is extremely important to simulate the correct properties of the materials to get the correct simulation prediction results. Table 3 shows the mechanical and thermal properties of the PV panel simulated in this study utilising the previous simulation studies in the literature, like Reda et al. [13], Popovici et al. [22], and Kim et al. [23].
Table 3. Mechanical and thermal properties of the PV panel
|
Layer |
Thickness (mm) |
Thermal conductivity (W/m˖K) |
Density (kg/m3) |
Specific heat capacity (J/kg·K) |
|
Glass |
3.000 |
1.8 |
3000 |
500 |
|
PV Cell |
0.225 |
148 |
2330 |
677 |
|
EVA |
0.500 |
0.35 |
960 |
2090 |
|
PVF |
0.100 |
0.2 |
1200 |
1250 |
2.6 Simulation model and governing equations
The k-ε turbulence model is widely used to simulate flow fields with turbulence. The general assumption is that the flow is steady turbulence rather than a transient flow type since the research does not study flow changes over time. Another assumption is that the turbulent viscosity is isotropic, meaning the material properties have identical values in all directions.
The theory comprises equations governing the turbulent kinetic energy, k, and dissipation, ε, as well as the three conservation equations for mass, momentum and energy. Explicit forms of all these equations can be found in the software user manual or the relevant technical literature.
2.7 Mesh generation
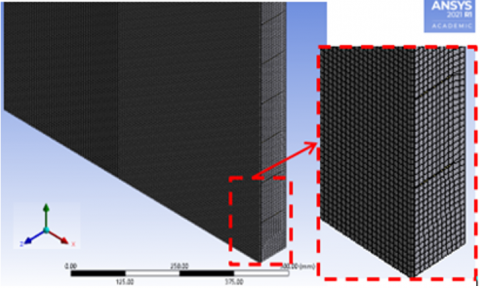
The mesh generation process is conducted after the CAD model is imported to ANSYS. The reference case study is already enough to set the element size to 10 mm. Meanwhile, a lower size of the elements is required for a more accurate solution for the case study with fins. Hence, the suitable element size for this case is 7 mm. The meshed PV is shown in Figure 6.
Figure 6. The mesh of the assembly
The type of mesh used is the default meshing properties with a hexahedral element. No other properties have been changed or improvised due to the limitation of processing power on the computer to compute the numerical calculations. The simulation results are still considered reasonable and accurate with the default meshing in the system. The meshed assembly, shown in Figure 3, has 401,760 nodes and 374,255 elements.
The results presentation is arranged to start with the experimental measurements, the validation of the numerical procedure and then the simulation results. Lastly, the influence of the various orientations of the fins on the cooling performance is presented.
3.1 Experimental results
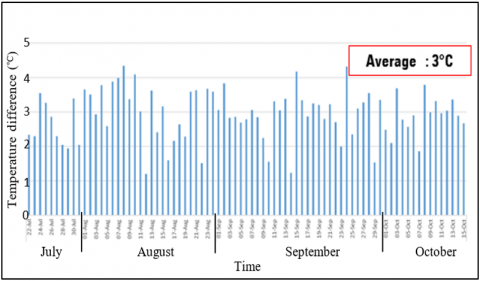
The system temperature measurements at the backside of the panels have been recorded for over two years. The first year for the PV without a heat sink and the second year for the PV/T with a heat sink. The mean difference in the temperature between the two cases is shown in Figure 7 over four months. The mean temperature reduction during the two years of measurements is around 3℃.
Figure 7. Measurement results of the temperature reduction due to the installation of the heat sink
3.2 Validation of the model
The simulation results have been compared to the actual solar PV/T cooling system data. The numerical prediction accuracy is acceptable, with the least of a 15% difference from the experimental data calculated from
Percentage of RelativeTemp. Diff. $=\frac{\left|T_{\text {actual }} \;\;\,-T_{\text {simulation }} \;\;\;\,\right|}{T_{\text {actual }}} \times 100$
For the validation of the CFD simulation, four days of repeated measurements in August were performed on the system before the installation of the heat sink. The mean temperature measurements results are shown in Figure 8 as mean values of four days of repeated measurements. The overall mean of the four days is 46.90℃.
The simulation results using the same weather and solar conditions were generated, and the mean predicted temperature was 48.37℃ considering bare PV panel before installation of the fins array model. The relative percentage of temperature differences between numerical and experimental results is 3.13%, concluding that the simulation procedure solution is accurate as the percentage of error is less than 5%.
Figure 8. The temperature measurement results (℃) by nine thermocouples at the rear of the PV panels 1, 4 and 7, as the mean of four-day repeated measurements
3.3 Effectiveness of passive cooling by fins
The effectiveness of the heat sink installed at the rear side of the PV panel was investigated experimentally and numerically. The experimental results obtained from temperature measurements are shown in Figure 9 as the mean of four days of repeated measurements in August.
Figure 9. The temperatures measurement results (℃) by nine thermocouples at the rear of the three selected PV/T modules, as the mean of four days of measurements
The mean measured temperatures of the three selected modules for the bare PV and the PV/T systems are presented in Table 4. The mean cooling effectiveness is only 1.69℃, with reduced backside temperature, a 3.6% relative percentage reduction. It could be concluded that this is not a sufficient performance of the added heat sink.
Table 4. Mean experimental temperature measurement of the PV and PV/T panels surfaces and the reduction gained from the fins’ cooling
|
Module |
Bare case ℃ |
PV/T Finned case ℃ |
Reduced surface temperature ℃ |
Relative percentage difference |
|
1 |
46.85 |
45.01 |
1.84 |
3.9% |
|
4 |
46.63 |
45.25 |
1.38 |
2.9% |
|
7 |
47.24 |
45.38 |
1.86 |
3.9% |
|
Mean |
46.90 |
45.21 |
1.69 |
3.6% |
In terms of simulation prediction, the results of the bare and PV/T cases are in Table 5. The average temperature distribution for the whole area of the backside of the PV bare case panels is 48.37℃. It is 13.4℃ higher than the ambient temperature. The average temperature distribution for the whole area of the backside of the PV/T with fins case is 44.54℃, i.e., 9.54℃ higher than the ambient temperature. As a mean predicted value from the simulation, the fins have managed to cool the PV panel by 3.86℃. The maximum performance of the fins is an 11.34℃ reduction in the panel backside temperature.
Table 5. Mean simulation temperature prediction of the bare case and the PV/T case using the mean values of the experimental data
|
Parameter |
Bare case ℃ |
PV/T Finned case ℃ |
Reduced surface temperature ℃ |
Percentage of temperature reduction |
|
Maximum temperature |
59.74 |
48.4 |
11.34 |
19% |
|
Mean temperature |
48.37 |
44.54 |
3.86 |
7.97% |
The experimental measurement's mean percentage of temperature reduction is around 3.6%, while the predicted mean temperature reduction is around 8%. The simulation results are closer to the reported experimental and simulation investigations in the literature [22, 23]. The difference in the performance of the fins between the experimental and simulation results is due to the imperfect contact between the fin base plate and the backside of the module. There is a gap between the base plate and the module as the plate is attached to the panel by clips on the outer edges. In the simulation, a 100% contact area is assumed. Hence, it is advised that a thermal epoxy should be used to secure 100% area contact between the fin base plate and the backside of the PV modules. Another option for higher thermal contact between the back surface of the panel and the base plate of the array is using a sufficient number of pivots.
3.4 Effect of fins orientation on the cooling performance
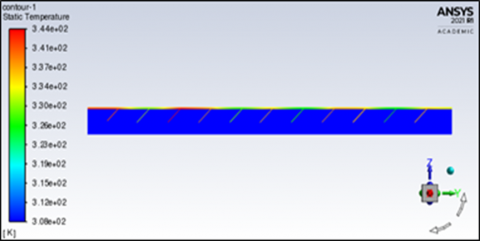
In addition to the conventional situation of 90°, another two configurations were tested with fin angles of 45° and 135° relative to the horizontal plane of the base plate. The contours in Figure 10, obtained for the 45° case, show the temperature distributions on the external surface of the PV panel. It can be seen that, although the contours show high temperature at the surface, the temperature reduction is quite good at the back of the PV panel; the temperature there is about 39.2℃, which is 4.2℃ above the ambient temperature. The temperature distribution on the upper surface is not uniform. However, the mean temperature of the upper surface is around 54.2℃.
The contour plots in Figure 11 present the temperature distribution in the PV/T simulated domain with fins oriented 135°. The heat dissipation is low, and the fins at this orientation create a dead flow zone between the base plate and the backside of the fins. The dead zone reduces the heat transfer from the fins to the surroundings. The mean backside temperature is about 54.05℃.
Figure 12 presents a comparative analysis of the temperature reduction performance of the PV/T with different fins orientations and the bare case, PV. Increasing the angle of the fins decreases the efficiency of the passive cooling system. The best orientation at the lowest average temperature achieved is by the 45° orientation, which could maintain the back-surface temperature at about 4.2℃ above ambient temperature. The 90° fin case can cool the module and maintain an average backside temperature of 44.54℃, i.e., 9.54℃ above the ambient temperature. In the bare case, the mean backside temperature is around 48.4℃ which is 13.37℃ above the ambient temperature. While, in the case of 135° oriented fins, heat is accumulated at the backside and causes the temperature to rise by 19.05℃ above the ambient. Surprisingly, the 135° oriented fins case performed negatively as the fins caused thermal accumulation and prevented the heat dissipation from the backside.
Figure 10. The side view of temperature distribution for the 45° case
Figure 11. The side view of temperature distribution for the 135° case
Figure 12. Comparison between the studied fin cases against the PV/T with various fins inclination versus the datum case
The investigation results using the backside passive cooling tool are also reported by Popovici et al. [22]. They used ribs at 45°, 90° and 135°. However, the reduced performance at 135° rib oriented is not causing the backside temperature to be worse than the bare case. In the case of ribs, the dead zone of the airflow is smaller than in the case of fins. Table 6 shows a comparison with previously reported techniques for PV cooling.
Table 6. Comparison between current study, using fins, and literature, using ribs
|
Study |
Type of cooling |
Fins / ribs orientation |
Decrease in temperature compared to bare case |
% of reduced temperature compared to bare case |
|
Popovici et al. [22] |
Natural passive by 50 mm ribs |
45 |
39.43 |
7.55 |
|
90 |
39.99 |
6.91 |
||
|
135 |
41.33 |
6.35 |
||
|
Current study |
Natural passive by 60 mm fins |
45 |
39.2 |
18.95 |
|
90 |
44.54 |
7.97 |
||
|
135 |
54.05 |
-11.74 |
PV and PV/T cooled by fins as a heat sink at the backside are investigated experimentally and numerically. The mean temperature predicted by simulation for the reference PV panel without heat sink fins is 48.37℃. This value is 3.13% higher than the experimental data, which is 46.90℃. Different fin configurations are simulated with fin orientations of 45°, 90° and 135°. The simulation results with fin orientation of 45° show a good heat dissipation at the backside of the panels with a 18.95% relative enhancement in the cooling performance, which encourages the use of fins array at 45° as a passive cooling technique for the PV. At 135° oriented fins, the temperature shows a remarkably unfavourable result of 11.7% increased backside temperature of 54.05℃ on average. This reveals that increasing the fins angle does not benefit the heat transfer rate. The average temperature distribution achieved in the reference case study is 48.4℃, whereas the temperature distribution produced when solar PV/T with fins at 90° is roughly 44.54℃, i.e., equivalent to a 7.97% cooling enhancement. The computed cooling enhancement predicted by simulation using a 90° fins array is roughly 7.9%, while the measured cooling enhancement is 3.9%.
It is recommended to improve the thermal contact between the base plate of the fin array with the panel backside by using thermal epoxy or a large number of pivots. Future analysis is recommended by simulating a similar configuration with various fins height and numbers.
[1] Philipps, S. (2023). Photovoltaics report. Fraunhofer Institute for Solar Energy Systems.
[2] Wilson, G.M., Al-Jassim, M., Metzger, W.K., et al. (2020). The 2020 photovoltaic technologies roadmap. Journal of Physics D: Applied Physics, 53(49): 493001. https://doi.org/10.1088/1361-6463/ab9c6a
[3] Alim, M.A., Tao, Z., Abden, M.J., Rahman, A., Samali, B. (2020). Improving the performance of solar roof tiles by incorporating phase change material. Solar Energy, 207: 1308-1320. https://doi.org/10.1016/j.solener.2020.07.053
[4] Al-Kayiem, H.H., Reda, M.N. (2021). Analysis of solar photovoltaic panel integrated with ground heat exchanger for thermal management. International Journal of Energy Production and Management, 6(1): 17-31. https://doi.org/10.2495/EQ-V6-N1-17-31
[5] Arifin, Z., Suyitno, S., Tjahjana, D.D.D.P., Juwana, W.E., Putra, M.R.A., Prabowo, A.R. (2020). The effect of heat sink properties on solar cell cooling systems. Applied Sciences, 10(21): 7919. https://doi.org/10.3390/app10217919
[6] Mazón-Hernández, R., García-Cascales, J.R., Vera-García, F., Kaiser, A.S., Zamora, B. (2013). Improving the electrical parameters of a photovoltaic panel by means of an induced or forced air stream. International Journal of Photoenergy, Article ID: 830968. https://doi.org/10.1155/2013/830968
[7] Gangoda, D., Chauhan, S.K. (2022). Performance analysis of grid integrated PV based distributed generation with maximum power point tracking. In 2022 International Conference on Smart Technologies and Systems for Next Generation Computing (ICSTSN). Villupuram, India, March 25-26, 2022, IEEE. pp. 1-6. https://doi.org/10.1109/ICSTSN53084.2022.9761309
[8] Dwivedi, P., Sudhakar, K., Sonia, A., Solominc, E. Kirpichnikova, I. (2020). Advanced cooling techniques of PV modules: A state of art. Case Studies in Thermal Engineering, 21: 100674. https://doi.org/10.1016/j.csite.2020.100674
[9] Sharaf, M., Yousef, M.S., Huzayyin, A.S. (2022). Review of cooling techniques used to enhance the efficiency of photovoltaic power systems. Environmental Science and Pollution Research, 29(18): 26131-26159. https://doi.org/10.1007/s11356-022-18719-9
[10] Özakin, A.N., Karsli, S., Kaya, F., Güllüce, H. (2016). The heat recovery with heat transfer methods from solar photovoltaic systems. Journal of Physics: Conference Series, 707(1): 012050. https://doi.org/10.1088/1742-6596/707/1/012050
[11] Khordehgah, N., Żabnieńska-Góra, A., Jouhara, H. (2020). Energy performance analysis of a PV/T system coupled with domestic hot water system. ChemEngineering, 4(2): 22. https://doi.org/10.3390/chemengineering4020022
[12] Fudholi, A., Sopian, K., Yazdi, M.H., Ruslan, M.H., Ibrahim, A., Kazem, H.A. (2014). Performance analysis of photovoltaic thermal (PVT) water collectors. Energy Conversion and Management, 78: 641-651. https://doi.org/10.1016/j.enconman.2013.11.017
[13] Reda, M.N., Spinnler, M., AL-Kayiem, H.H., Sattelmayer, T. (2021). Assessment of condensation and thermal control in a photovoltaic panel by PV/T and ground heat exchanger. Solar Energy, 221: 502-511. https://doi.org/10.1016/j.solener.2021.05.004
[14] Reda, M.N., Spinnler, M.A.R.K.U.S., Al-Kayiem, H.H., Sattelmayer, TH.O.M.A.S. (2020). Analysis of ground thermal control systems for solar photovoltaic performance enhancement. WIT Transactions on Ecology and the Environment, 246: 41-50. https://doi.org/10.2495/EPM200051
[15] Bayrak, F., Oztop, H.F., Selimefendigil. F. (2020). Experimental study for the application of different cooling techniques in photovoltaic (PV) panels. Energy Conversion and Management, 212: 112789. https://doi.org/10.1016/j.enconman.2020.112789
[16] Jailany, A.T., El-Al., A., Rashwan, M.A. (2016). Effect of water cooling on photovoltaic performance. MISR Journal of Agricultural Engineering, 33(1): 257-268. https://doi.org/10.3390/en13102414
[17] Lubon, W., Pełka, G., Janowski, M., Pajak, L., Stefaniuk, M., Kotyza, J., Reczek, P. (2020). Assessing the impact of water cooling on PV modules efficiency. Energies, 13(10): 2414. https://doi.org/10.3390/en13102414
[18] Supian, B.A., Ekaputri, C., Priharti, W. (2020). Increasing the output power of solar panel by using a cooling system. IOP Conference Series: Materials Science and Engineering, 830(3): 032039. https://doi.org/10.1088/1757-899X/830/3/032039
[19] Seto, D.B., Kristiawan, B., Arifin, Z. (2021). Solar cell cooling with phase change material (PCM) for enhanced efficiency: A review. IOP Conference Series: Material Science & Engineering, 1096(1): 012052. https://doi.org/10.1088/1757-899X/1096/1/012052
[20] Dixit, K.K., Yadav, I. (2022). Efficiency improvement of PV panel using PCM cooling technique. Renewable Energy Optimization, Planning and Control: Proceedings of ICRTE 2021, 1: 159-164. https://doi.org/10.1007/978-981-16-4663-8_15
[21] Sharaf, M., Huzayyin, A.S., Yousef, M.S. (2022). Performance enhancement of photovoltaic cells using phase change material (PCM) in winter. Alexandria Engineering Journal, 61(6): 4229-4239. https://doi.org/10.1016/j.aej.2021.09.044
[22] Popovici, C.G., Hudişteanu, S.V., Mateescu, T.D., Cherecheş, N.C. (2016). Efficiency improvement of photovoltaic panels by using air cooled heat sinks. Energy Procedia, 85: 425-432. https://doi.org/10.1016/j.egypro.2015.12.223
[23] Kim, J., Bae, S., Yu, Y., Nam, Y. (2019). Experimental and numerical study on the cooling performance of fins and metal mesh attached on a photovoltaic module. Energies, 13(1): 85. https://doi.org/10.3390/en13010085
[24] Ahmad, E.Z., Fazlizan, A., Jarimi, H., Sopian, K., Ibrahim, A. (2021). Enhanced heat dissipation of truncated multi-level fin heat sink (MLFHS) in case of natural convection for photovoltaic cooling. Case Studies in Thermal Engineering, 28: 101578. https://doi.org/10.1016/j.csite.2021.101578