Mansiya Yessenamanova*![]() | Zhanar Yessenamanova
| Zhanar Yessenamanova![]() | Anar Tlepbergenova
| Anar Tlepbergenova![]() | Маkhambet Moldir
| Маkhambet Moldir![]() | Baitemirova Nurgul
| Baitemirova Nurgul![]()
© 2023 IIETA. This article is published by IIETA and is licensed under the CC BY 4.0 license (http://creativecommons.org/licenses/by/4.0/).
OPEN ACCESS
The research conducted at Kh.Dosmukhamedov Atyrau University has focused on the cultivation of vegetable crops using hydroponic systems, with an emphasis on the regulation of acidity (pH) and electrical conductivity (EC) to foster optimal plant growth conditions. This investigation involved the utilization of a pH meter for acidity measurements and a total dissolved solids (TDS) meter for assessing electrical conductivity. A correlation was established between these critical parameters through the analysis of empirical data. It was found that the maintenance of mineral solution composition within hydroponic setups is imperative, requiring continuous monitoring of pH and EC to ensure nutrient availability to plants. The optimal pH range for most vegetable crops was identified as 6.0 to 7.0, with an EC range of 300 to 1300 µS/cm. Furthermore, it was observed that a positive correlation between pH and EC is conducive to the bioavailability of minerals in the solution. In instances of elevated pH and TDS, the addition of an acidic solution was recommended, while a decrease in these values necessitated the introduction of an alkaline solution to restore balance. The integration of STEM methodologies in hydroponic applications promotes a paradigm shift in education—from mere observation of plant growth in correlation with acidity and electrical conductivity towards an approach grounded in hypothesis-driven experimentation. This shift not only bridges the gap between discrete subject areas but also transitions from abstract knowledge acquisition to the resolution of tangible, real-world issues.
pH, acidity, TDS, electrical conductivity, hydroponic device, vegetable crops
1.1 Educational transformations in response to technological advancements
The landscape of education is in constant flux, adapting to the emergence of novel occupations and technologies. Modern educators are tasked with the imperative of equipping learners with knowledge and competencies that align with contemporary demands [1]. The STEM pedagogical framework is instrumental in integrating theoretical understanding with practical application [2]. It is through the exploration of natural phenomena that students are able to apply scientific concepts to practical challenges. An example of such application is evident in hydroponic systems, where plant roots are immersed in nutrient-rich solutions, facilitating robust growth.
1.2 Contemporary challenges in agricultural practices
The burgeoning global population necessitates an increased food supply, yet the majority of arable land is compromised by pollutants such as pesticides, herbicides, and various chemicals including heavy metals and industrial wastes [3]. The crux of the food scarcity issue lies not in overconsumption by affluent nations, but rather in the dearth of suitable conditions for agriculture in impoverished regions, compounded by desertification, ongoing conflicts, droughts, and pestilence [4-6]. The reduction of cultivable land globally poses the pressing question: where can food be grown when available space is diminishing? Hydroponic cultivation emerges as a potential solution to this quandary. This investigation aims to examine the modulation of pH and EC within hydroponic systems to optimize conditions conducive to plant growth and development.
1.3 Fundamentals of hydroponic cultivation
Hydroponics, the practice of cultivating plants in soilless environments, involves the use of water solutions containing dissolved nutrients [7]. This method is distinguished from traditional agriculture by the reliance on inert substrates such as expanded clay or coconut coir, which provide structural support but not nutrition. Nutrient provision is facilitated through tailored aqueous-salt solutions, optimized for specific plant varieties. In controlled environments, factors typically moderated by nature, such as oxygen dissolution in rainwater which subsequently oxygenates plant roots, must be artificially replicated [8]. Oxygen is as vital to plants as it is to animals; without it, they perish. Consequently, hydroponic systems must ensure continuous oxygen availability at the roots. Advancements in this field have led to the development of the nutrient film technique by Allen Cooper in the 1960s, which addressed the limitations of earlier systems by focusing on oxygenation and scalability of the nutrient solution.
1.4 Advantages of hydroponic agriculture
Vegetables and fruits grown hydroponically are comparable in taste to those grown in soil, contingent upon adherence to proper cultivation protocols. Unlike soil cultivation, where plants vie for nutrients, hydroponic systems deliver precise nutrient formulations directly to the plants [9-10]. Recognized as a viable method for both commercial and home cultivation, hydroponics is responsible for over 70% of the world's marketed herbs and ornamental flowers [11]. The method is particularly advantageous in regions unsuitable for traditional agriculture, including polar and desert climates. From an environmental standpoint, hydroponics plays a significant role in water conservation.
The present study will employ measurements of pH and EC to monitor and adjust the nutrient solution composition in hydroponic setups using acids and alkalis, thus promoting optimal plant growth.
2.1 Study area
Students of the educational programs of Kh.Dosmukhamedov Atyrau University started start-up projects in the creation of hydroponic installations, so students of the educational programs 6B06103-Administration of systems and networks and 6B05201-Applied Ecology won the project and they prepared a hydroponic installation consisting of 6 pipes with a diameter of 110 mm and a length of 3 m, in total 18 m with 15 recesses for planting plants on each the pipe has a total of 90 recesses. All pipes are interconnected and represent a closed system. The lower end of the system is connected to a tank where water from the entire system is drained, and the upper end is connected to a 32/6 circulation pump, which supplies a nutrient solution from a 100 L tank. In each of the 90 open recesses, pots are installed where plants are planted. Inside each pot are filled with expanded clay, which is the basis for future plants. Seeds of vegetable crops and greens are planted in each pot. We planted parsley, dill, pepper, basil. The entire installation is illuminated by 6 LED lamps for plants and 2 floor fans are installed in the room, which in turn simulate the wind mode and maintain the room temperature in the range from 15℃ to 25℃.
2.2 Methods
The care of plants was carried out not only for the growth and development of plants, but also the water level, acidity and electrical conductivity of the nutrient solution in the container are controlled. This control allowed us to observe how plants react to an increase in pH and TDS data. Nutrients were added as the water level decreased with the addition of the required amount of water to the level of water intake through the pump. 10 ml of each of the FloraBloom, FloraGro and FloraMicro nutrient complexes was added to one bucket of water. To study the acidity of the nutrient solution and the level of mineralization, observations of pH and TDS were carried out. LED lamps were connected during the daytime and turned off at night. If necessary, to protect against pests, a weak solution of potassium permanganate was added to the water - 1% solution of potassium permanganate (in 99 ml of pure, slightly heated water, 1 g of crystals is dissolved).
There are several ways to check the pH level of your nutrient solution, such as paper test strips, liquid pH test (kits) and digital pH meters.
Paper pH test strips are impregnated with special dyes that are sensitive to pH values. If they are dipped in nutrient solution, they will change color. The paper strips are compared with a color scale to determine the pH value [12].
Liquid pH Test has a wide range of measurements - from 4.0 to 8.5 - sufficient for the vast majority of analyses.
Liquid pH test is extremely easy to use: half fill the tube with nutrient solution, add 2 drops of pH test, shake and observe the resulting color. Compare the color of the resulting solution with the attached color table to determine the pH of your solution.
Digital pH meter is the most high-tech method to check the pH value. All you need is to dip the electrode into the nutrient solution for a few minutes — and the pH value will be displayed on the LCD display. Digital pH meters work very quickly and accurately if properly calibrated. However, such devices require proper care, otherwise they cease to work: the glass ball must be clean, and some electrodes must always be in a special solution. Before use, the pH meter should be checked and, if necessary, calibrated to achieve accuracy.
To get the best results in hydroponics, it is difficult to do without a TDS meter, it is also commonly called a conductometer or a salt meter [13]. The conductometer measures the level of electrical conductivity of a liquid. When we add mineral fertilizers to water, its electrical conductivity changes, and we can prepare the nutrient solution we need for our plants.
Mineralization is the total amount of dissolved particles or Total Dissolved Solids (TDS). A milligram per liter (mg/l) is considered to be a unit of mineralization level. This means the weight of all dissolved substances (in milligrams) in 1 liter of water. Also, the level of mineralization can be expressed in particles per million water particles – abbreviated ppm (parts per million – particles per million). Such an abbreviation can be found in European sources. This means the number of particles dissolved in 1 million water particles. The ratio between the units of measurement mg / l and ppm is almost equal – 1 mg / l = 1 ppm.
With the help of a digital TDS meter, you can find out the ppm of the solution in a matter of seconds. It is only necessary to remove the cap, turn on the device and lower it into the solution for a few seconds, stirring the solution slightly with the device. After 5 seconds, when the readings are set, you can record the readings.
Any nutrients will not make the plant strong if they are poorly absorbed for it. Table 1 shows data on the solubility of salt in solution.
Table 1. Solubility of salt (electrical conductivity of a completely dissolved substance), in parts per million ppm
|
Desired Level |
Allowed Level |
Possible Harm from Salts (Overdose) |
|
From 500 to 1300 |
From 1300 to 2000 |
From 2000 and above |
In order to understand how much nutrients to add, we need to find out how much these nutrients are available to plants. After all, even with sufficient intake of nutrients, they may not be available to plants, because they turn into salt and precipitate. In addition, hard water leads to the formation of calcareous plaque, i.e., precipitation of vital elements. In order to correctly calculate the amount of acid that reduces the formation of salts, it is necessary to determine how much the acidity level depends on the mineralization of the solution. For this purpose, calculations of the correlation between pH (acidity) and TDS (mineralization) were carried out. The correlation dependence between pH and TDS can be described using an equation of the form [14]:
$r=\frac{\overline{x \times y}-x \times y}{S_x \times S_y}$ (1)
where, $S_x=\sqrt{\overline{x^2}}-x^2$ and $S_y=\sqrt{\overline{y^2}}-y^2$
Basic properties of the sample correlation coefficient:
1. The correlation coefficient of two quantities that are not connected by a linear correlation is zero.
2. The correlation coefficient of two quantities related by linear correlation is equal to 1 in the case of increasing dependence and -1 in the case of decreasing dependence.
3. The absolute value of the correlation coefficient of two values connected by a linear correlation relationship satisfies the inequality r ≤ 1. At the same time, the correlation coefficient is positive if the correlation dependence is increasing, and negative if the correlation dependence is decreasing.
4. The closer r is to unity, the closer the correlation between the values Y, X.
PH is a hydrogen indicator that characterizes the concentration of active hydrogen ions in water. For ease of display, a special indicator was introduced, called pH, which is a logarithm of the concentration of hydrogen ions, taken with the opposite sign, i.e., pH = -log[H+] [15].
To put it more simply, the pH value is determined by the quantitative ratio of H + and OH-ions in water formed during the dissociation of water. If the water has a reduced content of free hydrogen ions (pH > 7) compared to OH-ions, then the water will have an alkaline reaction; and with an increased content of H+ ions (pH < 7) – acidic. In perfectly pure distilled water, in which no gases are dissolved, these ions will balance each other. In such cases, the water is neutral and pH = 7.
The pH varies in the range from 0 to 14 units and it should be remembered that a change in pH by 1 unit is a 10-fold change in the acidic properties of the solution!
If the pH level is in the wrong range, then the plant will not be able to absorb some of the necessary elements for growth [16]. All plants have their own range of pH values at which healthy growth will occur. This value varies from plant to plant, but still most plants prefer an acidic environment (from 5.8 to 6.2), while many plants are able to survive in the range between 5.0 and 7.0.
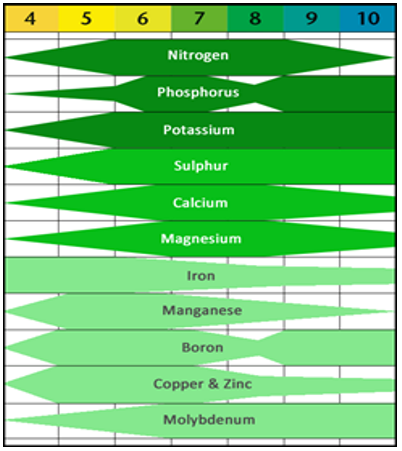
Plants grown on acidic environments may experience various deficiencies, including aluminum (Al), hydrogen (H), and/or manganese poisoning (Mn), as well as deficiencies in the nutrients calcium (Ca) and magnesium (Mg).
In alkaline media, the content of molybdenum (Mo) and macronutrients (except phosphorus) increases, and the content of phosphorus (P), iron (Fe), manganese (Mn), zinc (Zn), copper (Cu) and cobalt (Co) decreases and can negatively affect the development of the plant [17].
From Figure 1 it can be seen that each element can become more or less accessible to the plant depending on the change in the pH level. If the pH value of your solution is out of the specified range, this may cause a shortage of important elements, which in turn will slow down growth and lower the final yield [18].
Figure 1. Availability of elements by plants depending on changes in pH level
The concentrations of nutrients (salts) are an indicator of the degree of electrical conductivity of the solution. Dissolved salts give ions, which conduct current in solution. The main component of the hydroponic solution is dissolved salts [19].
Each salt in a complex solution has a different amount of electrical conductivity [20].
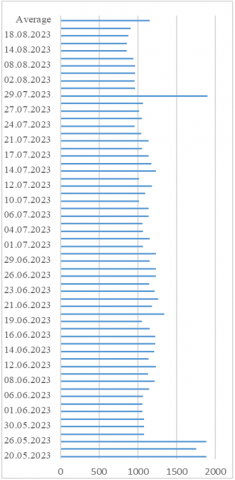
For three months, studies were conducted to determine the acidity and electrical conductivity in the tank of an aqueous mineral solution of a hydroponic device constructed in the laboratory of hydroponics of Kh.Dosmukhamedov Atyrau University. The results obtained are shown in Figures 2 and 3.
As can be seen from the bar chart, the acidity in the mineral solution of the hydroponic device was in the range of 5.92-8.56. The highest pH value of 8.56 was noted at the beginning of the study [21]. The lowest value was noted in the middle of the study, i.e., on July 12 and amounted to 5.92. The average content is 6.89. According to Figure 1, we see that the optimal acidity content is from 5.0 to 7.0, therefore, studies show that optimal conditions for acidity are met in the hydroponic device and only sometimes a slight excess above 7.0 was noted, for example, on May 26, it was 7.46, May 31 – 7.5, June 6 – 7.45, June 27 - 7.61, 5 July – 7.34, July 28 – 7.33, July 31 – 7.31.
The increase in acidity in our observation showed that the leaves of the plants began to turn yellow, and the stems turned red, in some cases the weakest plants of the upper sections died off. In addition, the taste of dill, parsley and basil has also changed, which have become bitter. After adding nitric acid or phosphoric acid, the bitterness of green crops passed. In order to understand how these changes are related to the formation of salts, observations of mineralization were also initiated.
Figure 2. Determination of acidity in the tank of an aqueous mineral solution of a hydroponic device constructed in the Laboratory of Hydroponics of Kh.Dosmukhamedov Atyrau University
Figure 3. Determination of electrical conductivity in the tank of an aqueous mineral solution of a hydroponic device constructed in the Laboratory of Hydroponics of Kh.Dosmukhamedov Atyrau University
The bar chart shows that the electrical conductivity content in the mineral solution of the hydroponic device ranges from 855 to 1886 [22]. The lowest indicators are characteristic at the beginning of the study and were May 20, 1886, May 23 – 1774 ppm and May 26, 1882 ppm. Low electrical conductivity indicators were noted in the month of August, starting from July 31 and all indicators did not exceed 1000 ppm, but on July 29 this indicator was increased and amounted to 1896 ppm. The average figures are 1149.94 ppm. According to Table 2, the optimal electrical conductivity for most elements is from 100 to 1000 ppm, and according to some sources from 300 to 1300 ppm. Consequently, studies show that optimal conditions for electrical conductivity are observed in the hydroponic device, except for those days when exceedances were recorded from May 20 to May 26 and July 29.
The correlation between the acidity and electrical conductivity was calculated according to formula 1 according to Table 3.
Table 2. The magnitude of the electrical conductivity of various elements
|
Element |
Boundary Concentrations |
Average Level |
|
Nitrogen |
150-1000 |
250 |
|
Calcium |
100-500 |
200 |
|
Magnesium |
50-100 |
75 |
|
Phosphorus |
50-100 |
80 |
|
Potassium |
100-400 |
300 |
|
Sulfur |
200-1000 |
400 |
|
Copper |
0.1-0.5 |
0.05 |
|
Boron |
0.5-5.0 |
1.0 |
|
Iron |
2.0-10.0 |
5.0 |
|
Manganese |
0.5-5.0 |
2.0 |
|
Molybdenum |
0.01-0.05 |
0.02 |
|
Zinc |
0.5-1.0 |
0.5 |
Table 3. Determination of acidity and electrical conductivity in the tank of an aqueous mineral solution of a hydroponic device constructed in the Laboratory of Hydroponics of Kh.Dosmukhamedov Atyrau University
|
Date |
pH (х) |
TDS (у) |
х·у |
x2 |
y2 |
|
20.05.2023 |
8.56 |
1886 |
16144.2 |
72.5904 |
3556996 |
|
23.05.2023 |
6.8 |
1754 |
11927.2 |
42.24 |
3076516 |
|
26.05.2023 |
7.46 |
1882 |
14039.7 |
55.6516 |
3541924 |
|
29.05.2023 |
6.72 |
1078 |
7244.16 |
45.1584 |
1162084 |
|
30.05.2023 |
7.0 |
1082 |
7574 |
49 |
1170724 |
|
31.05.2023 |
7.5 |
1078 |
8085 |
56.25 |
1162084 |
|
01.06.2023 |
6.75 |
1060 |
7155 |
45.5625 |
1123600 |
|
02.06.2023 |
6.88 |
1059 |
7285.92 |
47.3344 |
1121481 |
|
06.06.2023 |
7.45 |
1069 |
7964.05 |
55.5025 |
1142761 |
|
07.06.2023 |
7.15 |
1144 |
8179.6 |
51.1225 |
1308736 |
|
08.06.2023 |
6.71 |
1220 |
8186.2 |
45.0241 |
1488400 |
|
09.06.2023 |
7.22 |
1132 |
8173.04 |
52.1284 |
1281424 |
|
12.06.2023 |
7.28 |
1234 |
8983.52 |
52.9984 |
1522756 |
|
13.06.2023 |
6.92 |
1137 |
7868.04 |
47.8864 |
1292769 |
|
14.06.2023 |
7.05 |
1210 |
8530.5 |
49.7025 |
1464100 |
|
15.06.2023 |
6.8 |
1228 |
8350.4 |
42.24 |
1507984 |
|
16.06.2023 |
7.05 |
1226 |
8643.3 |
49.7025 |
1503076 |
|
17.06.2023 |
6.7 |
1156 |
7745.2 |
44.89 |
1336336 |
|
19.06.2023 |
7.07 |
1054 |
7451.78 |
49.9849 |
1110916 |
|
20.06.2023 |
6.4 |
1342 |
8588.8 |
40.96 |
1800964 |
|
21.06.2023 |
7.4 |
1185 |
8769 |
54.76 |
1404225 |
|
22.06.2023 |
6.45 |
1261 |
8133.45 |
41.6025 |
1590121 |
|
23.06.2023 |
6.22 |
1221 |
7594.62 |
38.6884 |
1490841 |
|
24.06.2023 |
7.06 |
1149 |
8111.94 |
49.8436 |
1320201 |
|
26.06.2023 |
7.18 |
1236 |
8874.48 |
51.5524 |
1527696 |
|
27.06.2023 |
7.61 |
1236 |
9405.96 |
57.9121 |
1527696 |
|
29.06.2023 |
7.25 |
1153 |
8359.25 |
52.5625 |
1329409 |
|
30.06.2023 |
6.22 |
1234 |
7675.48 |
38.6884 |
1522756 |
|
01.07.2023 |
6.91 |
1067 |
7372.97 |
47.7481 |
1138489 |
|
03.07.2023 |
6.79 |
1152 |
7822.08 |
46.1041 |
1327104 |
|
04.07.2023 |
7.0 |
1069 |
7483 |
49 |
1142761 |
|
05.07.2023 |
7.34 |
1057 |
7758.38 |
53.8756 |
1117249 |
|
06.07.2023 |
6.2 |
1142 |
7080.4 |
38.44 |
1304164 |
|
08.07.2023 |
6.63 |
1139 |
7551.57 |
43.9569 |
1297321 |
|
10.07.2023 |
7.18 |
1014 |
7280.52 |
51.5524 |
1028196 |
|
11.07.2023 |
6.84 |
1094 |
7482.96 |
46.7856 |
1196836 |
|
12.07.2023 |
5.92 |
1184 |
7009.28 |
35.0464 |
1401856 |
|
13.07.2023 |
6.6 |
1019 |
6725.4 |
43.56 |
1038361 |
|
14.07.2023 |
6.57 |
1232 |
8094.24 |
43.1649 |
1517824 |
|
15.07.2023 |
6.67 |
1177 |
7850.59 |
44.4889 |
1385329 |
|
17.07.2023 |
6.5 |
1142 |
7423 |
42.25 |
1304164 |
|
19.07.2023 |
6.96 |
1053 |
7328.88 |
48.4416 |
1108809 |
|
21.07.2023 |
6.43 |
1138 |
7317.34 |
41.3449 |
1295044 |
|
22.07.2023 |
7.1 |
1043 |
7405,.3 |
50.41 |
1087849 |
|
24.07.2023 |
6.7 |
959 |
6425.3 |
44.89 |
919681 |
|
25.07.2023 |
6.42 |
1051 |
6747,.42 |
41.2164 |
1104601 |
|
27.07.2023 |
6.84 |
1014 |
6935.76 |
46.7856 |
1028196 |
|
28.07.2023 |
7.33 |
1066 |
7813.78 |
53.7289 |
1136356 |
|
29.07.2023 |
7.05 |
1896 |
13366.8 |
49.7025 |
3594816 |
|
31.07.2023 |
7.31 |
966 |
7061.46 |
53.4361 |
933156 |
|
02.08.2023 |
6.77 |
957 |
6478.89 |
45.8329 |
915849 |
|
05.08.2023 |
6.52 |
962 |
6272.24 |
42.5104 |
925444 |
|
08.08.2023 |
6.38 |
963 |
6143.94 |
40.7044 |
927369 |
|
12.08.2023 |
7.04 |
944 |
6645.76 |
49.5616 |
891136 |
|
14.08.2023 |
6.72 |
856 |
5752.32 |
45.1584 |
732736 |
|
16.08.2023 |
6.47 |
855 |
5531.85 |
41.8609 |
731025 |
|
18.08.2023 |
6.88 |
876 |
6026.88 |
47.3344 |
767376 |
|
20.08.2023 |
6.92 |
904 |
6255.68 |
47.8864 |
817216 |
|
Average |
6.89 |
1149.94 |
7944.84 |
48.933 |
1381997.61 |
$\begin{gathered}S_x=\sqrt{48.933-6.89^2}=\sqrt{48.933-47.4721}=\sqrt{1.4609} =1.208\end{gathered}$
$\begin{aligned} & S_y=\sqrt{1381997.614-1149.94^2} \\ & =\sqrt{1381997.614-1322362.0036} \\ & =\sqrt{59635.6104}=244.204 \\ & \end{aligned}$
$\begin{gathered}r=\frac{7944.845-6.89 \cdot 1149.94}{1.208 \cdot 244.204}=\frac{7944.845-7923.0866}{294.998432} \\ =\frac{21.7584}{294.998432}=0.0737\end{gathered}$
Calculations show that the correlation between acidity and electrical conductivity is 0.07. Using the gradation table to assess the relationship, we draw the following conclusions: the dependence of x and y is average, positive between acidity and electrical conductivity. Thus, an increase in acidity leads to an increase in electrical conductivity, i.e. to an increase in the level of salt mineralization [22].
In general, as the measurements of acidity and mineralization indicators show, in most cases the measurements do not exceed the optimal values, so the acidity index is in the range from 5 to 7, except for isolated cases exceeding 8.5, and the mineralization index is from 800 to 1300, also with isolated cases reaching 1800 ppm. At the same time, the results of the correlation dependence calculations show a positive value, which indicates a direct dependence of these indicators.
With proper cultivation of the plant, the pH and ppm values should not change. With the right lighting and humidity, the plant consumes nutrients and water equally and the ppm does not change. If a plant consumes more nutrients than water, the ppm decreases, while the pH usually increases. Often, problems such as yellowing of old leaves, reddening of petioles and stems can be caused by an excess of nutrients or a strong pH deviation.
To adjust the acidity of the working hydroponic solution, solutions are used to increase or decrease it (Table 4) [23]:
Table 4. Solutions used to reduce and increase acidity
|
Lower the pH |
Increase the pH |
|
Phosphoric acid |
Potassium Hydroxide (Caustic Potassium) |
|
Sulfuric acid (electrolyte) |
Potassium carbonate (potash) |
|
Nitric acid |
Baking soda |
|
Citric acid |
|
To shift the pH up or down, special solutions of pH UP and pH Down are used at the rate of 3 ml per 10l to shift 1 point up or down. For example, you have a pH of 4.0 water, and you need to raise it to 5.5. The following calculation is made:
5.5 – 4.0 = 1.5×3 = 4.5 ml of pH Up per 10 liters of water.
Table 5 presents data on the optimal pH level for vegetable crops.
Table 5. Optimal pH level for vegetable crops
|
Vegetable Crops |
pH |
|
Beans |
6-6.5 |
|
Broccoli |
6.5 |
|
Celery |
7.5 |
|
Eggplant |
6.5 |
|
Garlic |
6.5 |
|
Salad |
7.0 |
|
Onion |
7.5 |
|
Radish |
6.5 |
|
Zucchini |
6.0 |
|
Beet |
6.5 |
|
Turnip |
6.0 |
|
Asparagus |
7.5 |
|
Tomatoes |
6.0 |
|
Cauliflower |
7.5 |
|
Cucumbers |
6.5 |
|
Punch |
7.5 |
|
Peas |
6.0 |
|
Spinach |
6.5 |
|
Strawberry |
6.0 |
In the Table 6 below, the intervals for different stages of the plant are given (this is an approximate range, different types of plants are able to withstand different values of conductivity):
Table 6. Electrical conductivity (ppm)
|
Electrical Conductivity |
Plant Stages |
|
100-200 |
for cuttings |
|
300-500 |
for young rooted plants |
|
700-800 |
for the vegetative stage |
|
800-1000 |
for the stages of flowering and fruiting |
|
1100-1200 |
at the very last stage |
These parameters are cumulative, i.e. clean water + fertilizers applied. Many people use tap water, so the conductivity of water for cuttings often exceeds these limits. Then it is necessary to dilute your water with deionized water (obtained by reverse osmosis or distillate) [24].
If the conductivity in the initial water is up to 300 ppm, then just take the value of the upper limit for each stage (it can be slightly exceeded without much harm). In addition, you will have to mix the original water with clean or filtered water (do not use filtered water or distillate alone, mix with ordinary water).
Some plant species serve as a visual indicator of non-assimilation, with an excess of fertilizers, the tips of the leaves twist down. You should pour out the nutrient solution and start with fresh water and adjusted pH, wait a few days before feeding the plants with fertilizers again.
Plants and their growth can also be influenced by increasing or decreasing the concentration of fertilizers in the solution. The more salt is dissolved, the more difficult it is for the plant to absorb water. If the concentration of salts is raised too much, water will flow from the plant back into the nutrient solution. Adjust the conductivity according to the temperature. In summer (or when the room is hot) plants need to absorb a lot of water. They can be helped by keeping the conductivity at a low level or even below the recommended level. The vigorous movement created by the absorption of water will bring nutrients and roots into contact: the plant will not suffer from insufficiency. Conversely, if the room is cold, it is possible to raise the conductivity to the upper limit of the scale; a small transpiration and a decrease in absorption will cause the need for a stronger solution in order for the plants to receive all the necessary elements [25].
At an early stage of vegetation, if you place a rooted stalk in an environment with a conductivity higher than recommended, you will get a shortened plant with a small interstitial distance. Conversely, if the conductivity is too low, the result will be a slender, elongated plant without a rigid structure. The same pattern happens when the light source is far away or not strong enough, so before increasing the conductivity, make sure that the diagnosis is correct.
At the very end of maturation, you can also experiment with conductivity in order to improve the quality and a little quantity [26].
The limitations when using a hydroponic installation is that we had to grow different types of crops on one installation, since it was only an experimental installation and the amount of nutrients was added according to the average indicators, whereas different crops were planted at different times on the installation. If the seed was not cultivated, then it was necessary to plant the seeds of plants. Whereas, at different stages, the amount of nutrients must be added in different proportions. Also, in case of a power outage, there is a risk of loss of nutrients from the tank due to the pump shutdown.
In general, constant monitoring of pH and ppm values allows you to adjust the values in time and will not allow the plant to get damaged. To regulate the acidity of the working hydroponic solution, solutions of acids are used: nitric, phosphoric, sulfuric and citric and solutions of alkalis: potassium hydroxide, potassium carbonate and baking soda. Optimal acidity values for various crops range from 6.0 to 7.5. To regulate the electrical conductivity, I use fertilizers that are optically presented in nutrient solutions for hydroponics: Flora Bloom, Flora Grow and Flora Agro. If the salt concentration is too high, water will flow out of the plant back into the nutrient solution. We adjust the electrical conductivity depending on the temperature. In summer (or when the room is hot), plants need to absorb a lot of water. They can be helped by maintaining electrical conductivity at a low level or even below the recommended level. Conversely, if the room is cold, it is possible to increase the electrical conductivity to the upper limit of the scale; a small transpiration and a decrease in absorption will cause the need for a stronger solution so that the plants receive all the necessary elements.
In conclusion, it should be noted that the hydroponic device is optimal for growing vegetable plants in regions with unfavorable conditions for plant growth and development, such as the Atyrau region of the Republic of Kazakhstan. Studies on the cultivation of vegetable crops on a hydroponic installation created by students of the Kh.Dosmukhamedov Atyrau University have shown that for plant growth it is necessary to monitor the acidity and electrical conductivity of a container with a mineral solution of a hydroponic device. This analysis allows you to control the content of mineral solutions by maintaining optimal pH and TDS ratios. The acidity of the solution for most vegetable crops should be in the range from 6.0 to 7.0. The electrical conductivity of the mineral solution of the hydroponic device should be in the range from 300 to 1300. Maintaining such indicators contributes to the fact that the correlation between these indicators will be positive and the minerals in the solution will be available for all vegetable crops. In case of an increase in pH and TDS, acid solutions should be added in order to reduce them. If the acidity and electrical conductivity indicators are reduced, then it is necessary to add alkaline solutions. The ratio should be 3 ml per 10 liters of water. Creating optimal conditions allows you to get good results of vegetable crops.
It should be noted that not all cultures react equally to changes in acidity and mineralization. Basically, green crops such as dill and parsley, as well as basil, grow intensively even with increased acidity and TDS, however, taste changes occur, they become bitter and with a decrease in acidity and TDS to optimal indicators, the taste normalizes. Tomatoes and peppers germinate quickly, but over time tomatoes begin to wither, and peppers grow well until flowering, but fruit formation is not observed even with optimal ratios of acidity and a sufficient amount of nutrients. Perhaps the volume of water in which the roots are immersed is insignificant and the roots are not fully comfortable in the device. Cucumber gives good growth and development with the formation of fruits.
These studies allowed us to determine how it is possible to influence plants and their growth by increasing or decreasing the concentration of fertilizers in the solution. The more salt is dissolved, the more difficult it is for the plant to absorb water. Plants will suffer from excessive fertilization or a large amount of nutrients, and a plant that has received an insufficient amount of nutrients will live longer than the first one, but will suffer from a lack of nutrition. Therefore, monitoring of acidity and mineralization indicators allows you to calculate the required amount of nutrients for a hydroponic device. In turn, hydroponics in the future may become the main alternative to traditional agriculture, especially for the Atyrau region of the Republic of Kazakhstan. The depletion and pollution of land is not yet obvious, but the lack of water is already acutely felt in some regions, especially it is very important for the Atyrau region, due to the shallowing of the Ural River. There are about 5 types of soil in Atyrau region, and everyone needs their own cultivation technology. All of them are salty or salty. Therefore, hydroponics is the future, because it can save water and grow plants without soil.
It is necessary to further increase the area of the hydroponic device in order to be able to conduct observations of other plant species. It is also necessary to consider the possibility of using nutrient solutions of other types, including organic solutions. In addition, it is necessary to consider options for using not only hydroponics, but also aeroponics (the process of growing plants in an air environment without using soil, in which nutrients are delivered to the roots of plants in the form of an aerosol) and aquaponics (a high-tech method of farming that combines aquaculture (growing aquatic animals) and hydroponics).
This work is supported financially by the intra-university project of Kh.Dosmukhamedov Atyrau University.
|
pH |
Hydrogen indicator |
|
TDS |
Total Dissolved Solids |
|
STEM |
Science, technology, engineering and mathematics |
[1] Kayan-Fadlelmula, F., Sellami, A., Abdelkader, N., Umer, S. (2022). A systematic review of STEM education research in the GCC countries: Trends, gaps and barriers. International Journal of STEM Education, 9(2): 2. https://doi.org/10.1186/s40594-021-00319-7
[2] Yessenamanova, M.S., Tlepbergenova, A.E., Yessenamanova, Z.S., Gilmanov, E.R. (2020). Analysis of studying ecological education in Kazakhstan, Journal of Physics: Conference Series, 1691: 012036. https://doi.org/10.1088/1742-6596/1691/1/012036
[3] Tauova N., Yessenamanova M., Kossarbay K., Kushakov A.R., Kaliyeva A. (2022). Geological state of the stratigraphic complex of the Tengiz deposit. Series of Geology and Technical Sciences, 5: 249-265. https://doi.org/10.32014/2518-170X.230
[4] Yessenamanova, M.S., Yessenamanova, Z.S., Tlepbergenova, A.E., Abdinov, R.S., Ryskalieva, D.K. (2020). Desertification assessment of the territory of Atyrau region. IOP Conference Series: Earth and Environmental Science, 421: 062005. https://doi.org/10.1088/1755-1315/421/6/062005
[5] Ryskalieva, D., Yessenamanova, M., Koroleva, E.G., Yessenamanova, Z., Tlepbergenova, A., Amanzholkyzy, S., Turekeldiyeva, R. (2022). Monitoring study of the effect of Atyrau evaporation fields on the content of hydrogen sulfide in the air. International Journal of Sustainable Development and Planning, 17(6): 1789-1796. https://doi.org/10.18280/ijsdp.170613
[6] Yessenamanova, M.S., Sangajieva, L.K., Yessenamanova, Z.S., Tlepbergenova, А.Е. (2020). Migratory activity at the landfill site of microelements of the caspian depression. News of the National Academy of Sciences of the Republic of Kazakhstan, Series of Geology and Technical Sciences, 1(439): 155-163. https://doi.org/10.32014/2020.2518-170X.19
[7] Nikolov, N.V., Atanasov, A.Z., Evstatiev, B.I., Vladut, V.N., Biris, S.S. (2023). Design of a Small-Scale hydroponic system for indoor farming of leafy vegetables. Agriculture, 13(6): 1191. https://doi.org/10.3390/agriculture13061191
[8] Saldinger, S.S., Rodov, V., Kenigsbuch, D., Bar-Tal, A. (2023). Hydroponic agriculture and microbial safety of vegetables: Promises, challenges, and solutions. Horticulturae, 9(1): 51. https://doi.org/10.3390/horticulturae9010051
[9] Gevod, V.S., Chernova, A.S., Zhumadulayeva, A.I., Dossybayeva, G.N., Syzdykova, M., Shymelkova, R.Z., Issayeva, A.U. (2022). Buffer effects in submersed denitrifying biofilter. Journal of Ecological Engineering, 23(4): 145-154. https://doi.org/10.12911/22998993/146634
[10] Issayeva, A., Abubakirova, A., Syzdykova, M., Arystanova, S., Anlamasova, G., Zhumakhanova, R., Leska, B. (2022). FE2(SO4)3 and bentonite use to reduce cod indicators in wastewater containing detergents. Journal of Ecological Engineering, 23(3): 68-73. https://doi.org/10.12911/22998993/145468
[11] Kumara, V., Mohanaprakash, T.A., Fairooz, S., Jamal, K., Babu, T., Sampath, B. (2023). Experimental study on a reliable smart hydroponics system. In: Human Agro-Energy Optimization for Business and Industry, IGI Global, pp. 27-45. https://doi.org/10.4018/978-1-6684-4118-3.ch002
[12] Yehia, H.M., Said, S.M. (2021). Drinking water treatment: PH adjustment using natural physical field. Journal of Biosciences and Medicines, 9(6): 55-66. https://doi.org/10.4236/jbm.2021.96005
[13] Walton, N.R.G. (1989). Electrical conductivity and total dissolved solids—What is their precise relationship? Desalination, 72(3): 275-292. https://doi.org/10.1016/0011-9164(89)80012-8
[14] Damilya, R., Yessenamanova, M., Syrlybekkyzy, S., Koroleva, E.G., Yessenamanova, Z., Tlepbergenova, A., Izbassarov, A., Turekeldiyeva, R. (2023). Environmental assessment of the impact of atmospheric air pollution with hydrogen sulfide on the health of the population of Atyrau, Republic of Kazakhstan. International Journal of Sustainable Development and Planning, 18(7): 2199-2206. https://doi.org/10.18280/ijsdp.180724
[15] Dirisu, C.G., Mafiana, M.O., Dirisu, G.B., Amodu, R. (2016). Level of pH in drinking water of an oil and gas producing community and perceived biological and health implications. European Journal of Basic and Applied Sciences, 3(3): 53-60.
[16] Yessenamanova, M.S., Kulzhanova, G., Tlepbergenova, A.E., Yessenamanova, Z.S., Batyrbayeva, G. (2021). Environmental monitoring of water quality in the interstate Ural River. Journal of Physics: Conference Series, 1889(3): 032007.
[17] Yessenamanova, M.S., Bissenov, U.K., Nurgazy, K.S., Dyussegaliyev, M.Z., Makhambet M. (2021). Physical and chemical properties of soils and plant biology of the territory of Atyrau region. AIP Conference Proceedings, 2402: 060002.
[18] Issayeva, A., Myrzabayeva, Z., Kidirbayeva, K., Ibragimov, T., Baitasheva, G., Tleukeyeva, A. (2022). Reaction of aquatic plants of small rivers of the Turkestan region of Kazakhstan to heavy metal ions. Journal of Ecological Engineering, 23(6): 43-49. https://doi.org/10.12911/22998993/147838
[19] Rusydi, A.F. (2018). Correlation between conductivity and total dissolved solid in various type of water: A review. IOP Conference Series: Earth and Environmental Science, 118: 012019. https://doi.org/10.1088/1755-1315/118/1/012019
[20] Taylor, M., Elliott, H.A., Navitsky, L.O. (2018). Relationship between total dissolved solids and electrical conductivity in Marcellus hydraulic fracturing fluids. Water Science & Technology, 77(7-8): 1998-2004. https://doi.org/10.2166/wst.2018.092
[21] Baimukasheva, S., Issayeva, A.U., Antkowiak, W., Aitimova, A., Altybayeva, Z., Syrlybekkyzy, S., Suleimenova, B., Koishina, A. (2023). The influence of abiotic factors on organisms-hydrobionts of activated sludge. Journal of Ecological Engineering, 24(10): 125-133. https://doi.org/10.12911/22998993/170165
[22] Manher, M.F., Mohammed, H.A., Jaaz, H.A.G., Naser, A.F., Mohammed, A.A. (2023). Structural performance evaluation of reinforced concrete anaerobic digester tank in sewage treatment plant: Investigational and theoretical study. International Journal of Sustainable Development and Planning, 18(7): 2079-2088. https://doi.org/10.18280/ijsdp.180710
[23] Wicaksono, I.T., Nurwidayati, R. (2022). The effect of pH water on the concrete mixtures and curing condition on the compressive strength of concrete. IOP Conference Series: Earth and Environmental Science, 999: 012006. https://doi.org/10.1088/1755-1315/999/1/012006
[24] Al Dahaan, S.A.M., Al-Ansari, N., Knutsson, S. (2016). Influence of groundwater hypothetical salts on electrical conductivity total dissolved solids. Engineering, 8(11): 823-830. https://doi.org/10.4236/eng.2016.811074
[25] Wright, K.F. (2015). Is your drinking water acidic? A comparison of the varied pH of popular bottled waters. Journal of Dental Hygiene, 89(suppl 2): 6-12.
[26] Yessenamanova, M., Lukyanets, A., Golovina, E., Topornin, N. (2022). Environmental auditing: The EU practice in the context of pursuing sustainable development policy. European Energy and Environmental Law Review, 31(4): 211-222. https://doi.org/10.54648/eelr2022015