Zuryati Djafar*![]() | Andi Ardi Arman | Asriadi Sakka
| Andi Ardi Arman | Asriadi Sakka![]() | Mustofa
| Mustofa![]() | Faisal Mahmuddin
| Faisal Mahmuddin![]() | Syerly Klara | Nurlaela Rauf
| Syerly Klara | Nurlaela Rauf![]() | Wahyu Haryadi Piarah
| Wahyu Haryadi Piarah![]()
© 2023 IIETA. This article is published by IIETA and is licensed under the CC BY 4.0 license (http://creativecommons.org/licenses/by/4.0/).
OPEN ACCESS
Given Indonesia's average atmospheric humidity of 75% to 85%, this study explores the potential of atmospheric air as an alternative clean water source to mitigate water shortage. The research employs a thermoelectric cooler (TEC 1-12706), supplemented with a heatsink and fan on its hot side to enhance heat dissipation. A copper-made cooling coil serves as both a heat absorber and a condenser for atmospheric air passing through it. The cooling source for the coil (diameter=7.9mm; length=1000mm) is derived from a waterblock attached to the cooler's cold side. Experiments were conducted across three environmental conditions: laboratory, residential area, and coastal area, with the air flow rate of the heatsink cooling fan varied. Data collection spanned a humidity range of 72.27%-83.01%. Findings revealed a direct correlation between the air mass flow rate of the heatsink cooling fan and the amount of water extractable from the air. In initial testing at the Laboratory, at a mass flow rate of 0.046 kg/s it produced 4.25 ml/hour and at 0.069 kg/s it produced 4.625 ml/hour and at 0.092 kg/s it produced 5.5 ml/hour. Furthermore, from the three environmental conditions tested, more water can be extracted on the coast than in laboratories and residential areas. In coastal areas, the air mass flow rate is 0.092 kg/s, water that could be extracted is 7.75 ml/hour, while in the laboratory environment it is 5.5 ml/hour and in residential areas it is 4.75 ml/hour. These promising results encourage further research to augment water extraction by maximizing the contact surface between the air cooler and the coil surface, potentially offering a viable solution for clean water shortage.
water condensation rate thermoelectric module, atmospheric water harvesting, air cooling and condensation
Water, a fundamental necessity for all life forms, is derived from varied sources contingent on local conditions and regions [1]. Its importance escalates as living conditions evolve [2, 3]. Despite its abundant water resources, with an availability of 15,500 cubic meters per capita per year, surpassing the global average of 8,000 cubic meters per year, Indonesia grapples with clean water shortage [4, 5].
Approximately 19% of Indonesia's 270 million inhabitants reside in urban areas, with a mere 39% accessing clean, state-provided piped water. Rural areas fare worse, with only 5% utilizing a piped system, 48% resorting to non-piped systems, and the remaining 47% dependent on dug wells and unprotected water sources [6].
Given Indonesia's average atmospheric humidity of 75% to 85%, the abundant water vapor presents an innovative clean water source. With an average temperature of 27.2℃, the potential for atmospheric water vapor extraction is high [7]. Consequently, research into atmospheric water vapor condensation may offer an effective solution to the global water shortage.
One way to condense water vapor from the atmosphere is to use a thermoelectric cooler (TEC) [8]. The working principle of TEC as a water cooler has been carried out by Djafar et al. [9, 10] and recently Kiran and Prakash [11].
Several studies related to the utilization of TEC elements have been carried out, among others; Baheramsyah et al. [8] conducted research on a lifeboat by making a set of tools for producing fresh water from air based on TEC and obtaining 53 ml/hour of clean water. Prasetyo and Wirenda [12] have also examined the use of TEC elements in combination with a waterblock and heatsink as a heat absorption and release system on both sides of the TEC elements.
Interesting research has been carried out by Riahi et al. [13] in designing and testing fresh water condensation components from atmospheric air in tropical conditions at the University of Science Malaysia campus environment using 18 TEC modules with 18 heat sinks and 18 cooling fan units on observations 24 and 48 o'clock. The results show that the value of clean water production is proportional to the relative humidity of the air, but inversely proportional to the ambient temperature. Night conditions are best for fresh water. The test results produce approximately 3.5 liters of clean water for 24 hours and 7 liters in 48 hours with clean water quality according to WHO standards.
This study aims to evaluate the performance of the TEC element as the primary cooling component in the air condensation process, to determine the amount of clean water that can be obtained from a prototype placed in tropical conditions in the Gowa Regency, Indonesia. Unlike previous research [13] which conducted data collection solely in a campus environment, this investigation encompasses three locations: a university campus, residential areas, and the coast. This expanded scope will provide a more comprehensive understanding of diverse areas and atmospheric conditions.
The effectiveness of a tool, defined as its ability to achieve maximum results, can be determined by comparing the results obtained from testing and the theoretical calculations. The following are the formulas used in this study to obtain the effectiveness of the model:
1.1 Effectiveness
The effectiveness of AWG is obtained by comparing theoretical water with actual water. Theoretical Water is a measure of the amount of water expected to be obtained using calculations and actual water is the water obtained during the data collection process.
Theoretical Water can be calculated by the following equation:
Theoretical Water $=\dot{m}\left(w_{\text {in }}-w_{\text {out }}\right)$ (1)
where, win is the moisture ratio of incoming air and wout is the moisture ratio of the outgoing air.
Effectiveness can be calculated using the equation:
$\varepsilon=\frac{\textit { Actual } \textit { Water }}{\textit { Theoretical water }} 100 \%$ (2)
where, Actual Water is Water obtained during data collection (ml/hour), Theoretical Water is Water obtained by calculation (ml/hour) and $\mathcal{E}$ is Effectiveness (%).
1.2 Intake air mass flow rate
Incoming air mass flow rate is a measure of the mass of air entering the AWG device per unit time [14]:
$\dot{m}=\frac{v A}{V}$ (3)
where, $\dot{m}$ is the inlet air mass flow rate (kg/s), V is the specific volume of air (m3/kg), A is the inlet area (m2) and ν is the inlet air velocity (m/s).
1.3 Intake and exit air conditions
Important parameters of the condition of the incoming and outgoing air are a measure to show the specifications/ properties of the air, both entering and leaving the AWG tool, namely Partial Pressure of water vapor, Relative Humidity, and Humidity Ratio.
The partial pressure of water vapor is calculated by the following equation [15]:
$\mathrm{Ps}=P j w b-0.5 (T d b-T w b) \frac{P t}{755}$ (4)
where, Pjwb is Wet bulb saturated vapor pressure (mmHg or kPa), Ps is Partial pressure of water vapor (mmHg or kPa), Tdb is Dry bulb temperature (℃), Twb is Wet bulb temperature (℃), and Pt is pressure atmospheric air (mmHg or kPa).
Relative Humidity is calculated by the equation [16]:
$R H=\frac{P S}{P j d b}$ (5)
where, Pjdb is the dry bulb saturated water vapor pressure (mmHg or kPa), Ps is the partial pressure of water vapor (mmHg or kPa), RH is Relative Humidity (%).
The Humidity Ratio is calculated by:
$w=0.622 \frac{P s}{P t-P s}$ (6)
where, Ps is Saturated vapor pressure (mmHg/kPa), Pt is air pressure (mmHg or kPa), w is Humidity Ratio.
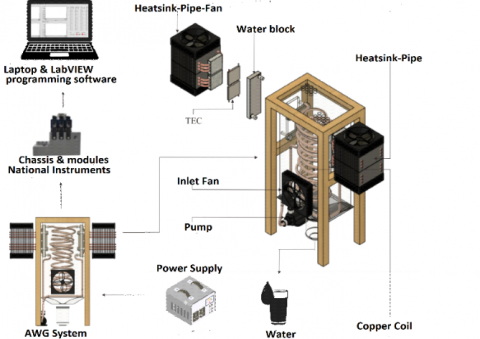
Figure 1 shows a prototype of the Atmospheric Water Generator. As a cooler, a thermoelectric cooler (TEC) is used where the cold-side to cools the water block (WB) and the hot side is cooled by a heatsink equipped with a fan (TEC used is type TEC 1-12706 with dimension of 4mm×4mm×0.4mm; the WB dimension used is 120mm×40mm×12mm and made of Aluminum material; Heatsink dimensions are 97mm×73mm×135mm, with a 6mm heatpipe diameter of 4 rods; Fan dimensions are 90mm×90mm×25mm with maximum input voltage-current 12V-0.18A). Cold water on the WB is circulated through a cooling coil (7.9mm in diameter and 1000mm in length) using a pump. This cooling coil (made of copper material) functions to condense water vapor in the air that enters the AWG and the condensate is accommodated in a reservoir. In this study, the Thermoelectric Cooler was placed on two sides of the AWG as shown in Figure 1.
Figure 1. Schematic of the atmospheric water generator (AWG) condensation system
The number of modules used on each side is the same. The number of modules on each side is varied as follows: 2 single module (SM), 2 stacked two/double modules (DM) and 2 stacked three modules (TM). Furthermore, the fan air speed for the heatsink is also varied respectively 12 m/s or equivalent to a mass flow rate of 0.092 kg/s, 9 m/s with a mass flow rate of 0.069 kg/s and 6 m/s with a mass flow rate of 0.046 kg/s. Air velocity changes are made by changing the input voltage to the fan and are measured using an anemometer.
The test data taken is the temperature of the cold side of the TEC module, the temperature of the hot side of the TEC module, the temperature of the heatsink-fan, the inlet air temperature (both TWB wet air temperature and TDB dry air temperature), air temperature leaving the condensation chamber (TWB & TDB), waterblock temperature, water temperature leaving the waterblock, condensation room temperature, cooling coil wall temperature, ambient air temperature (laboratory, residential area, and coast), condensate volume (water produced).
Data collection was carried out by acquisition with the help of the LabVIEW software program [17]. The duration of data collection was carried out for 240 minutes. The test was repeated three times to get valid results.
From the test results and data analysis, several test parameters were obtained which became indicators of the success of this study, namely TEC Cold Side Temperature, Condensation Chamber Temperature, Air Relative Humidity (RH), Condensed Water Volume, and AWG efficiency.
3.1 Temperature of the cold and hot sides of the TEC module
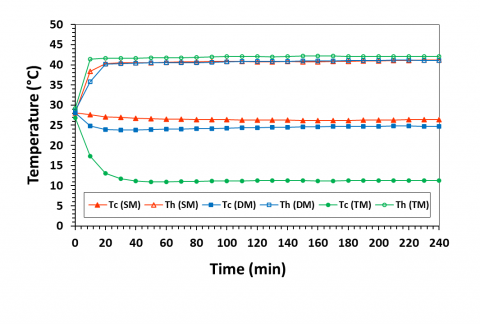
Figure 2 shows the temperature of the cold side and hot side of the TEC module on the AWG system in a laboratory environment with a test duration of 240 minutes with a cooling fan air mass flow rate of 0.092kg/s. The TEC cold side and hot side temperature graphs have remained constant since the 20th minute. The temperature difference between the hot and cold sides for single and double modules is only around 15℃ while for triple modules it reaches 31℃. This is because the triple module requires a higher voltage to achieve a minimum cold side temperature. Experimental shows that each module requires a voltage of about 4 Volts to reach the best cold side temperature. For SM, the best voltage is 16V, DM is 30V, and TM is 50V.
Figure 2. History cold side and hot side temperatures for three variations of the TEC module series with a duration of 240 minutes in laboratory environment conditions
The cold side temperature of the TEC module is an important parameter (initial indicator) of the success of this study. Initial testing was carried out in the laboratory area. The single module (SM) and dual module (DM) have temperatures on the cold side which are still above 25℃ so it is difficult to expect condensation of atmospheric air, while the triple module (TM) can already reach 10℃. In this study the best fan air speed occurs at an air speed of 12 m/s or equivalent to a mass flow rate of 0.092 kg/s. Increasing the air speed of the fan will increase the convection coefficient which will ultimately increase the rate of heat release on the heatsink. Henceforth the results shown are only for a mass flow rate of 0.092 kg/s.
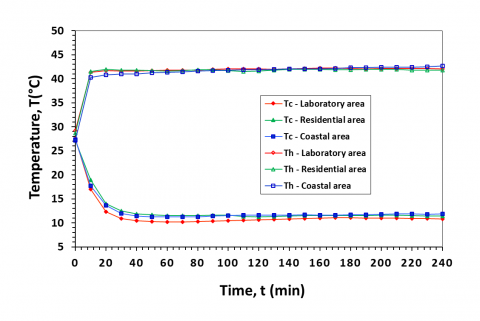
Figure 3. History of temperature on the cold side and hot side of the triple TEC module with three different environmental conditions
Figure 3 shows the difference in cold side and hot side thermoelectric cooler (TEC) temperature values for the triple Module at a mass flow rate of 0.092 kg/s in three environmental variations: laboratory, residential, and coastal areas. The lowest temperature of the cold side TEC and the highest temperature of the hot-side TEC were obtained in the laboratory environment. The cold-side TEC temperatures in the laboratory, residential areas, and coastal areas are 10.693℃, 11.674℃ and 11.690℃ and the hot-side TEC temperatures are 41.988℃, 41.815℃ and 41.865℃. It appears that the cold side temperature is low enough to cool the waterblock.
3.2 Temperature in the waterblock and cooling coils of the AWG system for three environmental conditions
In addition to the temperature on the cold side of the TEC module, it is also necessary to pay attention to the temperature of the copper coil cooling water coming from the Water block (WB). Figure 4 shows the temperature of the WB and the cooling coil for 240 minutes in three variations of the environment: laboratory, residential area, and the coast using a triple module (TM) and a heatsink cooling fan fluid flow rate of 0.092kg/s. As seen in the graph, the temperature of the WB and the cooling coil has been constant since the 20th minute and the temperature for each environment is relatively the same. The temperatures for laboratories, residential areas, and coastal areas are 14.871℃, 14.912℃ and 14.986℃ in the water block (WB) and 15.393℃, 15.313℃ and 15.321℃ in the cooling coil. This shows that the temperature of the fluid from WB to the cooling coil has only increased slightly and the temperature of the cooling coil is still low enough to produce condensation of atmospheric air.
Figure 4. History of waterblock and cooling coil temperatures on the three environmental conditions: Laboratory, residential area & coastal areas
3.3 Temperature in the condensing chamber of the AWG system for three environmental conditions
The cooling coil is useful for cooling the air so that condensation occurs. Figure 5 displays the ambient temperature and the condensing chamber for 240 minutes in three environmental variations: laboratory, residential area, and the coast for the triple module (TM) with a heatsink cooling fan mass flow rate of 0.092kg/s. As seen in the graph, the temperature of the condensing chamber has been constant since the 20th minute. The condensing chamber temperatures are 21.077℃, 21.225℃ and 21.434℃. And the average ambient temperature is 29.168℃, 30.009℃ and 29.953℃. The presence of a cooling coil causes a decrease in ambient air temperature when it enter the condensation chamber of around 9℃.
Figure 5. Temperature of the environment and condensation room on the three environmental conditions: Laboratory, residential area & coastal areas
Figure 5 shows the temperature of the environment and the condensing chamber for 240 minutes in 3 variations of the environment: laboratory, residential area, and the coast for the triple module (TM) with a heatsink cooling fan fluid flow rate of 0.092kg/s. As seen in the graph, the temperature of the condensing chamber has been constant since the 20th minute. The condensing chamber temperatures are 21.077℃, 21.225℃ and 21.434℃. And the average ambient temperature is 29.168℃, 30.009℃ and 29.953℃. The decrease in ambient air temperature after entering the condensation chamber is around 9℃.
3.4 Volume of generated condensate
The condensation process will produce water droplets from the air. Figure 6 shows the volume of water obtained in 240 minutes at laboratory conditions for three variations in the number of thermoelectric cooler (TEC) module arrangements, namely single module (SM), double modules (DM), and Triple modules (TM) with three variations of the mass flow rate of the heatsink cooling fan is 0.046kg/s, 0.069kg/s, and 0.092kg/s. As shown in Figure 6, the SM and DM circuits do not produce water. Furthermore, in the TM circuit with three variations of the cooling fan mass flow rate of 0.046kg/s, 0.069kg/s, and 0.092kg/s it produced 17ml, 18.5ml and 22ml of water respectively. The increase in the amount of water produced is in line with the increase in the cooling rate.
Figure 6. Water volume for a test duration of 240 minutes in the laboratory as initial data collection
In the single module (SM) and double modules (DM) series, the cooling coil temperature is still quite high, which is more than 25℃ (see Figure 2) so that there is no condensation yet in the air. If the air temperature is still above the dewpoint temperature then the condensation process has not occurred. Furthermore, in the triple modules (TM) it can be seen that the highest volume of water is obtained from the mass flow rate of the heatsink cooling fan of 0.092kg/s, which is 22ml.
3.5 Comparison of water volume, RH and equipment effectiveness with a test duration of 240 minutes
Figure 7 shows a comparison of the volume of water for three different environmental conditions with a test duration of 240 minutes on a series of TEC triple modules with the best air mass flow rate of 0.092kg/s. Seen in Figure 7, the volume of water obtained in a laboratory environment is 22 ml with an effectiveness of 4.24% and RH 77.27%, in a residential area 19 ml with an effectiveness of 4.78% and RH 75.39% and in a coastal environment as much as 31 ml with an effectiveness of 5.035% and RH 82.62%. The highest water production value occurs on the coast because it has the highest RH value. In other words, it has a greater water content.
Figure 7 shows that the largest amount of water is obtained in the coastal environment with the highest relative humidity and the best effectiveness.
From the test results, it was obtained that the largest amount of water (condensate) was produced with a series of three stacking modules (TM) and a mass flow rate of 0.092 kg/s cooling fan of 31 ml with a relative humidity (RH) of 82.619% and was in the coastal area. To increase the water recovery can be done by increasing the scale of the cooling area which in this case is 0.0064 m2. In addition, this can also be done by increasing the contact surface of the cooling coil with the passing air.
Although only using 12 TEC modules, the volume of condensate water produced in this study was larger (31 ml in 2 hours) than the optimal figure of 9.335 ml in 24 hours by Riahi et al. [13] with 18 TEC modules.
The 31ml water produced in this study contributed to supporting WHO standard fresh water supplies [18] and several countries in the world [19-22], as the implementation of TEC modules that are beneficial to humans [23-26].
Figure 7. The volume of water for testing for 240 minutes in three environmental conditions: Laboratory area, residential area and coastal area
From the tests carried out, it can be concluded that the mass flow rate in the heatsink cooling fan on the hot side of the thermoelectric cooler (TEC) is directly proportional to the production of water, which from laboratory tests for three speed variations is 0.046kg/s, 0.069kg/s and 0.092 kg/s produces water 4.25ml/hour, 4.625ml/hour and 5.5ml/hour respectively. Furthermore, for three variations of location: laboratory, residential area and coastal area, the amount of water is 5.5 ml/hour, 4.75 ml/hour and 7.75 ml/hour respectively. The highest value of water production is obtained on the coast.
Opportunities are still open to increase the amount of water obtained by looking for the optimum contact factor between the air and the surface of the cooling coil.
The author would like to thank the Chancellor of Hasanuddin University who has funded this research through the Unhas Collaborative Fundamental Research scheme.
|
A |
Inlet area, m2 |
|
Pjdb |
Dry bulb saturated water vapour pressure, mmHg |
|
Pjwb |
Wet bulb saturated water vapor pressure, mmHg |
|
Ps |
Partial pressure of water vapor, mmHg |
|
Pt |
Pressure atmospheric air, mmHg |
|
RH |
Relative Humidity, % |
|
Tdb |
Dry bulb temperature, ℃ |
|
Twb |
Wet bulb Temperature, ℃ |
|
w |
Humidity ratio |
|
win |
Humidity ratio of incoming air |
|
wout |
Humidity ratio of outgoing air |
|
V |
Spesifik Volume, m3/kg |
|
v |
Inlet air Velocity, m/s |
|
Greek symbols |
|
|
ε |
Effectiveness |
|
$\dot{\mathrm{m}}$ |
Air mass flow rate, kg/s |
|
$k$ |
Thermal Conductivity, W. m-1. K-1 |
|
Subscripts |
|
|
AWG |
Atmospheric Water Generator |
|
SM |
Single Module |
|
DM |
Double Module |
|
TM |
Triple Module |
|
TEC |
Thermoelectric Cooler |
|
WB |
Water Block |
[1] Mashuri, M., Fauzi, M., Sandhyavitri, A. (2015). Study of the availability and demand of raw water with Ihacres modeling in the Tapung Kiri River Basin. Jurnal Online Mahasiswa (JOM) Bidang Teknik dan Sains, 2(1): 1-12. https://jom.unri.ac.id/index.php/JOMFTEKNIK/article/view/6245.
[2] Kilic, Z. (2020). The importance of water and conscious use of water. International Journal of Hydrology, 4(5): 239-241. https://doi.org/10.15406/ijh.2020.04.00250
[3] Unicef Handbook on Water Quality. (2008). United Nations Children's Fund (UNICEF), New York. https://www.unicef.org/media/91301/file/Handbook-Water-Quality.pdf.
[4] Kardono, K. (2007). Condition of water resource in Indonesia and its environmental technology. Jurnal Air Indonesia (JAI), 3(2): 2331. https://doi.org/10.29122/jai.v3i2.2331
[5] Tortajada, C., Biswas, A.K. (2018). Achieving universal access to clean water and sanitation in an era of water scarcity: Strengthening contributions from academia. Current Opinion in Environmental Sustainability, 34: 21-25. https://doi.org/10.1016/j.cosust.2018.08.001
[6] The climate in Indonesia. World Data. https://www.worlddata.info/asia/indonesia/climate.php, accessed on Aug. 9, 2023.
[7] Joshi, V.P., Joshi, V.S., Kothari, H.A., Mahajan, M.D., Chaudhari, M.B., Sant, K.D. (2017). Experimental investigations on a portable fresh water generator using a thermoelectric cooler. Energy Procedia, 109: 161-166. https://doi.org/10.1016/j.egypro.2017.03.085
[8] Baheramsyah, A., Prananda, J., Setiyawan, D. (2019). The experiment of producing freshwater from the air using thermoelectric cooler for the need of dringking water in a lifeboat. International Journal of Marine Engineering Innovation and Research, 4(1): 68-73. https://diving-rov-specialists.com/index_htm_files/vd_58-the-experiment-of-producing-freshwate-from-air.pdf.
[9] Djafar, Z., Amrullah, A., Wahyu, H.P., Sukri, H. (2014). Experimental test of thermoelectric performance on the dispenser cooler. In Proceeding of the 1st International Symposium on Smart Material and Mechatronics, Gowa, Sulawesi Selatan, Indonesia. https://www.researchgate.net/publication/365295107_2014-Experimental_Test_of_Thermoelectric_Performance_on_the_Dispenser_Cooler.
[10] Djafar, Z., Wahyu, H.P., Alwi. (2016). Heat pipe application in cool boxes based on non branded pertier elements. In Proceedings of the 8th AVOER National Seminar, Palembang, Indonesia. https://www.researchgate.net/publication/362225153_Aplikasi_Heat_Pipe_pada_CoolBox_berbasis_Elemen_Peltier_non_Branded.
[11] Kiran, P.S., Prakash, S.B. (2022). Performance evaluation of thermoelectric cooler. Lecture Notes in Mechanical Engineering book series (LNME). https://doi.org/10.1007/978-981-19-3498-8_10
[12] Prasetyo, B.Y., Wirenda, S.A. (2021). Thermoelectric experimental study as a cooling system alternative. In Proceedings of the 12th Industrial Research Workshop and National Seminar (IRWNS), Bandung State Polytechnic. https://doi.org/10.35313/irwns.v12i0
[13] Riahi, A., Zakaria, N.A., Noh, N.M., Amin, M.Z.M., Jusoh, A.M., Ideris M.M., Zainol, M.R.R.M.A., Shaharuddin, S., Yusof, M.F. (2021). Performance investigation of 18 thermoelectric cooler (TEC) units to supply continuous daily fresh water from Malaysia’s atmosphere. Sustainability, 13(3): 1-16. https://doi.org/10.3390/su13031399
[14] Cengel, Y.A. (2004). Heat Transfer: A Practical Approach. McGraw-Hill, New York.
[15] Arismunandar, W., Saito, H. (2005). Air Conditioning. Pradnya Paramita, Jakarta.
[16] Stoecker, W.F., Jones, J.W. (1982). Refrigeration and Air Conditioning. MacGraw-Hill, New York.
[17] Djafar, Z., Salsabilah, A.Z., Piarah, W.H. (2021). Performance comparison between hot mirror and cold mirror as a beam splitter on photovoltaic-thermoelectric generator hybrid using labview simulator. International Journal of Heat and Technology, 39(5): 1609-1617. https://doi.org/10.18280/ijht.390524
[18] World Health Organization. (2012). Global Costs and Benefits of Drinking-Water Supply and Sanitation Interventions to Reach the MDG Target and Universal Coverage. WHO Press, Geneva, Switzerland. https://apps.who.int/iris/bitstream/handle/10665/75140/WHO_HSE_WSH_12.01_eng.pdf.
[19] Pál, L., Jenei, T., McKee, M., Kovács, N., Vargha, M., Bufa-Dőrr, Z., Muhollari, T., Bujdosó, M.O., Sándor, J., Szűcs, S. (2022). Health and economic gain attributable to the introduction of the World Health Organization's drinking water standard on arsenic level in Hungary: A nationwide retrospective study on cancer occurrence and ischemic heart disease mortality. Science of The Total Environment, 851: 158305. https://doi.org/10.1016/j.scitotenv.2022.158305
[20] Venkatesan, A.K., Lee, C., Gobler, C.J. (2022). Hydroxyl-radical based advanced oxidation processes can increase perfluoroalkyl substances beyond drinking water standards: Results from a pilot study. Science of the Total Environment, 847: 157577. https://doi.org/10.1016/j.scitotenv.2022.157577
[21] de Oliveira, D.M., Agostinetto, L., Siegloch, A.E. (2023). Comparison of the drinking water standard for pesticides of the Brazil with other countries. Heliyon, 9(3): e13783. https://doi.org/10.1016/j.heliyon.2023.e13783
[22] He, W., Yu, P., Hu, Z., Lv, S., Qin, M., Yu, C. (2019). Experimental study and performance analysis of a portable atmospheric water generator. Energies, 13(1): 73. https://doi.org/10.3390/en13010073
[23] Tan, F.L., Fok, S.C. (2013). Experimental testing and evaluation of parameters on the extraction of water from air using thermoelectric coolers. Journal of Testing and Evaluation, 41(1): 96-103. https://doi.org/10.1520/JTE20120105
[24] Muñoz-García, M., Moreda, G., Raga-Arroyo, M., Marín-González, O. (2013). Water harvesting for young trees using Peltier modules powered by photovoltaic solar energy. Computers and Electronics in Agriculture, 93: 60-67. https://doi.org/10.1016/j.compag.2013.01.014
[25] Liu, S., He, W., Hu, D., Chen, D., Wu, X., Xu, F., Li, S. (2017). Experimental analysis of a portable atmospheric water generator by thermoelectric cooling method. Energy Procedia, 142: 1609-1614. https://doi:10.1016/j.egypro.2017.12.538
[26] Su, C., Wang, Z., Liu, X., Xiong, X., Jiang, T., Wang, Y. (2022). Research on thermal comfort of commercial vehicle and economy of localized air conditioning system with thermoelectric coolers. Energy Reports, 8: 795-803. https://doi.org/10.1016/j.egyr.2022.10.153