Paúl Carrión-Mero*![]() | Joselyne Solórzano
| Joselyne Solórzano![]() | Karla Ayala Cabrera
| Karla Ayala Cabrera![]() | Bill Vera-Muentes
| Bill Vera-Muentes![]() | Josué Briones-Bitar
| Josué Briones-Bitar![]() | Fernando Morante-Carballo
| Fernando Morante-Carballo![]()
© 2023 IIETA. This article is published by IIETA and is licensed under the CC BY 4.0 license (http://creativecommons.org/licenses/by/4.0/).
OPEN ACCESS
Special Economic Zones (SEZs) facilitate heightened free trade logistics, enabling companies to expand their operations and product development within a nation. This study seeks to geomechanically characterise a pilot area within the Special Economic Zone Development Zone (ZEDE) at ESPOL Polytechnic University, Ecuador. The area has been marked by limited information concerning the geotechnical properties of the soil and rock formations. The goal of the study is to inform referential zoning for constructions, thereby fostering sustainable development of businesses and industries in the area. The methodology utilised in this study was threefold: (i) an inquiry into existing data and an on-site inspection, (ii) a geophysical campaign encompassing Vertical Electrical Soundings, seismic refraction, and geotechnical characterisation for result correlation, and (iii) an assessment of slope stability, on-site response spectrums, soil profile classifications, safety factors, and construction risk zoning. The study area, approximately 28 ha, was characterised by soils and rock formations, such as lapilli tuffs and tuffaceous shales, with resistive loads reaching up to 26.10 MPa. These geotechnical attributes permit the construction of structures exceeding four stories. The integration of geological and geotechnical data revealed that 75% of the study area presents low to medium construction risk related to instability, thereby indicating suitable areas for territorial planning. The methodology proposed in this study provides a replicable tool for application across the ZEDE, facilitating the creation of strategies for a land-use plan within an innovative university campus. Future large-scale studies could incorporate hydrogeological analysis, evaluation of environmental impact, and the development of mitigation plans for anthropogenic activities.
geomechanics evaluation, special economic zones, seismic refraction, geoelectric, slope stability, territorial planning, land use
Geotechnics, a critical field in engineering, serves as the primary safeguard against infrastructural damage and ensures human safety [1, 2]. Influential conditioning factors, such as lithology and the physical-mechanical properties of rocks and soils, coupled with triggering events like earthquakes and rainfall, directly impact the lifespan of structures [3]. Hence, the execution of meticulous geomechanical characterisation studies is necessitated to discern the geotechnical properties of materials and to demarcate areas conducive for construction [4], in accordance with prevailing international construction regulations [5]. Yet, despite technological advancements, field data collection and the implementation of geotechnical tests pose significant challenges concerning cost and time, underscoring the essentiality of employing indirect methods for soil exploration via geophysics [6].
Geophysical techniques, being non-invasive, facilitate access to hard-to-reach areas, thereby extending the study area and enabling the detection of groundwater and geological structures [7]. These techniques yield prompt results and offer a comprehensive view of subsurface geometry based on physical properties ascertained from surface measurements [8].
An integrated analysis correlating geophysical and geotechnical research enhances soil property characterisation [9, 10]. This comprehensive analysis fortifies the outcomes derived from soil property studies, aiding in the identification of optimal areas for infrastructure foundations [11-13]. Several studies have underscored the importance of correlating geotechnical and geophysical data in construction projects (e.g., [14-17]). An in-depth characterisation, in turn, equips professionals with the critical information required for designing functional and economical foundations and infrastructures [18].
The surge in economic growth and urban development has amplified the need for industry and design studies in land-use planning, necessitating substantial investments and logistics. Special Economic Zones (SEZs) are designated geographical areas within a country, subject to customs controls, where companies catering to external markets are permitted to set up operations [19]. These zones, often incorporating ports or land areas, are independently supervised and equipped with the highest level of free trade logistics and preferential policies [20]. The selection and design of a free trade zone (FTZ) to stimulate regional economic growth entails careful planning and territorial ordering [21] through soil characterisation and geotechnical studies to facilitate various infrastructure constructions. As of 2018, approximately 2300 free zones were registered worldwide, attracting investments, fuelling industry growth, fostering knowledge transfer, and creating jobs [22].
In Ecuador, ESPOL University's Special Economic Zone (Guayaquil), inaugurated on 18 April 2017 [23], has been categorised as a Special Economic Development Zone (ZEDE), exempt from taxes. ESPOL spans 691 hectares (ha), with 243 ha dedicated to the Prosperina protected forest [24] and 133 ha earmarked for ZEDE implementation. As of 2019, the area is home to Bioconversión S.A., a company specialising in preserving fruits, vegetables, and specialised foods [25]. A methodological approach is necessitated to determine soil conditions and ensure land stability, ensuring the safety of future infrastructure and the success of territorial development plans. The study area serves as a pilot test, providing valuable insights for the foundations and structures. Future studies may encompass the entire ZEDE area and serve as a replicable model at national and international levels.
The following research question has been raised through the correlation of existing geophysical and geotechnical data obtained from field tests: How can we efficiently analyse terrain with geophysical and geotechnical information to characterise a free zone that allows territorial planning? To answer this question, the following objective is proposed: Geotechnically characterise a ZEDE pilot area in ESPOL-Ecuador, through the correlation of geophysical and geotechnical information for comprehensive geomechanical analysis that allows zoning under safety criteria for buildings construction.
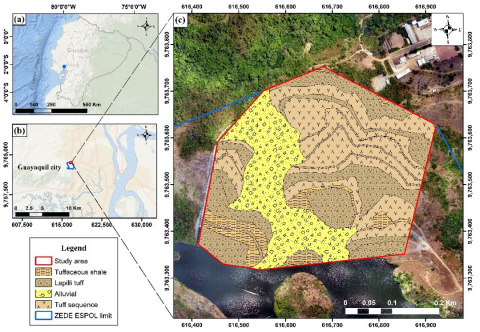
ZEDE is in the northwest of the city of Guayaquil, Ecuadorian Coast region (Figure 1(a) and (b)), with an approximate area of 133 ha, the selected study area, within the ZEDE, is 16.20 ha (Figure 1(b) and (c)). This area was selected because it brings together several components that make the sustainable development of companies and industries possible (e.g., the existence of an artificial rainwater lake, road accessibility, and adaptation of electrical and sanitary infrastructure). Moreover, previous geomorphological studies corroborate elevation changes of approximately 30 m, with slopes of roughly 14-25 degrees [26-29].
The study area belongs to the Upper Cretaceous Cayo Formation, outcropping in the Chongon-Colonche Mountain range. This formation is made up mainly of marine sediments; at the base volcaniclastic rocks outcrop and towards the top, the lithology varies with the presence of sequence with intercalations of tuffaceous shales, agglomerates and fine to medium-grained sandstones [30-33]. The local geology shows the existence of alluvial deposits, sequence of tuffs, tuffaceous shale, and lapilli tuff (Figure 1(c)).
Figure 1. (a) Ecuador’s geopolitical map, (b) Study’s area location, (c) Geological map of the study area [28, 30, 31]
The methodological approach focuses on analysing the foundation and construction conditions based on geological and geophysical data, combined with stability analysis of the land's natural slope for zoning that allows correct decision-making in planning the territory of the study zone. The methodology consisted of the development of three phases (Figure 2): (i) investigation of baseline information in the area of interest and on-site inspection, (ii) geophysical and geotechnical characterisation of the soil and correlation of results, and (iii) design parameters for the development of buildings and interpretation of results.
Figure 2. Flow chart of applied methodology
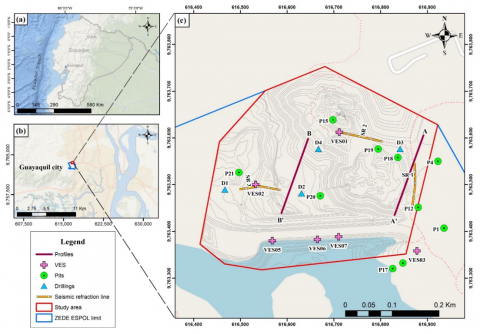
Figure 3. (a) Ecuador’s geopolitical map, (b) Study’s area location, Guayaquil, Ecuador, and (c) Geotechnical and Geophysical survey’s location and delimitation
3.1 Phase I: Investigation of baseline data in the area of interest and on-site inspection
This phase considered the base information of studies and reports belonging to the physical infrastructure management department of ESPOL and relevant information from previous projects on eight test pits and four VESs [34]. To analyse the environment and morphology of the study area, topographic data close to the analysis site was processed to visualise the general geomorphology of the area [30, 31, 35].
The geology of the region was determined using maps and geological profiles. Technical inspections of the site were carried out to verify the geological information in certain places of the study area. These inspections were carried out with equipment including a geologist's hammer, compass, and GPS. The sites for carrying out the field tests (geophysics, drilling and test pits) were selected through analysis of this collected and verified information.
3.1.1 Topographical survey
The topographic survey of the study area started with a pre-existing georeferenced landmark within the ESPOL campus [36]. An orthophoto of the site was used for access and planning of data collection. The Global Positioning System-Real Time Kinematic (GPS-RTK) system and a SOKKIA FX 150 total station were used for data collection. During data collection, points were collected every 5 m, with the total station in the flat areas and RTK in the crown, base, and centre of the slopes.
3.2 Phase II: Geotechnical characterization of the soil and correlation of results
The materials of interest were determined from the geological map of the study area: alluvial deposits, tuff sequences, tuffaceous shales, and lapilli tuffs (Figure 1). To corroborate this geological information, two VESs, three seismic lines, two test pits, and four drillings were performed (Figure 3). The number and location of the tests depended on the topographic conditions of the land, prioritizing sites with less available information that were suitable for the construction of buildings. The data and information obtained from the tests allowed the geological correlation and the geomechanical characterization of the study area.
3.2.1 Geophysical tests
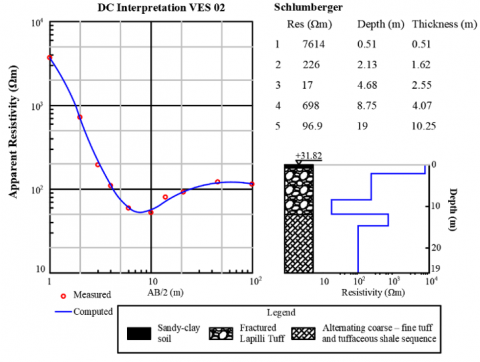
The VESs allowed the detection of the variation in resistivity as a function of depth and analysis of the structure of the subsoil [37, 38]. The Terrameter SAS 1000 resistivity instrument was used in the field to carry out the VESs. For resistivity data collection, the Schlumberger configuration (for separating the electrodes) was used. The results were processed in IPI2win 3.0.1 software, obtaining multilayer electrical resistivity models. The type of material in each layer was determined by interpretation of the resistivities [39, 40].
While the seismic refraction was carried out using the Terraloc Pro-2 seismograph, which took data of P-velocity waves (Vp) from the 24 10 Hz geophones used (with a separation of four meters between them). An eight-kilogram hammer was used as a power source to generate the waves within the seismic refraction test. Data processing was performed using IXREFRAX software. The soil strata were defined based on the anomalies detected in the velocity of P-wave arrival (Vp) [41, 42]. The lithology was determined using typical wave-speed values corresponding to different types of materials according to the international standards of the American Society for Testing and Materials (ASTM) D5777-18 [43].
3.2.2 Geotechnical tests: test pits and perforations
Rotary drilling of rocks and pits was developed at points close to the VESs to verify the information obtained from geophysical methods. Rock and soil samples were obtained from these tests to determine and analyze their physical-mechanical properties. Table 1 shows the laboratory tests carried out:
Table 1. Physical-mechanical parameters analyzed in rock and soil samples obtained from drilling and pits
|
Physical-Mechanical Parameter |
Standard |
|
Specific Weight |
ASTM D854-14 [44] |
|
Unconfined Compressive Strength (UCS) |
ASTM D7012-14e1 [45] |
|
Triaxial (cohesion and friction angle) |
ASTM D4767 [46] |
|
Atterberg limits |
ASTM D4318-17e1 [47] |
|
California Bearing Ratio (CBR) |
ASTM D1883-21 [48] |
|
Moisture content |
ASTM D2216 [49] |
3.2.3 Geophysical-geotechnical correlations
Boreholes and test pits were projected as stratigraphic columns in the resistivity and Vp models. The location of the direct and indirect tests and the depth were considered to correlate the information, making profiles through the different soil materials, and considering the dip of the layers. The correlations between these models allowed validation of the lithological sequences' electrical resistivity and Vp values [50, 51].
3.3 Phase III: Design Parameters for building development
3.3.1 On-site response spectrum and soil profile classification for the seismic design according to the Ecuadorian standard
The Ecuadorian Construction Standard 2015 (NEC-15) [52] defines six types of soil profiles according to the shear wave speed Vs, the number of blows (N), resistance to undrained shear ($S_u$), soil moisture content (W), and other parameters (detailed in Table 2 of the NEC-SE-DS code: Seismic Hazard, earthquake-resistant design part 1).
Table 2. Classification of slope stability analysis results, according to risk
|
SF Range |
Classification According to Landslide Risk |
|
2.0-3.1 |
Medium |
|
3.2-4.9 |
Low |
|
5.0-7.7 |
Very low |
This allowed the generation of the seismic response spectrum of the site. This spectrum analyzes the seismic hazard in rock for a 10% exceedance probability in 50 years (return period 475 years). For this, it considers: a) the factor of a seismic zone, b) the type of soil of the location of the structure, and c) soil amplification coefficients.
Figure 4 shows the model for obtaining the site's response spectrum where the soil profile coefficients were considered. Considering that only seismic refraction tests were carried out ($V_p$), the research conducted by the studies [53, 54] was used to approximate $V_s$, with the relationship $V_p / V_s \sim \sqrt{3}$.
Figure 4. Elastic seismic spectrum of accelerations representing the NEC-15 adapted design earthquake
where,
$\eta$: Ratio between the spectral acceleration (T=0.1 s) and the PGA for the selected return period.
$\mathrm{F}_{\mathrm{a}}$: Soil amplification coefficient in the short period zone.
$\mathrm{F}_{\mathrm{d}}$: Ground amplification coefficient.
$\mathrm{F}_{\mathrm{s}}$: Ground amplification coefficient.
$\mathrm{S}_a$: Elastic response spectrum of accelerations.
T: Fundamental period of vibration of the structure.
$\mathrm{T}_0$: Vibration limit period in the elastic seismic spectrum of accelerations.
$\mathrm{T}_{\mathrm{c}}$: Vibration limit period in the elastic seismic spectrum of accelerations.
Z: Maximum acceleration in rock expected for the design earthquake.
3.3.2 Ultimate bearing capacity of shallow rock foundations
The ultimate bearing capacity was evaluated using Terzhaghi's bearing capacity theory [55] for square foundations according to Eq. (1):
$q_u=1.3 C^{\prime} N_c+q N_q+0.4 \gamma B N_\gamma$ (1)
where,
$\mathrm{N}_{\mathrm{c}}$: Load capacity factor for overload.
$\mathrm{N}_{\mathrm{q}}$: Bearing capacity factor for non-cohesive soil component.
$\mathbf{N}_\gamma$: Self-weight load capacity factor.
Eq. (1) relates the soil's cohesion, the foundation's depth and dimensions, the soil's overburden pressure, and some capacity factors (which depend on the friction angle of the soil). The load capacity factors used are presented in Eqs. (2)-(4) [56]:
$N_c=5 \tan ^4\left(45+\frac{\Phi^{\prime}}{2}\right)$ (2)
$N_q=\tan ^6\left(45+\frac{\Phi^{\prime}}{2}\right)$ (3)
$N_\gamma=N_q+1$ (4)
where,
$\Phi^{\prime}=$ Angle of friction of the rock.
3.3.3 Slope stability and referential zoning for decision-making in construction
In the geotechnical characterisation, it is important to consider that the geomorphology of the location presents steep slopes in different zones of the study area (Figure 3). The natural stability of the eight profiles in the area was analysed. The safety factor of each slope was determined using Geostudio software and the simplified Bishop method [57]. Stability analysis was performed under static and pseudostatic conditions [58]. Under pseudostatic conditions, the seismic load was estimated as the maximum accelerating horizontal force in place (Section 3.3) [59]. The resistance of the materials was determined based on the failure criterion of Hoek-Brown [60] using the parameters presented in Section 3.2.2. The Safety Factors (SF) obtained from the critical profiles were interpolated using the Inverse Distance Weighted (IDW) tool of ArcGIS Pro software, generating a natural stability map [61]. The values obtained were classified into three ranges (see Table 2) and compared with those required by NEC-15.
Subsequently, with the geological-geophysical correlation data and the SF data (Table 2), allowed obtaining a referential zoning map of territorial ordering that allows the sustainable development of companies and industries in the area. This map was generated using the ArcGIS Pro Calculator Raster tool, and will serve for decision-making for mitigating the risk in the construction of buildings.
4.1 Geophysical study
According to the SEVs carried out, in the resistivity curves (Figures 5 and 6), the blue line represents the 1D model of the SEV carried out in the field, and the red dots represent the values of the calculated model. In all cases, the percentage of fit error achieved with the IPI2win software was less than 4% [62]; therefore, the coincidence between the field curve and the theoretical resistivity curve was high. The SEV models showed three to five resistivity geoelectric layers with their respective thicknesses (Figures 5 and 6). As a volcano-sedimentary environment, the predominant profiles comprise lapilli tuffs and sequences of thick tuffs, fine tuffs, and tuffaceous shales. The superficial soil in both tests showed a high resistivity index in the range of 7000 Ω·m, unlike the rocky strata that presented resistivities lower than 1000 Ω·m.
Figure 5. VES01 1D model
Figure 6. VES021D model
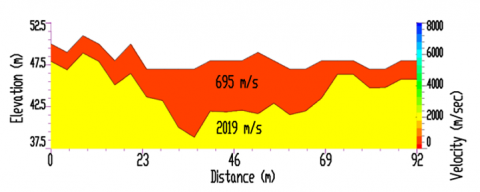
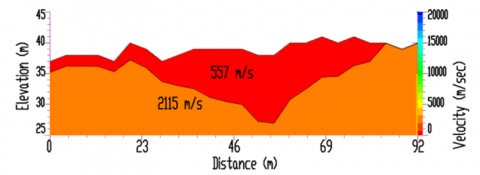
Figure 7. Seismic model 1
The results obtained from the refraction seismic test in the three defined profiles reflect two predominant layers (Figures 7-9). The first layer was associated with a fractured lapilli tuff, with an average Vp of 695 m/s. In comparison, the second stratum had an average Vp of 2019 m/s, correlating with sequences of thick tuff, fine tuff, and tuffaceous shales. These lithological sequences predominate in seismic refraction lines 2 and 3, with Vp variations in the first layer between 557-702 m/s and in the second layer between 2019-2725 m/s.
Figure 8. Seismic model 2
Figure 9. Seismic model 3
4.2 Geotechnical characterization
Tables 3 and 4 summarises the geotechnical results, which indicate that the soil of the study area is composed of gravel-sand, lapilli tuff, and sequences of coarse tuffs, fine tuffs, and tuffaceous shales.
Table 3. Physical and engineering properties - Rotary rock drilling
|
Parameters / Drill |
Gravel and Sand |
Lapilli Tuff |
Sequences of Coarse Tuffs, Fine Tuffs, and Tuffaceous Shales |
|
Maximum Thickness (m) |
0.5 |
22.01 |
34.24 |
|
N SPT |
22.01 |
- |
- |
|
UCS (MPa) |
19-27-28 |
27.25 |
97.58 |
|
Rigidity Module (MPa) |
- |
180.99 |
73.79 |
|
Bulk Density (g/cm3) |
- |
2.314 |
2.185 |
|
Dry Density (g/cm3) |
- |
2.195 |
2.096 |
|
Digability for Excavator D10 Caterpillar |
Excavable |
Excavable |
Marginal |
Table 4. Physical and engineering properties - Test pits
|
Parameters / Pit |
1 |
2 |
3 |
4 |
5 |
12 |
20 |
|
Depth (m) |
0-0.3 |
0-0.6 |
0-0.5 |
0-2 |
0-0.6 |
1.5 |
1.5 |
|
SUCS Classification |
GP-GC |
GP-GC |
SC |
CH |
GP-GC |
CH |
CH |
|
Liquid Limit (%) |
45 |
39 |
32.1 |
55 |
34 |
94.4 |
53.9 |
|
Plastic Limit (%) |
22 |
20 |
22.4 |
26,4 |
19 |
36.86 |
27.49 |
|
Plasticity Index (%) |
23 |
19 |
9.7 |
28.6 |
15 |
57.54 |
26.41 |
|
Optimum Moisture Content (%) |
20.40 |
15.20 |
16.50 |
20.50 |
13.10 |
13.00 |
23.90 |
|
Maximum Dry Density (kg/m3) |
1665 |
1778 |
1665 |
1688 |
1806 |
1612 |
1382 |
|
C.B.R. (95%) |
15 |
18 |
15 |
5 |
19 |
- |
- |
4.3 Geological-geotechnical-geophysical correlation
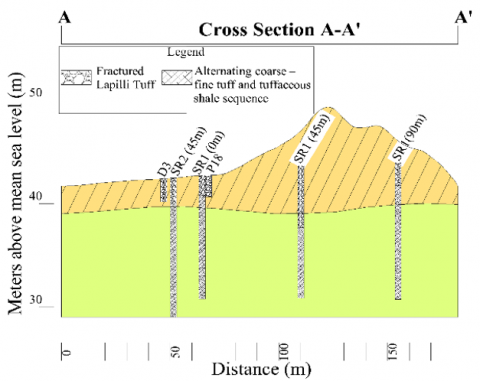
Figure 10. Geological section, cross section A-A’ (Figure 3)
VES and seismic refraction models were correlated using rotating drilling. Two geological sections (Figures 10-11) were prepared using the information obtained from the drillings, test pits, geophysics, and field trips. These profiles were used to correlate the geophysical and geotechnical tests. In sections A-A' and B-B' of NNE-SSW orientation, lapilli tuff geological units were established with a maximum thickness of 10.22 m and sequences of thick tuffs, fine tuffs and tuffaceous shales up to 19.41 m thick.
Figure 11. Geological section, cross section B-B’ (Figure 3)
4.4 Design parameters for building development
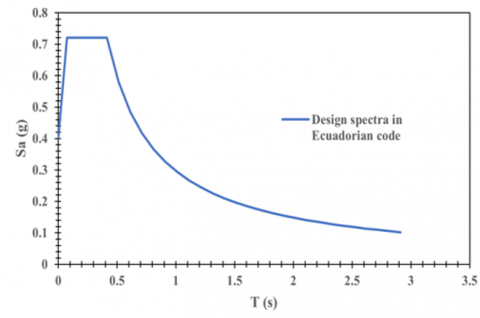
According to NEC-15, the soil profile is classified as type B, corresponding to a rock profile with medium rigidity. The response spectrum was plotted on site using the methodology described in Section 3.3 and Figure 4 of the NEC-15 (Figure 12). Due to municipal restrictions on university campuses, the spectrum calculation considered the construction of buildings of up to four stories. This reduces the risk of earthquakes when combined with a type B soil profile.
Additionally, an example of applying the geotechnical parameters obtained in this investigation to calculate the bearing capacity of the soil is presented. The analysis considered square footings of 1.3 m wide and 1 m deep foundations in the ZEDE. The physical and engineering properties used in the calculation are listed in Table 5, and the ultimate bearing capacity results are presented in Table 6.
Figure 12. Design spectrum for soil profile type B and Z=0.4g
Table 5. Summary of properties of rock material
|
Property |
Symbology |
Value |
Unit |
|
Unit weight |
ɣ |
0.020 |
MN/m3 |
|
Cohesion |
c |
0.0338 |
MPa |
|
Friction angle |
Φ |
60.09 |
o |
|
Rock Quality Designation |
RQD |
39% |
% |
Table 6. Bearing capacity of foundation on rock
|
Description |
Symbology |
Value |
Units |
|
Bearing capacity factor for non-cohesive component of soil |
$\mathrm{N}_{\mathrm{c}}$ |
981.57 |
- |
|
Bearing capacity factor for surcharge |
$\mathrm{N}_{\mathrm{q}}$ |
2750.60 |
- |
|
Self-weight bearing capacity factor |
$\mathrm{N}_{\mathrm{y}}$ |
2751.60 |
- |
|
Equivalent surcharge load at the footing base |
Q |
0.02 |
MN/m2 |
|
Footing Base |
B |
1.30 |
m |
|
Depth of the foundation |
$\mathrm{D}_{\mathrm{f}}$ |
1.00 |
m |
|
Bearing capacity |
$\mathrm{q}_{\mathrm{u}}$ |
516.41 |
MPa |
|
Ultimate bearing capacity as function of RQD |
$\mathrm{q}_{\mathrm{u}}$ (modified) |
78.55 |
MPa |
|
Safety factor |
SF |
3.00 |
- |
|
Allowable bearing capacity |
$\mathrm{q}_{\mathrm{all}}$ |
26.18 |
MPa |
|
Maximum Structural Load |
$\mathrm{q}_{\mathrm{max}}$ |
0.04 |
MPa |
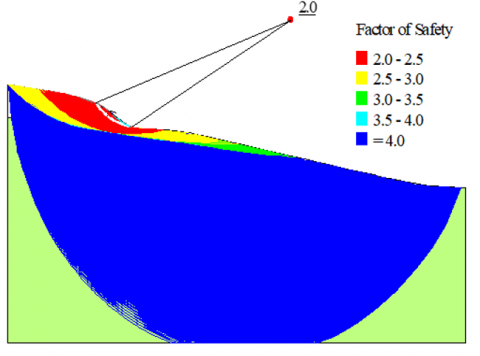
Figure 13. Minimum safety factor obtained in the study area
This study evaluated the static and seismic stabilities of the most critical slope profiles (Figure 13). The values of SF under static conditions range from 3.1-15.7 and pseudostatic between 2.0-7.7. Figure 14(a) shows a map according to the results of the SF in pseudostatic conditions, observing a classification according to the risk of landslides.
For the correlation analysis, the weighted parameters determined the level of risk according to geology and FS (Table 3). The geology presented a range of weighted values from 1-3, with alluvial soil being the one with the highest risk in the face of seismic threat, owing to its low undrained shear strength. Conversely, tuffaceous shale was found at the greatest depth in the material with the highest UCS value. The zoning of the correlation between natural stability, geology, geophysics, and drilling data made it possible to define three risk ranges for instability in the sector, constituting the construction's referential zoning map. The results indicate that approximately 25% of the study area presents a construction risk classified as high. This contribution is significant for companies that start their businesses entrenched in civil construction and soil characterization (Figure 14(a) and Figure 14(b)).
Figure 14. (a) Stability map according to analysis of critical profiles, (b) Zoning of the relationship of natural stability and geology-geophysics data
The combination of geophysical methods and geotechnical investigation allowed the characterisation of the soil of the study area with greater detail and low investment. In the geophysical analysis, Vp and electrical resistivity values were corroborated by direct correlation with the stratigraphic columns obtained from the drillings and test pits. These correlation results determined that the distribution of materials as a function of depth consists of gravel sand, lapilli tuff, and sequences of coarse tuffs, fine tuffs, and tuffaceous shales.
Drill holes 2, 3 and 4 corroborated the presence of lapilli tuff from 0.5 to 5 m deep, with Vp ranges of 557-702 m/s and electrical resistivity of 226-786 Ω·m. The values obtained are consistent with the values of Vp (500-1650 m/s) and electrical resistivities (576-25,000 Ω·m) of different types of lapilli tuffs determined by Paembonan et al. [63] and Fernández et al. [64] with tuff resistivities ranging from 212 to 655 Ω·m and 200-1000 m/s in surveys developed in El Hierro, Spain. In this investigation, they carried out similar tests to obtain a geological correlation and a geotechnical characterization for a hydroelectric plant but using electrical tomography (not VESs). Maryadi et al. [65] in Balten-Indonesia, reported Vp velocities between 565.00-738.00 m/s for lapilli tuffs. In this investigation, they carry out a literature review to determine the geology of the study area, with corroboration from seismic refraction tests. But to guarantee the distribution of the subsoil, it would be necessary to apply a direct exploration method (e.g., drilling or pits).
The average Vs in the first 30 m of the study area was 885 m/s, and the soil profile was type B according to the NEC-15. This profile corresponds to a rock with medium stiffness, which is consistent with the results of the UCS tests. The municipal regulations of the site allow for the construction of buildings with up to four floors. The structural load of a four-story building was approximately 0.04 MPa. The bearing capacity of the soil in the study area was up to 26.10 MPa; therefore, it supported higher structural loads. However, the construction of other types of structures requires further analysis. The slopes of the dam are stable and meet the requirements.
The characterisation and corroboration of the materials in the subsoil of the study area are essential for determining the degree of stability of the ground and its ability to support different structural loads [66]. These considerations must always be adequately considered in territorial planning processes; otherwise, structures could be affected by seismic activity, settlements, or landslides [67, 68]. Some notable cases of this problem were the leaning of the Tower of Pisa, the rockslide of the Vajont dam, and the collapse of a group of silos in Canada in 2016 [69, 70].
Knowledge of the properties and classification of the subsoil of the economic development zone of the university campus will influence the criteria, construction proposals, and decision-making in land use planning. This type of consideration of the subsoil will contribute to a great extent to the sustainable development of the sector and national companies that strengthen the economy of a country generating sources of employment.
It should be noted that the study area covers approximately 12% of the total area of ZEDE. Therefore, the methodology represents a referential pilot study with integral characteristics incorporating geophysics, geology, drillings, and test pits. In addition, the natural stability of the terrain, owing to its texture and geomorphology, was analysed. Integrating these criteria allows referential zoning for construction and decision-making in territorial planning. The determination and identification of the variation of materials in the subsoil allow calculations of the safety factor, the response spectrum of the local site considering triggering factors such as seismic activity for the design of the foundation and buildings, bearing capacity to establish the type of infrastructure that can be built in the ZEDE and the design of the foundations to be implemented depending on the area. However, depending on the type of civil work, the investigation must be deepened by carrying out additional studies in which soil exploration and geophysical-geotechnical campaigns are increased. A hydrological study is also necessary to verify the flooding level of a dam to determine the excavation level. Another aspect to address in future research is territorial and urban planning for ordering space according to the type of industry and needs of the study area. In this way, all essential aspects of the development of ZEDE are covered.
The zoning of the natural stability of the land will allow an analysis of the impact of anthropic activities, determining the areas of greatest risk generated by the constructions that imply land cuts, filling platforms, and increased loads and unloading acting. Based on the correlation of the geophysical and geological campaigns, it is possible to make a three-dimensional model using software such as Geomodeller, to know the variation of the materials in the subsoil, allowing future companies to identify the areas of greatest interest and stability of study and analysis.
ZEDE has a large area within a university campus, but it needs more information and studies to develop and install companies. The stability conditions for the constructions within the area were determined through the characterisation and geological-geophysical and geotechnical correlation. In addition, with the analysis of the geomechanical properties of the terrain based on correlations, it was possible to establish reliable zoning of the bearing capacity of the area where the construction will be carried out. Consequently, it was found that the subsoil of the study area consists of gravel sand, lapilli tuff, and sequences of thick tuffs, fine tuffs, and tuffaceous shales. The solid information was validated by analysing the test pits' rock cores and soil samples.
The most suitable areas for construction were defined based on the types of materials that comprise the subsoil and the natural stability of the slopes. Additionally, the necessary parameters for the development of buildings in ZEDE were calculated, such as the response spectrum on site, load capacity of the soil, and zoning map of the natural stability of the terrain.
In the pilot zone, the safety factor varies from 1.50 to 1.05 in static and dynamic conditions, with a bearing load of up to 26.10 MPa, allowing the construction of more than four-story structures. In the referential zoning for buildings, a high-risk area is presented in the event of a seismic threat in the alluvial material because of the low resistance to the undrained shear of the materials.
This research presented a comprehensive methodology that includes geophysical, geotechnical, and geological studies essential for the feasibility analysis of construction projects. More detailed information is obtained using the proposed methods compared to conventional geotechnical investigations. In addition, it represents an economical, practical, and reliable alternative when information from drillings is limited. Therefore, this methodology, which allows referential zoning for construction and the results of this research applied to the pilot zone (representing 12% (16 ha)), can be replicated in any construction project, in which case, a pilot test should be extended to the entire ZEDE (88% of the remaining area). These types of studies are required to comply with the local standard for civil construction, and they ensure that ZEDE's territorial planning foresees any contingency in infrastructure design. With zoning, it is possible to identify the characteristics of the soil and sectors for any construction, establishing the safety conditions concerning geology, saturation zones, geomechanical properties and the natural stability of the terrain. These results will allow companies to develop their activities with studies and research that facilitate their installation and execution processes required by national and international construction regulations.
The integration of several techniques allows a detailed characterization due to the implementation of indirect methods to identify materials and areas of interest at depth before drilling. The data obtained from the correlation between geophysics and geotechnics allows covering areas with little information based on the materials' geomechanical properties, resistivity, and P wave velocity. The combination of these methods allows greater accuracy of the data, a more extensive mapping and greater profitability in the execution of preliminary studies of civil works.
In the area where the infrastructure risk construction is higher, the combination of geophysical tests, such as the implementation of electromagnetic soundings or geoelectrical tomography, and more drillings, will allow a more detailed and in-depth description and characterization of the cross sections on the geology from the area. Also, complementary studies, such as hydrological studies, could be implemented to determine the flood level of the dam and prevent flooding in areas of alluvial materials.
The authors thank the master's degree in geotechnics from ESPOL Polytechnic University. To the CIPAT researchers for the support provided throughout this research. To the research project of the ESPOL Polytechnic University, "Registration of the geological and mining heritage and its incidence in the defence and preservation of geodiversity in Ecuador", with institutional code CIPAT-01-2018. To the physical infrastructure management department of ESPOL.
[1] Chu, Y., Zhong, Y., Shi, B., Gong, Y. (2022). Experimental study on seismic performance of seismic-damaged RC frames strengthened by different strengthening methods. Structures, 41: 1475-1487. https://doi.org/10.1016/j.istruc.2022.05.103
[2] Rahul, T., Ramya Krishna, V., Singh, P.N. (2022). Evaluation of soil bearing capacity and settlements of soil for various hard rock depths for a 128 m high commercial building with raft foundation. Materials Today: Proceedings, 51: 2604-2607. https://doi.org/10.1016/j.matpr.2021.12.582
[3] Sangirardi, M., Amorosi, A., de Felice, G. (2020). A coupled structural and geotechnical assessment of the effects of a landslide on an ancient monastery in Central Italy. Engineering Structures, 225: 111249. https://doi.org/10.1016/j.engstruct.2020.111249
[4] Zhang, W., Li, Y., Wu, C., Li, H., Goh, A., Liu, H. (2022). Prediction of lining response for twin tunnels constructed in anisotropic clay using machine learning techniques. Underground Space, 7(1): 122-133. https://doi.org/10.1016/j.undsp.2020.02.007
[5] Scarpelli, G., Fruzzetti, V.M.E., Ruggeri, P. (2022). The design of infrastructures in stiff jointed clay formations: A step towards a geological-geotechnical integrated approach. Engineering Geology, 304: 106681. https://doi.org/10.1016/j.enggeo.2022.106681
[6] Caielli, G., de Franco, R., Di Fiore, V., Albarello, D., Catalano, S., Pergalani, F., Cavuoto, G., Cercato, M., Compagnoni, M., Facciorusso, J., Famiani, D., Ferri, F., Imposa, S., Martini, G., Paciello, A., Paolucci, E., Passeri, F., Piscitelli, S., Puzzilli, L.M., Vassallo, M. (2020). Extensive surface geophysical prospecting for seismic microzonation. Bulletin of Earthquake Engineering, 18(12): 5475-5502. https://doi.org/10.1007/s10518-020-00866-4
[7] Mukhopadhyay, R., Renjith, M.L., Devarajan, P., Rajasekar, R. (2022). Marine geophysical surveys for geotechnical Appraisal off Manjeshwaram, Kasaragod, Kerala. Indian Geotechnical Journal, 52(1): 125-131. https://doi.org/10.1007/s40098-021-00564-1
[8] Papadopoulos, G., Fikos, I., Garcia-Jerez, A., Theodoulidis, N., Vargemezis, G. (2023). Combination of passive and active methods towards site characterization of accelerometer stations in Greece. Near Surface Geophysics. https://doi.org/10.1002/nsg.12248
[9] Caballero, L.F., Rivera, Z.C. (2015). Geological correlation and geophysical interpretation at the northeast of Santiago de Cuba city. Comunicações Geológicas, 102(1): 13-20. https://www.lneg.pt/wp-content/uploads/2020/03/2_ART_CG16_003-1902_Caballero_al_publicar.pdf.
[10] Carrión-Mero, P., Aguilar-Aguilar, M., Morante-Carballo, F., Domínguez-Cuesta, M.J., Sánchez-Padilla, C., Sánchez-Zambrano, A., Briones-Bitar, J., Blanco-Torrens, R., Córdova-Rizo, J., Berrezueta, E. (2021). Surface and underground geomechanical characterization of an area affected by instability phenomena in Zaruma Mining Zone (Ecuador). Sustainability, 13(6): 3272. https://doi.org/10.3390/su13063272
[11] Carrión-Mero, P., Solórzano, J., Chávez, M.Á., Blanco, R., Morante-Carballo, F., Aguilar, M., Briones-Bitar, J. (2020). Evaluation of geomechanical features and stability for the recommendations and rehabilitation of the Humberto Molina Hospital, Zaruma, El Oro, Ecuador. Sustainable Development and Planning XI, 455-466. https://doi.org/10.2495/SDP200371
[12] Carrión-Mero, P., Solórzano, J., Morante-Carballo, F., Chávez, M.Á., Montalván-Burbano, N., Briones-Bitar, J. (2022). Technical closure of the Humberto Molina Astudillo Hospital and its implications for sustainability, Zaruma-Ecuador. International Journal of Sustainable Development and Planning, 17(2): 363-373. https://doi.org/10.18280/ijsdp.170202
[13] Wang, H., Zhang, Y., Liu, Z., Liu, R., Li, K. (2022). The impact and mechanisms of the Shanghai pilot free-trade zone on the green total factor productivity of the Yangtze River Delta Urban Agglomeration. Environmental Science and Pollution Research, 29(27): 40997-41011. https://doi.org/10.1007/s11356-021-17758-y
[14] Hausmann, J., Steinel, H., Kreck, M., Werban, U., Vienken, T., Dietrich, P. (2013). Two-dimensional geomorphological characterization of a filled abandoned meander using geophysical methods and soil sampling. Geomorphology, 201: 335-343. https://doi.org/10.1016/j.geomorph.2013.07.009
[15] Sudha, K., Israil, M., Mittal, S., Rai, J. (2009). Soil characterization using electrical resistivity tomography and geotechnical investigations. Journal of Applied Geophysics, 67(1): 74-79. https://doi.org/10.1016/j.jappgeo.2008.09.012
[16] Adiat, K.A.N., Akinlalu, A.A., Adegoroye, A.A. (2017). Evaluation of road failure vulnerability section through integrated geophysical and geotechnical studies. NRIAG Journal of Astronomy and Geophysics, 6(1): 244-255. https://doi.org/10.1016/j.nrjag.2017.04.006
[17] Daniel Opemipo, O., Moroof, O., Sunday, O., Victor, O., Christopher, B. (2022). Subgrade soil evaluation using integrated seismic refraction tomography and geotechnical studies: A case of Ajaokuta-Anyigba Federal highway, North-Central Nigeria. NRIAG Journal of Astronomy and Geophysics, 11(1): 293-305. https://doi.org/10.1080/20909977.2022.2094530
[18] Ijaz, Z., Zhao, C., Ijaz, N., Rehman, Z., Ijaz, A. (2023). Statistical evaluation of multiple interpolation techniques for spatial mapping of highly variable geotechnical facets of soil in natural deposition. Earth Science Informatics, 16(1): 105-129. https://doi.org/10.1007/s12145-022-00924-2
[19] Harrison, M., Hong, W., Lam, S., Xiao, G. (2019). The promise of China’s free trade zones - the case of Hainan. Asian Education and Development Studies, 9(3): 297-308. https://doi.org/10.1108/AEDS-11-2018-0173
[20] Teixeira, L.C. (2020). Labor standards and social conditions in free trade zones: The case of the Manaus free trade zone. Economics, 14(1). https://doi.org/10.5018/economics-ejournal.ja.2020-19
[21] Ye, P., Zhang, H., Ma, S., Yang, F., Li, Y. (2022). A knowledge map study of an application of a smart land planning Free-Trade Zone and China’s contribution. Land, 11(6): 909. https://doi.org/10.3390/land11060909
[22] Alansary, O.S., Al-Ansari, T. (2023). Defining ‘free zones’: A systematic review of literature. Heliyon, 9(4): e15344. https://doi.org/10.1016/j.heliyon.2023.e15344
[23] ESPOL. (2022). ZEDE, Zona Especial de Desarrollo Económico del Litoral. https://www.espol.edu.ec/es/zede-zona-especial-de-desarrollo-económico-del-litoral.
[24] Morante-Carballo, F., Merchán-Sanmartín, B., Cárdenas-Cruz, A., Jaya-Montalvo, M., Mata-Perelló, J., Herrera-Franco, G., Carrión-Mero, P. (2022). Sites of Geological Interest Assessment for Geoeducation Strategies, ESPOL University Campus, Guayaquil, Ecuador. Land, 11(6): 771. https://doi.org/10.3390/land11060771
[25] Bioconversión S.A. (2019). Bioconversión S.A. Perfil de Compañía - Ecuador | Finanzas y ejecutivos clave | EMIS. https://www.emis.com/php/company-profile/EC/Bioconversion_SA_es_9652496.html.
[26] Merchán-Sanmartín, B., Carrión-Mero, P., Suárez-Zamora, S., Aguilar-Aguilar, M., Cruz-Cabrera, O., Hidalgo-Calva, K., Morante-Carballo, F. (2022). Sanitary sewerage master plan for the sustainable use of wastewater on a university campus. Water, 14(15): 2425. https://doi.org/10.3390/w14152425
[27] Luzieux, L.D.A., Heller, F., Spikings, R., Vallejo, C.F., Winkler, W. (2006). Origin and Cretaceous tectonic history of the coastal Ecuadorian forearc between 1°N and 3°S: Paleomagnetic, radiometric and fossil evidence. Earth and Planetary Science Letters, 249(3-4): 400-414. https://doi.org/10.1016/j.epsl.2006.07.008
[28] Benitez, S. (1995). Evolution géodynamique de la province côtière sud-équatorienne au Crétacé supérieur-Tertiaire. Géologie Alpine, 3-163.
[29] Sinclair, J.H., Berkey, C.P. (1924). Geology of Guayaquil, Ecuador, South America. American Journal of Science, s5-7(42): 491-497. https://doi.org/10.2475/ajs.s5-7.42.491
[30] Machiels, L., Morante, F., Snellings, R., Calvo, B., Canoira, L., Paredes, C., Elsen, J. (2008). Zeolite mineralogy of the Cayo formation in Guayaquil, Ecuador. Applied Clay Science, 42(1-2): 180-188. https://doi.org/10.1016/j.clay.2008.01.012
[31] Machiels, L., Garcés, D., Snellings, R., Vilema, W., Morante, F., Paredes, C., Elsen, J. (2014). Zeolite occurrence and genesis in the Late-Cretaceous Cayo arc of Coastal Ecuador: Evidence for zeolite formation in cooling marine pyroclastic flow deposits. Applied Clay Science, 87: 108-119. https://doi.org/10.1016/j.clay.2013.10.018
[32] Delgado Campuzano, D., Herrera Anangono, R., Zambrano Rodriguez, A., Torres Jara, G., Peñafiel León, J., Ortíz, M.J. (2017). Diagnosis of the tourist potential for the design of ecotourism trails. The Case of the Cerro Blanco Protected Forest, Guayas, Ecuador. Revista Interamericana de Ambiente y Turismo, 13(1): 28-43. https://doi.org/10.4067/S0718-235X2017000100028
[33] Solórzano Astudillo, G., Lastra Arroyo, K. (2017). Design of an alternative route from the PARCON checkpoint to academic areas (Prosperina Campus) at a pre-feasibility level. ESPOL Polytechnic University. https://www.dspace.espol.edu.ec/xmlui/bitstream/handle/123456789/46643/D-CD70294.pdf?sequence=1&isAllowed=y.
[34] Carrión-Rodríguez, R., Gonzales-Zambrano, P., Chávez, M.A. (2009). Studies and designs of the PARCON-ESPOL reservoir dam. ESPOL Polytechnic University, 1-10. https://www.dspace.espol.edu.ec/bitstream/123456789/8303/1/Estudios y Diseños de la Presa de Embalse del Parque del Conociemiento ESPOL.pdf.
[35] Alemán, A.M., Palencia, A.A., Lezama, E.E., Montenegro, G. (2021). The Chongón/Colonche orocline transrotational bending and the coeval opening of the Progreso basin in southwestern Ecuador. Journal of South American Earth Sciences, 111: 103480. https://doi.org/10.1016/j.jsames.2021.103480
[36] Cedeño Mosquera, U. (2015). Implementation of a geodetic control network linked to the REGME (GNSS network for continuous monitoring of Ecuador) of the Military Geographic Institute within the Gustavo Galindo campus of ESPOL. ESPOL Polytechnic University. https://www.dspace.espol.edu.ec/handle/123456789/32264.
[37] El Makrini, S., Boualoul, M., Mamouch, Y., El Makrini, H., Allaoui, A., Randazzo, G., Roubil, A., El Hafyani, M., Lanza, S., Muzirafuti, A. (2022). Vertical Electrical Sounding (VES) technique to map potential aquifers of the Guigou Plain (Middle Atlas, Morocco): Hydrogeological implications. Applied Sciences, 12(24): 12829. https://doi.org/10.3390/app122412829
[38] Reynolds, J.M. (2011). An Introduction to Applied and Environmental Geophysics (2nd Edition). Wiley, USA. https://www.wiley.com/en-sg/An+Introduction+to+Applied+and+Environmental+Geophysics%2C+2nd+Edition-p-9780471485353.
[39] Carrión-Mero, P., Tiviano, I., Hervas, E., Jaya-Montalvo, M., Malavé-Hernández, J., Solórzano, J., Berrezueta, E., Morante-Carballo, F. (2023). Water Sowing and harvesting application for water management on the slopes of a volcano. Heliyon, 9(5): e16029. https://doi.org/10.1016/j.heliyon.2023.e16029
[40] Telford, W.M., Geldart, L.P., Sheriff, R.E. (1990). Applied Geophysics. Cambridge University Press. https://kobita1234.files.wordpress.com/2016/12/telford-geldart-sheriff-applied-geophysics.pdf.
[41] Guadalupe-Méndez, G., Vargas-Jiménez, J., Morante-Carballo, F., Solórzano, J., Briones-Bitar, J., Carrión-Mero, P. (2023). Correlation of SPT and seismic refraction tests to obtain dynamic soil parameters. Palestina, Guayas-Ecuador. International Journal of Sustainable Development and Planning, 18(3): 805-815. https://doi.org/10.18280/ijsdp.180316
[42] Mahvelati, S., Kordjazi, A., Coe, J.T. (2018). A review of seismic geophysical testing in Iran for building near-surface velocity models. The Leading Edge, 37(1): 68a1-68a10. https://doi.org/10.1190/tle37010068a1.1
[43] ASTM. (2019a). Standard guide for using the seismic refraction method for subsurface investigation. ASTM D5777-18. https://www.astm.org/d5777-18.html.
[44] ASTM. (2023). Standard test methods for specific gravity of soil solids by water pycnometer (withdrawn 2023). ASTM D854-14. https://www.astm.org/standards/d854#:~:text=4.1.,water (at proper temperature).
[45] ASTM. (2017). Standard test methods for compressive strength and elastic moduli of intact rock core specimens under varying states of stress and temperatures. ASTM D7012-14e1. https://www.astm.org/d7012-14e01.html.
[46] ASTM. (1970). Suggested method of test for interna friction and cohesion values of soils and soil mixtures. STP38509S. https://www.astm.org/stp38509s.html.
[47] ASTM. (2018). Standard test methods for liquid limit, plastic limit, and plasticity index of soils. ASTM D4318-17e1. https://www.astm.org/d4318-17e01.html.
[48] ASTM. (2021). Standard test method for California Bearing Ratio (CBR) of laboratory-compacted soils. ASTM D1883-21. https://www.astm.org/d1883-21.html.
[49] ASTM. (2019b). Standard test methods for laboratory determination of water (moisture) content of soil and rock by mass. ASTM D2216-19. https://www.astm.org/d2216-19.html.
[50] Cosenza, P., Marmet, E., Rejiba, F., Jun Cui, Y., Tabbagh, A., Charlery, Y. (2006). Correlations between geotechnical and electrical data: A case study at Garchy in France. Journal of Applied Geophysics, 60(3-4): 165-178. https://doi.org/10.1016/j.jappgeo.2006.02.003
[51] Wilches, F.J., Burbano, J.L.A., Sierra, E.E.C. (2020). Subgrade soils characterization data, for correlation of geotechnical variables on urban roads in northern Colombia. Data in Brief, 32: 106095. https://doi.org/10.1016/j.dib.2020.106095
[52] NEC-15. (2015). Seismic hazard: Earthquake resistant design. Ecuadorian Construction Standard (NEC-SE-DS Code). https://www.habitatyvivienda.gob.ec/wp-content/uploads/2023/03/2.-NEC-SE-DS-Peligro-Sismico-parte-1.pdf.
[53] Hamada, G.M. (2004). Reservoir fluids identification using Vp/Vs ratio. Oil & Gas Science and Technology, 59(6): 649-654. https://ogst.ifpenergiesnouvelles.fr/articles/ogst/pdf/2004/06/hamada_vol59n6.pdf.
[54] Eberhart-Phillips, D. (1990). Three-dimensional P and S velocity structure in the Coalinga Region, California. Journal of Geophysical Research, 95(B10): 15343. https://doi.org/10.1029/JB095iB10p15343
[55] Terzaghi, K. (1943). Theoretical Soil Mechanics. John Wiley & Sons, Inc. https://doi.org/10.1002/9780470172766
[56] Hoek, E. (2007). Practical Rock Engineering. Rocscience, British Columbia, Canada. https://www.rocscience.com/assets/resources/learning/hoek/Practical-Rock-Engineering-Full-Text.pdf.
[57] Ji, J., Zhang, W., Zhang, F., Gao, Y., Lü, Q. (2020). Reliability analysis on permanent displacement of earth slopes using the simplified Bishop method. Computers and Geotechnics, 117: 103286.
[58] Belghali, M., Saada, Z., Garnier, D., Maghous, S. (2017). Pseudo-static stability analysis of rock slopes reinforced by passive bolts using the generalized Hoek-Brown criterion. Journal of Rock Mechanics and Geotechnical Engineering, 9(4): 659-670. https://doi.org/10.1016/j.jrmge.2016.12.007
[59] Jiang, X., Cui, P., Liu, C. (2016). A chart-based seismic stability analysis method for rock slopes using Hoek-Brown failure criterion. Engineering Geology, 209: 196-208. https://doi.org/10.1016/j.enggeo.2016.05.015
[60] Nekouei, A.M., Ahangari, K. (2013). Validation of Hoek-Brown failure criterion charts for rock slopes. International Journal of Mining Science and Technology, 23(6): 805-808. https://doi.org/10.1016/j.ijmst.2013.10.004
[61] AlHamaydeh, M., Al-Shamsi, G., Aly, N., Ali, T. (2021). Seismic risk quantification and GIS-based seismic risk maps for Dubai-UAE_Dataset. Data in Brief, 39: 107566. https://doi.org/10.1016/j.dib.2021.107566
[62] Morante, F., Aguilar, M., Ramírez, G., Blanco, R., Carrión, P., Briones, J., Berrezueta, E. (2019). Evaluation of slope stability considering the preservation of the General Patrimonial Cemetery of Guayaquil, Ecuador. Geosciences, 9(3): 103. https://doi.org/10.3390/geosciences9030103
[63] Paembonan, A.Y., Febriansanu, D.R., Huseina, A.A., Sigalingging, A.S., Nathania, E.Y., Andika, P.P. (2021). Preliminary result of electrical resistivity and electromagnetic methods to determine the bedrock. Earth and Environmental Science, 830(1): 012053. https://doi.org/10.1088/1755-1315/830/1/012053
[64] Fernández-Baniela, F., Arias, D., Rubio-Ordóñez, Á. (2021). Seismic refraction and electrical resistivity tomographies for geotechnical site characterization of two water reservoirs (El Hierro, Spain). Near Surface Geophysics, 19(2): 199-223. https://doi.org/10.1002/nsg.12152
[65] Maryadi, M., Ilahi Bisgar, N.A., Yufajjiru, L., Rizqulloh, R., Fatih, G. El, Jabbar, G.A. (2021). Pyroclastic deposits identification using near-surface seismic refraction tomography in Rawa Dano Volcanic Complex, Banten, Indonesia. Earth and Environmental Science, 873(1): 012062. https://doi.org/10.1088/1755-1315/873/1/012062
[66] Mahmood, N.S., Aude, S.A., Abdullah, H.H., Sulaiman, S.O., Al Ansari, N. (2022): Analysis of slope stability and soil liquefaction of zoned earth dams using numerical modeling. International Journal of Design & Nature and Ecodynamics, 17(4): 557-562. https://doi.org/10.18280/ijdne.170409
[67] Carrión-Mero, P., Briones-Bitar, J., Morante-Carballo, F., Stay-Coello, D., Blanco-Torrens, R., Berrezueta, E. (2021). Evaluation of slope stability in an urban area as a basis for territorial planning: A case study. Applied Sciences, 11(11): 5013. https://doi.org/10.3390/app11115013
[68] Oludare, O.I., Kazeem, R.A., Adebayo, A.S., Awonusi, A.A., Dare, A.A., Ikumapayi, O.M., Adaramola, B.A. (2023). An assessment of earthquake-induced landslides distribution in Nepal using open-source applications on Sentinel-1 Tops Sar Imagery. International Journal of Design & Nature and Ecodynamics, 18(2): 237-249. https://doi.org/10.18280/ijdne.180201
[69] Fiorentino, G., Quaranta, G., Mylonakis, G., Lavorato, D., Pagliaroli, A., Carlucci, G., Sabetta, F., Della Monica, G., Lanzo, G., Aprile, V., Carlo Marano, G., Briseghella, B., Monti, G., Squeglia, N., Bartelletti, R., Nuti, C. (2019). Seismic reassessment of the leaning tower of Pisa: Dynamic monitoring, site response, and SSI. Earthquake Spectra, 35(2): 703-736. https://doi.org/10.1193/021518EQS037M
[70] Wolter, A., Stead, D., Ward, B.C., Clague, J.J., Ghirotti, M. (2016). Engineering geomorphological characterisation of the Vajont Slide, Italy, and a new interpretation of the chronology and evolution of the landslide. Landslides, 13(5): 1067-1081. https://doi.org/10.1007/s10346-015-0668-0