Abdul Wahid*![]() | Adi Susilo
| Adi Susilo![]() | Hery Leo Sianturi
| Hery Leo Sianturi![]() | Wiyono
| Wiyono
© 2023 IIETA. This article is published by IIETA and is licensed under the CC BY 4.0 license (http://creativecommons.org/licenses/by/4.0/).
OPEN ACCESS
Sendang Biru Beach, located in Sumbermanjing Wetan District, South Malang Regency, East Java Province, Indonesia, offers significant tourism and fisheries potential, supported by the nearby Sempu Island Nature Reserve and a Fish Auction Site (FAS). However, the coastal region is prone to karstification, which may be exacerbated by recent land use developments in the surrounding area. This study aims to analyze the rock layer structures and assess the vulnerability of karst land use to the ongoing karstification process. Electrical Resistivity Tomography (ERT) and Magnetotelluric (MT) methods were employed to investigate karst land within the study area. The findings revealed the presence of karst aquifers in Zone A, extending to a depth of 250 m, characterized by low resistivity values. In Zone B, karst limestone deformation was observed at several locations due to karstification, with moderate resistivity values detected at a depth of 300 m on the surface, indicating vulnerability to karst disasters. High resistivity values dominated areas with massive karst limestone, ranging from the surface to a depth of 400 m. Furthermore, it was found that a significant portion of karst land is utilized for settlements, plantations, and rice paddies, potentially disrupting the karst ecosystem due to household, plantation, and agricultural waste. This study highlights the importance of understanding the impact of land use on karst vulnerability and informs mitigation strategies for sustainable development in the Sendang Biru region.
karst aquifer, geoelectric, limestone
Sendang Biru Beach, situated in the southern part of Malang Regency within the Sumber Manjing Wetan District of East Java, features a topography ranging from 0 to 100 m above sea level. Geographically positioned at 08°37′- 08°41′S and 112°35′- 112°43′E, the beach derives its name from the presence of a blue spring ("Sendang" in Indonesian) along the coastline. Serving as an access point to Sempu Island, Sendang Biru Beach is characterized by relatively smaller waves compared to other southern coastal areas due to the island's influence. The beach is approximately 70 kilometers from Malang City Square and boasts a wealth of natural resources, including tourism and fisheries [1, 2]. Supported by the nearby Sempu Island Nature Reserve and Fish Auction Place (FAS), Sendang Biru Beach also serves as a fish landing site, yielding various fish species such as tuna, yellowfin, skipjack, albacore, and marlin. Notably, the area features caves and karst landscapes, with the karst geomorphological areas predominantly composed of limestone. Karst landscapes typically result from rock-dissolving processes, primarily involving limestone or dolomite, due to water flow. This process forms fragile structures and water concentration points, leading to groundwater discharge, continuous flow, and the formation of interconnected cavities, ultimately producing subsurface conduit channels [3].
Numerous studies have employed Electrical Resistivity Tomography (ERT) as a geophysical method to investigate karst areas. These investigations have sought to acquire information on the location of subsurface sinkhole cavities [3], characterize the subsurface karst environment [4], and visualize dissolution zones within karst systems to determine the risk of surface collapse [5]. Other studies have highlighted the significant difference in resistivity between water-saturated karst and karst bedrock [6], sinkhole formation due to the widening of vertical dissolution at the intersection of three series of conduit channels [7], and the geological characteristics of cavities and other features in highly heterogeneous karst environments [8]. Meanwhile, the study [9] mapped voids and caves between carbonate units, cavity-filling sediments, and groundwater. Researchers have also used Magnetotelluric (MT) surveys to identify subsurface dry fracture networks and caves beneath synclines resulting from subsurface karst decay [10]. Moreover, studies have examined shallow and deep structures, as well as the understanding of collapse and cracking due to karst dissolution processes [11]. The paper [12] unveiled three subsurface rock layers correlating with karst lithology, while the study [13] reported void collapses due to dissolution, causing overlying layer collapse and artesian water-holding features.
Alternative methods, such as the Transient Electromagnetic Method (TEM), have been utilized to detect subsurface karst caves [14]. Integrated geophysical methods, including MT and Seismic Refraction Tomography (SRT), have been employed to identify faults, fracture zones, and detect water-filled channels in karst fields [15]. Comprehensive geophysical approaches, such as Seismic and Controlled Source Audio-frequency Magnetotellurics (CSAMT), have been used to explore limestone and detect water-rich areas of karst structures [16]. Furthermore, karst areas often face drought and water crises during the dry season due to discontinuous surface water drainage, which is reduced by cracked and weathered rock, causing rivers to flow underground [17].
Interestingly, the Sendang Biru karst area has never experienced drought, even during the dry season. The region exhibits low rainfall and varying discharge fluctuations, including perennial flow, indicative of diffuse or fissure channel-type springs. Land use in the catchment area is highly heterogeneous, dominated by shrubs, plants, growing forests, settlements, agriculture, and irregular trade. The presence of numerous Karren formations suggests significant karst development. Consequently, this study aims to examine the subsurface rock layer structures resulting from the karstification process to develop a foundation for karst land use and mitigate vulnerability to karst disasters.
To achieve this aim, the ERT and MT geophysical methods were employed in the Sendang Biru karst land. Specifically, the study investigates the existence of karst aquifers at Sendang Biru Beach by applying a geophysical exploration method that combines local geoelectric methods (by injecting electric currents into the earth) and regional magnetotelluric methods (by utilizing natural electromagnetic waves). Additionally, the study analyzes the resistivity values of both methods. The findings from this investigation are expected to provide insights into the vulnerability of Sendang Biru Beach karst land use due to aquifer resource exploitation and uncontrolled land use. The utilization of land for settlements, plantations, and rice fields may increase vulnerability to waste pollution in karst aquifers and karst collapse disasters due to karst desolation processes. Therefore, this study serves as a basis for disaster mitigation considerations for the vulnerable Sendang Biru karst area.
Figure 1. Geological map [18]
Figure 1 shows a map of the research location. Sendang Biru Beach has a hilly area with moderate to steep slopes with a height of 50-250 meters above sea level, has a flat slope (<3%), slightly sloping (3-8%), rather steep (25-40%) and very steep (40%). Sendang Biru Beach consists of a beach with limestone, coral, and steep walls, and part of it is a sloping beach with a length of 50-100 m on the east and west sides. The rocks of the Sendang Biru region are barren and easily eroded limestone. Based on the geological map, it can be seen that the location is in Wonosari formation (Tmwl), which is dominated by limestone, sandy marl, and claystone inserts. The Wonosari Formation is flanked by the Qas Formation (swamp and river deposits), which is dominated by gravel, sand, clay, and plant debris in the western and northern parts. In the eastern part of Mandalika formation (Tomm) is dominated by andesitic lava, basalt, trachite, dacite, andesitic breccias. The upper north is the Mandalika Formation and the Wuni Formation. Some streams cut along the Qas Formation.
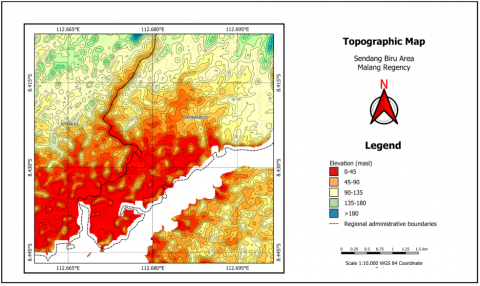
In addition, the location of Sendang Biru Beach, Tambak Rejo Village, is in a basin based on the topographic map, as shown in Figure 2. Most are at an altitude of 0–45 meters above sea level, especially those in coastal locations. Some hills spread out at 45-90 meters above sea level and are flanked by a topographical surface with an altitude of 40-125 meters above sea level. Further north, the topographical elevation reaches 180 meters above sea level. While the topography of Sempu Island on the coast is at an altitude of 0-45 masl, hills are spreading across the island's surface at an altitude of 45-90 masl.
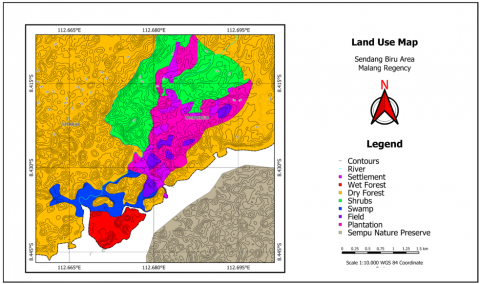
Furthermore, Figure 3 shows a land use map dominated mainly by dry forest surrounding it and spreading to the coast. The part of the basin for land use is in the form of plantations, residential use, and use fields, which are spread out in groups on plantation land. The northern, eastern, and western parts, as well as the southern part of the coast, are dominated by dry forests; in the southern part, there is a small part of alkaline forests and swamps. Sempu Island is a protected nature reserve located opposite Sendang Biru Beach.
Figure 2. Topographic map [18]
Figure 3. Land use map [18]
This study investigates the behavior of karstification zones and aquifer channels in the karst area of Sendang Biru Beach. The method used is a combination of ERT and MT methods. ERT is used to provide information about the dynamics of the system and its boundaries. Furthermore, this information is used to design a channel network model. Thus, a comprehensive investigation of the dynamic behavior and sinkhole capture can be carried out. This study used the ERT data acquisition method using a Georesistivity meter multi-electrode prospecting measurement tool (mod. M.A.E. A6000E). At the same time, MT data acquisition was carried out with five measuring points using a Metronix ADU-07e magnetotelluric unit. In addition, the MT method uses ProcMT and WinGlink software. ProcMT software converts raw MT data (time series) to series frequency. Then Fourier transform and robust processing is performed to obtain the apparent resistivity curve. The next phase is exported into a data-edi format for the modeling phase. At the same time, the WinGlink software performs 1D and 2D modeling and uses Bostick inversion. Modeling uses non-linear conjugate gradient inversion. Finally, a model is obtained, interpreted, and integrated with other subsurface data.
3.1 Electrical resistivity tomography (ERT)
The ERT method is used to determine the subsurface resistivity. The steps are (1) injecting electric current I into the ground with two electrodes and (2) measuring the voltage generated between two or more potential electrodes ∆V. Resistivity is a quantity whose value depends on the spacing of the electrode configuration used k. Because the earth consists of layers with different resistivity values, the measured potential is the effect of these layers. According to the study [19], the apparent resistivity is formulated:
$\rho_a=k \frac{\Delta V}{I}$ (1)
The equation obtains the geometric factor k for the dipole-dipole configuration:
$k=\pi n a(n+1)(n+2)$ (2)
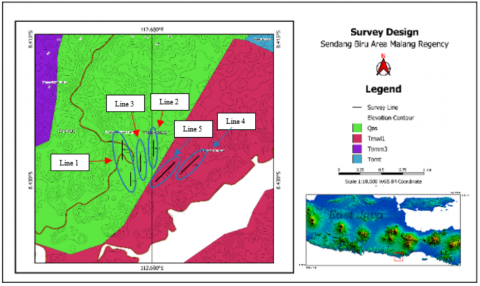
Data acquisition was carried out from 7 to 9 April 2021 with a dipole-dipole configuration with an electrode distance of a = 10 m. In this study, measurements were made of 6 measuring lines with 1 to 5 track lengths of 240 m. Meanwhile, track 6 stretches 160 m, as shown in Figure 4.
Figure 4(a) shows the track's location on the survey design map. There are five tracks in the Qas Formation, three in the Wonosari Formation, and two in the Mandilika Formation. The map shows a measuring stretch (black line) indicating Lines 1 – 5. Data processing using Res2Dinv and Oasis Montaj software is then interpreted to analyze subsurface layering patterns (Figure 4(b)).
3.2 Magnetotelluric (MT)
The MT method is electromagnetic sounding (EM). Its function passively measures the regional time-varying components of the electric field (E ̅ ) and natural magnetic field (H ̅ ). Here, a comparison between the electric and magnetic fields perpendicular to each other is carried out. The aim is to obtain the impedance of the electrical properties of a medium in the form of conductivity and resistivity, which can produce images for greater depths. The decay of the amplitude when the wave is in the z direction is known as the skin depth (δ). That is the distance along which the electric field strength is attenuated by 1/e of the initial electric field strength. Thus, skin depth can be written as follows:
$\delta=503 \sqrt{\frac{\rho}{f}}$ (3)
(a)
(b)
Figure 4. (a) Site survey design map, (b) Track position
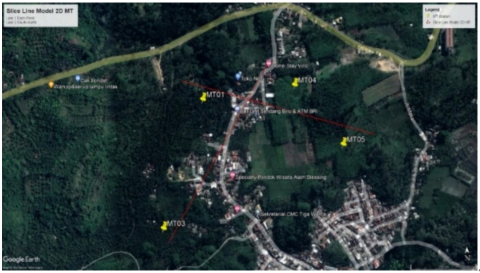
Figure 5. MT measurement point locations and line directions
Eq. (3) shows that the skin depth depends on two parameters, the resistivity (ρ) of the medium and the wave frequency (f). Skin depth decreases with decreasing resistivity and increasing frequency.
Data acquisition using the MT method uses 5 points measured on June 13-18, 2022 (Figure 5). A Metronix ADU-07e measuring instrument is used to measure three components of the magnetic field (Hx, Hy, and Hz) with three coils. Then the two components of the electric field (Ex and Ey) with an electrode span of 2 50 m are installed perpendicular to each other. The frequency range carried out is between 5 kHz – 64 kHz. The results of consecutive measurements with footage of High Frequency (HF) 64 kHz for 30 minutes, Medium Frequency (MF) 16 kHz for 2 hours, Low Frequency (LF) 8 kHz, and backup data for 30 minutes. Thus, the total data collection was about 5 hours per MT measuring point.
4.1 Identification of resistivity distribution with ERT method
The basis for data interpretation is an open sinkhole reference. In this case, a spring on track 1 and line 6 with low resistivity anomaly to characterize karst aquifers. Table 1 shows the resistivity anomaly of the research location with a range ranging from 1.2 Ωm - 485 Ωm, classified into low, medium, and high resistivity zones [20].
Table 1. Subsurface resistivity distribution using the ERT method
|
No. |
Contour Color |
Resistivity (Ω.m) |
Level |
|
1. |
Blue- Green |
1.2 - 8.5 |
Low |
|
2. |
Dark green- Yellow |
8.6 – 26. 8 |
Medium |
|
3. |
Brown - Purple |
26.9 – 485 |
High |
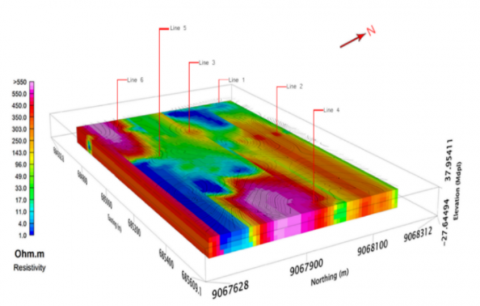
- High resistivity zone
This zone is visible between tracks 1 and 2, 3 and 6, and around track 4 at a depth of 5 m to 40 m. It is interpreted as a very massive fresh karst limestone. The same thing can be seen around tracks 1, 2, 6, and 5. at a depth of 5 m to 10 m. Here, there is a layer of overburden in the form of alluvium and heaps of material and clay. However, it differs from the high resistivity around tracks 2, 4, and 5 at a depth of 15 m to 40 m. This area is interpreted as a massive karst limestone with a resistivity value more significant than the overburden layer.
- Moderate resistivity zone
This zone is visible around tracks 2, 3, 5, and 6 at 5 m to 40 m depth. This location is interpreted as karst limestone, fractured with wet clay saturated with water. The same thing can be seen at the bottom of track 5 at a depth of 10 m to 35 m.
- Low resistivity zone
This zone is in the middle of track 2 at 5 m to 10 m depth. That is interpreted as a karst lens saturated with karst aquifer water. The same can be seen on the east side, under tracks 4 and 5, at 5 m to 20 m depth. Then on track 5, with a depth of 10 to 40 m. In addition, in the western part around tracks 1, 3, and 6, with a depth of 15 m to 40 m, there is a karst lens saturated with water in the form of a karst conduit line.
4.2 Identification of resistivity distribution with the MT method
MT data processing used ProcMT software. First, MT raw data (time series) is converted to frequency series using Fourier transform and robust processing. The second is to obtain the apparent resistivity curve and then export the phases into an edited data format for the modeling phase. Finally, WinGlink software is used for 2D modeling with Bostick inversion and non-linear conjugate gradient inversion modeling. This model is used to analyze, interpret and integrate subsurface data.
Figure 7 shows the results of MT data processing for the Bostick inversion model. Based on the figure displays the resistivity, phase, and depth values of the five MT measuring points. However, based on the results of data measurements, MT6 could not be processed because there were many data errors, only MT01, MT03, MT04, and MT05.
(a)
(b)
Figure 6. Resistivity distribution model: (a) 2D; (b) 3D
Figure 7. Profiles of Bolistick models for MT1, MT3, MT4 and MT5 measure points
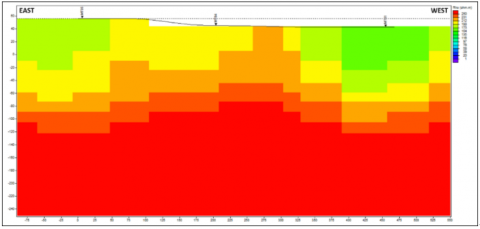
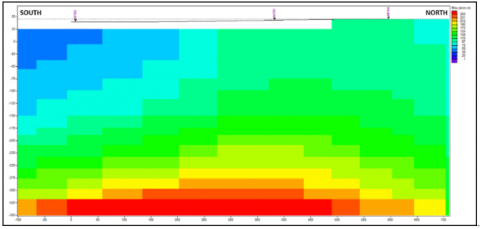
Figure 8. 2D Resistivity profile: (a) East-west line direction, and (b) North-south
Based on the Bolistick model (Figure 7) and the 2D profile (Figure 8), an interpretation of the resistivity anomaly distribution is obtained ranging from 1 Ωm - 350 Ωm. Table 2 shows the low, medium, and high resistivity zones' classification.
Table 2. MT method resistivity distribution
|
No. |
Contour Color |
Resistivity (Ω. m) |
Level |
|
1. |
Blue- Green |
1 - 97 |
Low |
|
2. |
Dark green- Yellow |
98 – 193 |
Medium |
|
3. |
Brown - Purple |
194 – 350 |
High |
- High resistivity
High resistivity is seen at the MT05 and MT01 measurement points at 100 m to 350 m. Then there is also around MT 04 along 275 m on the surface to a depth of 350 m. According to the study [21], this anomaly is interpreted as the presence of massive limestone. In general, massive limestone is dominated by the east-west line.
- Medium resistivity
Moderate resistivity is located around the MT05 and MT01 measurement points at 20 to 75 m depth. Apart from that, there are also around the MT04 measurement point on the surface to an average depth of 100 m. This area shows limestone that has undergone dissolution or karstification. The dominance of resistivity is interpreted as limestone undergoing a karstification process. This area is located on the south-north line, which has experienced karstification with low to moderate values. Furthermore, a high resistivity anomaly is seen at a depth of 300 m to 350, interpreted as massive limestone. According to the study [22], the karst limestone has been deformed due to karstification.
- Low resistivity
Located on the east-west line with a length of 150 m around MT05 to a depth of 67 m. The same thing can be seen in the MT01 area along 225 m to a depth of 70 m. Both locations indicate the possibility of karst rocks inserted by water flow. Low resistivity values are interpreted as karst aquifers. In addition, on the south-north line, low resistivity anomalies dominate the surface of the study area to a depth of 225 m. In this study, a karst aquifer is predicted in the south. The location is at MT 05 along 250 m to a depth of 175 m. Then in the northern part of MT 01, there is a low resistivity anomaly with a length of 100 m to a depth of 175 m.
4.3 Land zone analysis and karst existence
It will be divided into three zones to identify the presence of karst, as shown in Figure 9.
Figure 9. Study location zone of Sendang Biru karst land
4.3.1 Zone A
Geologically the zone is located in the Qas Formation, which is at an average altitude of 0 - 45 meters above sea level. This area has a low resistivity with a spreading pattern. It fulfills daily needs and irrigates plantations, rice fields, and settlements. On the surface of a 40 m, interpreted as limestone, it has been fractured as a karst aquifer. The same thing was also obtained based on the analysis of resistivity geoelectric data in rock layer resistivity and the presence of karst aquifer conduit channels. The existence of a karst aquifer through the open sinkhole springs on Track 1 leads to Track 3 and Track 6 of open sinkhole springs. That has been verified by community-drilled wells on line 3 with an average depth of 15 m to 24. That indicates that the limestone has undergone a process of dissolving karstification, is filled with clay material, and is saturated with water at the same depth as the conduit line with branched water flow directions. The first branch goes to the springs on track 1, while the second goes to tracks 3 and 6. The channel pattern of the conduit's subsurface river water is estimated to originate from the central part of zone A. The location is right in the topography of the hills, with an altitude of 45-90 meters above sea level. In addition, this zone is flanked by surface topography with an altitude of 40-125 meters above sea level leading to the valley where the Sendang Biru springs are located on Track 1 and the second spring on Track 6. Thus, the direction of subsurface river water flow is with a gravity flow system.
4.3.2 Zone B
Zone B is located in the Qas formation, dominated by gravel, sand, clay, and plant remains at an average of 0-45 meters above sea level. This zone has moderate resistivity, identified by the presence of clay, marl, sand, and gravel, which functions as a barrier to inundated aquifers. In addition, this zone is a catchment area vertically through the epikarst zone to the conduit channel. Zone B is interpreted as a layer of rock that has undergone a dissolution process of fractured limestone filled with saturated wet clay. In addition, Zone B is also used as a residential area, rice fields, and plantations.
4.3.3 Zone C
Geologically, zone C is located in the Wonosari formation. It is located at an average altitude of 0-90 meters above sea level and is dominated by limestone. Zone C is interpreted as massive limestone in the form of very massive and fresh karst limestone. As shown in Figure 8, zone C is a land of karst cliffs in the form of dry forest empty land.
4.4 Discussion
Based on the investigations that have been carried out, it can be seen that Sendang Biru's land use is dominated by housing, plantations, and agricultural land, which are spread along the surface of the karst aquifer land. Over time, an increasing population will require more and more land for settlements and land use as a livelihood. However, this will cause problems in the form of over-exploitation of aquifer resources and karst land. As a result, it will cause ecosystem damage and pollution contamination, especially seawater intrusion and contaminants. According to the study [23], karst areas are discontinuous due to a lack of surface water drainage due to cracked and porous rocks. That will cause the river to flow below often. Therefore, according to the study [24], it is necessary to understand the dynamic conditions of karst collapse, including the relationship between groundwater and the bedrock surface, the primary karst groundwater runoff zone, supply, surface drainage, and the geotechnical characteristics of the cover layer. In addition, inventory is needed in the integrated management of karst areas, especially as a tool for karst disaster mitigation systems, early warning, and monitoring of pollution hazards [25].
As previously described, where the description of the karst land zone in 2.5 D and 3 D has been shown based on the distribution of resistivity values in the basin. Zone A in the Sendang Biru area is a karst aquifer located in the western part of tracks 1, 3, and 6 and the eastern part of track 5. Zone B is in the middle part of a layer of cracked limestone containing saturated wet clay, which is the location of the karstification process. While zone B is in the north and south in massive overburden layers and layers of limestone, the western part of the zone in the lower and eastern middle is massive and fresh limestone. These zones are Sendang Biru and Tambak Rejo Village's land use for developing fisheries and tourism resources, mostly dry land and forest. In addition, the existence of fish auctions and Sempu Island as a protected nature reserve and the existence of groundwater resources in the form of karst aquifers. Then, when this is not controlled, it will damage the karst ecosystem and environment.
Furthermore, potential karst aquifers in zone A and B are zones of dissolution of karst rocks prone to collapse. Most of this land is used for settlements, plantations, and rice fields, which will disrupt the karst land's environmental ecosystem, such as household waste and plantation and rice field waste. Based on this description, the vulnerability of Sendang Biru Beach karst land use is in Zone A and Zone B. If the exploitation of aquifer resources and land use is not controlled and controlled, it will cause water quality pollution, seawater intrusion, lowering of the groundwater level, subsidence of the collapsed soil surface. as well as drought. Therefore, land use in zones A and B, which can cause vulnerability to waste pollution in karst aquifers and karst collapse disasters due to karst desolation processes, needs attention as a material for consideration in mitigating disaster vulnerability in the Sendang Biru karst area.
Another finding in this paper is the karstification of limestone with low to moderate anomalies, which are thicker and shallower at an average topography of 90 -135 meters above sea level. The valley's north-to-south side has an average height of 0 - 90 meters above sea level. This location is a settlement where massive resistivity limestone rocks are high. In other words, the further north, the thicker and shallower it is. These conditions cause the karstification of limestone due to inundation and water recharge in the karst area. This finding supports previous research. The high resistivity anomalies in the northern and southern zones are massive overburden and limestone layers. At the same time, the exceptionally high resistivity anomaly is located in the western zone of the lower zone and the eastern central zone in the form of massive and fresh limestone [20]. This condition has also been described in research [26], that the surface topography is greatly influenced by underground dissolution, which causes depression or collapses as a karst disaster. The existence of a complex geological landscape will cause a large number of karst phenomena to occur, such as dolines, sinkholes, and caves. Thus, knowledge of conduit flow systems used by policymakers to ensure civil security in densely populated areas is critical [27]. Then the study [28] added that the benefits ensure security, efficiency, and convenience of economic activity and areas likely to experience certain geo-hazards, especially detecting karst cavities.
As a comparison, the method used in this paper differs from that of other researchers. Integrated geophysical methods detect the dissolution of rocks such as anhydrite, gypsum, limestone, and dolomite. According to the study [29], this dissolution will enlarge the fracture or pore space and eventually produce cavities and caves in the karst rock as a cause of the catastrophic collapse. Then geophysical exploration methods are used to obtain information about the subsurface rock layers' structure and the karst environment's high heterogeneity [12, 30]. Here, a combination of ERT and MT methods is used to investigate the presence of karst below the surface. In this case, the ERT method can provide an image of a local location with a penetration depth of up to 40m. Meanwhile, the MT method is used to obtain a regional description of the location of significant depth penetration of the rock layer structure.
1. The combination of ERT and MT methods can be used to determine the characteristics of karstification zoning and subsurface aquifer zones. In this case, the Sendang Biru coastal area has been investigated, which is dominated by housing, plantations, and agricultural land scattered along the surface of the karst aquifer.
2. Investigation of zones A, B, and C, which have low, medium, and high resistivity, indicates the presence of aquifers. The existence of a karstification process in the basin area has the potential to cause a karst disaster hazard. Zone A and Zone B are potential locations for the presence of karst aquifers and for karstification processes that can potentially cause a karst disaster hazard, generally located in basin areas. Zone C is interpreted as massive limestone in the form of very massive karst limestone, a karst cliff area in the form of empty dry forest land.
3. If not managed and controlled in zones A and B, it will create a karst disaster mitigation zone in the form of waste pollution and karst collapse due to plantation activities, rice fields, and settlement development.
4. The results of this investigation reinforce previous research on the existence of karstification zones and conduit aquifer zones in the Karst area of Sendang Biru Beach. In this case, the eastern part, dominated by limestone, has experienced cracks and has been inserted by sandy marl clay, gravel, sand, and weathering layers with relatively high-water content. At the same time, the inundated karst aquifers are scattered in a circular pattern with different depths interspersed with limestone, which causes a heterogeneous karstification process in the Wonosari formation
Thanks to the University of Brawijaya Geophysics Survey team, Head of the Geophysics Laboratory of the Faculty of Mathematics and Natural Sciences, University of Brawijaya, Head of the FPIK Marine Station Laboratory of Brawijaya University for using the MT Metronix ADU-07e tool and the Physics Department of FST UIN Maulana Malik Ibrahim for borrowing and using the Georesistivitymeter mod.M.A.E.A6000E tool, and Ministry of Research, Technology and Higher Education BPPDN 2019 scholarship support.
[1] Sahrina, A., Fitrianti, D., Suprianto, A., Labib, M.A. (2020). Potential and challenges of karst water resources in Sumbermanjing Wetan District of Malang Regency. In IOP Conference Series: Earth and Environmental Science, 412(1): 012032. https://doi.org/10.1088/1755-1315/412/1/012032
[2] Cahyadi, A., Haryono, E., Adji, T.N., Widyastuti, M., Riyanto, I.A., Naufal, M., Ramadhan, F. (2020). Allogenic River in the hydrogeological system of Gremeng Cave, Gunungsewu Karst Area, Java Island, Indonesia. In IOP Conference Series: Earth and Environmental Science, 448(1): 012018. https://doi.org/10.1088/1755-1315/448/1/012018
[3] Youssef, A.M., Zabramwi, Y.A., Gutiérrez, F., Bahamil, A.M., Otaibi, Z.A., Zahrani, A.J. (2020). Sinkholes induced by uncontrolled groundwater withdrawal for agriculture in arid Saudi Arabia. Integration of remote-sensing and geophysical (ERT) techniques. Journal of Arid Environments, 177: 104132. https://doi.org/10.1016/j.jaridenv.2020.104132
[4] Redhaounia, B., Ilondo, B. O., Gabtni, H., Sami, K., Bédir, M. (2016). Electrical Resistivity Tomography (ERT) applied to Karst carbonate aquifers: Case study from Amdoun, Northwestern Tunisia. Pure and Applied Geophysics, 173(4): 1289-1303. https://doi.org/10.1007/s00024-015-1173-z
[5] Nunes, L.M., da Silva, C.C.N., Lucena, L.R. (2016). Application of the electrical resistivity method to identify karst features: Geotechnical and/or geoenvironmental implications for hydrocarbon exploration areas. Brazilian Journal of Geophysics, 34(1): 49-63. http://dx.doi.org/10.22564/rbgf.v34i1.374
[6] Sun, H., Cheng, M., Su, C., Li, H., Zhao, G., Su, M., Li, S., Zhnag, B., Zhang, L., Li, K. (2017). Characterization of shallow karst using electrical resistivity imaging in a limestone mining area. Environmental Earth Sciences, 76: 1-9. https://doi.org/10.1007/s12665-017-7112-9
[7] Kidanu, S., Varnavina, A., Anderson, N., Torgashov, E. (2020). Pseudo-3D electrical resistivity tomography imaging of subsurface structure of a sinkhole—A case study in Greene County, Missouri. AIMS Geosciences, 6(1): 54-70. https://doi.org/10.3934/geosci.2020005
[8] Prins, C., Thuro, K., Krautblatter, M., Schulz, R. (2019). Testing the effectiveness of an inverse Wenner-Schlumberger array for geoelectrical karst void reconnaissance, on the Swabian Alb high plain, new line Wendlingen–Ulm, Southwestern Germany. Engineering Geology, 249: 71-76. https://doi.org/10.1016/j.enggeo.2018.12.014
[9] Elfakih, T.A., Bahi, L., Akhssas, A., Ouadif, L., Benkmil, R. (2020). Electrical resistivity tomography contribution to the characterization of underground cavities in the region of Safi, Morocco. In E3S Web of Conferences, 150: 03023. https://doi.org/10.1051/e3sconf/202015003023
[10] Tarabees, E.A., Tewksbury, B.J., Mehrtens, C.J., Younis, A. (2017). Audio-magnetotelluric surveys to constrain the origin of a network of narrow synclines in Eocene limestone, Western Desert, Egypt. Journal of African Earth Sciences, 136: 168-175. https://doi.org/10.1016/j.jafrearsci.2017.03.001
[11] Foudili, D., Bouzid, A., Berguig, M.C., Bougchiche, S.S., Abtout, A., Guemache, M.A. (2019). Investigating karst collapse geohazards using magnetotellurics: A case study of M'rara basin, Algerian Sahara. Journal of Applied Geophysics, 160: 144-156. https://doi.org/10.1016/j.jappgeo.2018.11.011
[12] Patel, P., Mohan, K., Chaudhary, P. (2020). Estimation of sediment thickness (including Mesozoic) in the western central part of Kachchh Basin, Gujarat (India) using Magnetotellurics. Journal of Applied Geophysics, 173: 103943. https://doi.org/10.1016/j.jappgeo.2020.103943
[13] Abd El_Hameed, A.G., El-Shayeb, H.M., El-Araby, N.A., Hegab, M.G. (2017). Integrated geoelectrical and hydrogeological studies on Wadi Qena, Egypt. NRIAG Journal of Astronomy and Geophysics, 6(1): 218-229. https://doi.org/10.1016/j.nrjag.2017.03.003
[14] Liu, B., Liu, Z., Li, S., Nie, L., Su, M., Sun, H., Fan, K., Xhang, X., Pang, Y. (2017). Comprehensive surface geophysical investigation of karst caves ahead of the tunnel face: A case study in the Xiaoheyan section of the water supply project from Songhua River, Jilin, China. Journal of Applied Geophysics, 144: 37-49. https://doi.org/10.1016/j.jappgeo.2017.06.013
[15] Gan, F., Han, K., Lan, F., Chen, Y., Zhang, W. (2017). Multi-geophysical approaches to detect karst channels underground—A case study in Mengzi of Yunnan Province, China. Journal of Applied Geophysics, 136: 91-98. https://doi.org/10.1016/j.jappgeo.2016.10.036
[16] Gao, Y., Gao, J., Yue, J., Zhang, Y. (2020). Detecting karst collapses of limestone coalbed in Datong coal fields (China) using a comprehensive geophysical method. IOSR Journal of Applied Geology and Geophysics (IOSR-JAGG), 8(3): 1-10. https://doi.org/10.9790/0990-0803020110
[17] Susilo, A., Sutanhaji, A.T., Fitriah, F., Hasan, M.F. (2017). Identification of underground river flow in karst area using geoelectric and self-potential methods in Druju Region, southern Malang, Indonesia. International Journal of Applied Engineering Research, 12(21): 10731-10738.
[18] Wahid, A., Susilo, A. (2022). Initial evaluation of land use potential using geospatial analysis at Sendang Biru Beach, Malang Regency, East Java Province, Indonesia. In Journal of Physics: Conference Series, 2165(1): 012021. https://doi.org/10.1088/1742-6596/2165/1/012021
[19] Reynolds, J.M. (2011). An Introduction to Applied and Environmental Geophysics. John Wiley & Sons.
[20] Wahid, A., Sunaryo, Susilo, A., Wiyono. (2022). Identification of karstification zoning and aquifer channels in karst basin at Sendang Biru Beach, Malang-Indonesia: A case study. International Journal of Design & Nature and Ecodynamics, 17(3): 391-400. https://doi.org/10.18280/ijdne.170309
[21] Gao, Q., Wang, S., Peng, T., Peng, H., Oliver, D.M. (2020). Evaluating the structure characteristics of epikarst at a typical peak cluster depression in Guizhou plateau area using ground penetrating radar attributes. Geomorphology, 364: 107015. https://doi.org/10.1016/j.geomorph.2019.107015
[22] Song, K., Yang, G., Wang, F., Liu, J., Liu, D. (2020). Application of geophysical and hydrogeochemical methods to the protection of drinking groundwater in karst regions. International Journal of Environmental Research and Public Health, 17(10): 3627. https://doi.org/10.3390/ijerph17103627
[23] Artugyan, L., Urdea, P. (2016). A complex approach in the interdisciplinary field of karst geomorphology. The case study of Anina karst area (Banat Mountains, Romania). Forum Geografic, 15(1): 16-24. http://dx.doi.org/10.5775/fg.2016.065.i
[24] Dai, J., Lei, M. (2018). Standard guide for karst collapse investigation and its technical essential. Environmental Earth Sciences, 77: 1-8. https://doi.org/10.1007/s12665-018-7288-7
[25] Petrič, M., Ravbar, N., Gostinčar, P., Krsnik, P., Gacin, M. (2020). GIS database of groundwater flow characteristics in carbonate aquifers: Tracer test inventory from Slovenian karst. Applied Geography, 118: 102191. https://doi.org/10.1016/j.apgeog.2020.102191
[26] Ilias, F., Florina, C., Horia, M., Dumitru, I., Lidia, N. (2018). Geophysical investigation of the near surface groundwater flow in the area of meledic plateau (buzau county, romania): Preliminary results. International Multidisciplinary Scientific GeoConference: SGEM, 18(1.1): 833-840. https://doi.org/10.5593/sgem2018/1.1/S05.104
[27] Martel, R., Castellazzi, P., Gloaguen, E., Trépanier, L., Garfias, J. (2018). ERT, GPR, InSAR, and tracer tests to characterize karst aquifer systems under urban areas: The case of Quebec City. Geomorphology, 310: 45-56. https://doi.org/10.1016/j.geomorph.2018.03.003
[28] Caselle, C., Bonetto, S., Comina, C., Stocco, S. (2020). GPR surveys for the prevention of karst risk in underground gypsum quarries. Tunnelling and Underground Space Technology, 95: 103137. https://doi.org/10.1016/j.tust.2019.103137
[29] Miensopust, M.P., Igel, J., Günther, T., Dlugosch, R., Hupfer, S. (2015). Electric and electromagnetic investigation of a karst system. In Near Surface Geoscience 2015-21st European Meeting of Environmental and Engineering Geophysics, 2015(1): 1-5. https://doi.org/10.3997/2214-4609.201413704
[30] Villela-y-Mendoza, A., Perez-Flores, M.A., Ochoa-Tinajero, L.E., Vargas-Huitzil, E. (2021). Applying resistivity (dipole-dipole, Schlumberger, and Wenner) joint inversion to detect endokarst features in Quintana Roo, México. Journal of South American Earth Sciences, 106: 103041. https://doi.org/10.1016/j.jsames.2020.103041