Siti Ika Fitrasyah*![]() | Ariani
| Ariani![]() | Oktaviami Tarabu
| Oktaviami Tarabu![]() | Nurdin Rahman
| Nurdin Rahman![]() | I Made Tangkas
| I Made Tangkas![]() | Nikmah Utami Dewi
| Nikmah Utami Dewi![]() | Ummu Aiman
| Ummu Aiman![]() | Nurulfuadi
| Nurulfuadi![]() | Linda Ayu Rizka Putri
| Linda Ayu Rizka Putri![]() | Devi Nadila
| Devi Nadila![]() | Fendi Pradana
| Fendi Pradana![]() | Aulia Rakhman
| Aulia Rakhman![]() | Hijra
| Hijra![]() | Kurniawati Mappiratu
| Kurniawati Mappiratu![]()
© 2023 IIETA. This article is published by IIETA and is licensed under the CC BY 4.0 license (http://creativecommons.org/licenses/by/4.0/).
OPEN ACCESS
The increased prevalence of hyperglycemia, characterized by excessive glucose in the blood plasma, accentuates the need for dietary strategies tailored towards its prevention. Individual glucose tolerance and renal glucose threshold primarily influence the variable definition of hyperglycemia in diabetes patients. The current investigation assesses the nutrient composition, glycemic index, acceptability, and appropriate serving size of various steamed sponge cake renditions, targeting an optimized approach towards hyperglycemia prevention. A comparative analysis method served to evaluate the energy value and nutrient levels of a research-formulated sponge cake (F0), integrating Ambon banana peel flour and dates, alongside three commercial alternatives (F1-F3). This analysis encompassed carbohydrate, protein, fat, and crude fiber contents. Concurrently, the glycemic index value was ascertained via a one-shot case study design, employing eight healthy female subjects for an empirical assessment. An ensuing descriptive analysis was utilized to define the serving size. It was observed that F0 manifested lower energy and carbohydrate levels, but demonstrated diminished protein, fat, and crude fiber concentrations relative to F1-F3. F0 also met the classification criteria for a low glycemic index product. The product yielded an acceptability score of 5 (acceptable), with an established serving size of 80 g. The study therefore suggests that the research-formulated sponge cake comprised of Ambon banana peel flour and dates offers a balanced nutrient profile, a low glycemic index, and considerable acceptability, thereby positioning it as a potential dietary tool for hyperglycemia prevention. A serving size of 80 g per serving is recommended.
Ambon banana peel flour, snack, dates, glycemic index, hyperglycemia, sponge cake
Hyperglycemia, characterized by an excessive concentration of circulating glucose in blood plasma, presents a critical health concern, especially among individuals with diabetes [1]. Due to varying renal thresholds of glucose and glucose tolerance levels, the hyperglycemic range can differ between individuals [1]. High glycemic index foods, such as white bread, undergo rapid digestion and induce significant blood sugar fluctuations. In contrast, low glycemic index foods like whole oats are slower to digest, leading to a gradual increase in blood sugar levels. A diet rich in high-glycemic-index foods, known to cause pronounced spikes in blood sugar, is linked to an increased risk of type 2 diabetes [2] and overweight conditions [3].
As of 2014, diabetes afflicted 8.5% of adults aged 18 and over. By 2019, diabetes was implicated in 1.5 million deaths, with almost half of these occurring in individuals under 70 years of age. Diabetes was also associated with 460,000 deaths from kidney disease, and elevated blood glucose contributed to approximately 20% of cardiovascular deaths [4]. Research by Audina et al. [5] identified a significant correlation (p = 0.039; p < 0.05) between fiber intake and blood sugar levels in patients with Type 2 Diabetes Mellitus (T2DM).
The Ambon banana, native to and widely consumed in Indonesia, has garnered interest for its potential dietary benefits [6]. Proverawati et al. [6] assessed the nutritional content of Ambon banana peels, revealing notable levels of water (69.93%), carbohydrates (25.09%), fats (1.38%), proteins (1.30%), and fiber (12.2%). Oryza et al. [7] demonstrated the feasibility of converting Ambon banana peel into a long shelf-life flour, suitable for food products such as steamed sponge cake, which contains a considerable level of fiber (10.74%) when dried for 6 hours at 60℃.
Dates, being natural sweeteners with a low glycemic index, are favored for their palatable taste. Banana peel flakes, particularly from Musa balbisiana Colla, have been observed to reduce blood glucose concentrations in diabetic rats [8] and body weight [9] due to their flavonoid content [10]. Additionally, resistant starch found in banana peels is understood to enhance metabolic health by lowering inflammatory mediators [11], which may aid in glucose homeostasis and insulin resistance. Consequently, banana peels, due to their high resistant starch content, offer dietary fiber benefits, slow digestion, and low glycemic index [12].
Sukari dates, commonly consumed, were found by AlGeffari et al. [13] to contain total sugars at a level of 78.5 g/100 g, yet with a low glycemic index value of 43.4. Despite its high sugar content, date consumption was reported not to significantly impact blood glucose levels due to their low glycemic index [14]. Additionally, the introduction of dates as an adjunct therapy in T2DM patients has been suggested due to their antihyperglycemic effect, capable of reducing HbA1c levels in the blood [15].
The current study undertakes an investigation into the nutritional profile, glycemic index, acceptability, and serving size of a research-formulated sponge cake (F0), which integrates Ambon banana peel flour and dates, compared with three commercially available alternatives (F1, F2, F3). The findings from this study will contribute to the development of potential dietary strategies to combat hyperglycemia.
A variety of instruments were employed in the present study, with tools such as knives, scales, an Eyela NDO-400 oven, a Coco CB802 blender, and 80 mesh cloth utilized in the formulation of Ambon banana peel flour. In the preparation of the steamed sponge cake derived from Ambon banana peel flour and dates, tools such as scales, dough bowls, spoons, stoves, steam pans, cake molds, and a Philips HR1538/80 mixer were utilized. Furthermore, an array of analytical tools, including an analytical balance, oven, electric furnace, sintered glass No.1, closed test tube (50 ccs), measuring cup, vacuum pump, and water heater were engaged in nutrient analysis. Blood glucose analysis required the use of auto-check, glucose analysis strips, lancets, surgical gloves, and alcohol swabs, while serving sizes were determined using paper, stationery, and a calculator.
Several materials were incorporated in the process of formulating Ambon banana peel flour, such as the peels of the Ambon banana and a 1,000 ppm sodium bisulfite solution. Ingredients in the steamed cake formulation included Ambon banana peel flour, wheat flour, dates, low-fat liquid milk, eggs, baking soda, vanilla, and emulsifiers. Furthermore, a wide range of substances was used in nutrient content analysis, including 0.3 N H2SO4, 1.5 N NaOH, alcohol, concentrated H2SO4, fat solvent, 3% HCl, 30% NaOH, PP indicator, 20% Potassium Iodide, 25% H2SO4, 0.1 N Tio solution, 0.05% starch solution, and Luff solution. For the analysis of the glycemic index, a blood sample was used to construct a blood sugar response curve over a 2-hour period.
Approval for the study protocol was obtained from the Medical and Health Research Ethics Committee (6263/UN28.1.30/KL/2021). All participants in the study provided informed consent prior to their participation.
The methodology employed in this study was descriptive laboratory in nature. A proximate analysis method was used for nutrient analysis, assessing levels of carbohydrates, protein, fat, and crude fiber. The glycemic index analysis utilized a one-shot case study design, where blood glucose levels were measured after subjects consumed the reference food, plain bread, and the intervention food at intervals of 0, 30, 60, 90, and 120 minutes. The determination of serving sizes was achieved using a descriptive analysis method.
The research stages commenced with the formulation of Ambon banana peel flour; this was followed by the creation of a steamed sponge cake based on the banana peel flour and dates; analysis of the energy value and carbohydrate, protein, fat, and crude fiber level; acceptability analysis; and finally, the determination of serving sizes.
2.1 Sample preparation
2.1.1 Ambon banana peel flour formulation
The methodology for the formulation of Ambon banana peel flour followed the procedure of the study [6]. 1 kg of Ambon banana peel was sliced into 0.5 cm thick pieces, thoroughly washed, and soaked in a 1,000 ppm sodium bisulfite solution for 30 minutes to inhibit browning. The banana peels were then dried either in an oven at 60℃ for 7 hours or under sunlight for three days. Post-drying, the banana peels were processed in a blender at high speed (20,000 rpm) for three minutes and sifted using an 80-mesh sieve to produce fine flour, yielding Ambon banana peel flour.
2.1.2 Steamed sponge cake formula based on Ambon banana peel flour and dried dates
The procedure for the formulation of the steamed sponge cake was based on the method proposed by Oryza et al. [7]. Ingredients were measured as follows: 160 g Ambon banana peel flour, 40 g wheat flour, 200 g date flesh, four eggs (200 g), 200 g low-fat liquid milk, ½ tsp baking powder, ½ tsp vanilla, and 1 tsp emulsifier. The ingredients were mixed using a mixer for 15 minutes until the dough expanded. The emulsifier was then added and the mixture was further processed. The flour was then slowly added to the mixture, followed by the addition of baking powder. The resulting mixture was poured into a cake mold and steamed for 25 minutes over medium heat until cooked and fluffy. The steamed sponge was then ready for serving. The corresponding codes for all steamed sponge samples are presented in Table 1.
Table 1. Steamed sponge formula code
|
Sample Codes |
Formulas Name |
|
F0 |
steamed sponge cake based on Ambon banana peel flour and dates |
|
F1 |
brown sugar steamed sponge cake with Golden Bakery brand |
|
F2 |
pandan steamed sponge cake with Happy Bread brand |
|
F3 |
vanilla steamed sponge cake with Coco Bakery brand |
2.2 Energy value and nutrients level analysis
2.2.1 Energy value
Determination of the energy value of food was achieved through calculations based on the composition of carbohydrates, fats, and proteins, utilizing the Atwater Factor [16].
2.2.2 Nutrients level analysis
Carbohydrate content was analyzed using the Anthrone-Sulphate method [17], while protein content was assessed via a spectrophotometric method [18]. The level of fat was determined using the Soxhlet method, and crude fiber levels were analyzed using the gravimetric method [19].
2.3 Hedonic evaluation
Acceptability of the food items was determined utilizing a hedonic rating test. Scoring was assigned as follows: a score of 6 for perfectly acceptable, 5 for acceptable, 4 for slightly acceptable, 3 for neutral, 2 for unacceptable, and 1 for completely unacceptable, following the methods outlined by Dwi et al. [20]. Selection criteria for the panelists included active student status in the Nutrition Study Program, Faculty of Public Health, Tadulako University, completion of Food Materials Science and Food Technology courses, good health condition without afflictions such as flu, COVID-19, cough, digestive problems, and absence of food allergies. The panelists should also have neutral preference for the served food. Panelists suffering from any illness were excluded from the study.
Food acceptance was measured using a hedonic rating test with a given score for each scale. For a scale of 6 (perfectly acceptable), a scale of 5 (acceptable), a scale of 4 (slightly acceptable), a scale of 3 (neutral), a scale of 2 (unacceptable), and a scale of 1 (totally unacceptable). Refers to Dwi et al. [20], the acceptance test in this study employed 25 semi-trained panelists. The inclusion criteria were as follows:
Meanwhile, panelists who were sick were excluded from the study.
2.4 Glycemic index assessment
The value of the glycemic index was determined by comparing the blood glucose response from the area under the curve of the food test with a reference food as described by Rimbawan and Siagian [21]. The inclusion criteria were healthy subjects aged 18-30 years, of either gender, with a normal Body Mass Index (BMI) = 18.5–22.9 kg/m2, and who had given informed consent. The exclusion criteria included no history of diabetes mellitus, absence of digestive disorders, non-use of illegal drugs, abstinence from alcoholic beverages, and non-smoking. Subjects were required to fast for approximately 10 hours (water allowed) and capillary blood samples were taken at set intervals following the administration of the test/reference food [22]. The amount of food given to the subjects was calculated using the carbohydrate level approach, taking into account dietary fiber [21]. The quantity of food portions administered to the test subjects was determined by converting the difference in carbohydrate levels and dietary fiber content, utilizing the following formula:
Number of servings (gram)$=\frac{50 \text { grams } \times 100}{\text { carbohydrates by difference }- \text { dietary fibre }}$ (1)
The procedure followed for glycemic index determination was as per Whistler and BeMiller [23].
2.5 Serving size determination
The serving size was decided to ascertain the quantity of steamed sponge that should be consumed to conform to standard guidelines. This was done in accordance with the Nutrition Label Reference for age and general conditions and the Regulation of the Food and Drug Supervisory Agency Number 22 of 2019 concerning Information on Nutritional Values on Processed Food Labels, as well as the recommendation from The IOM [24, 25].
2.6 Statistical analysis
Data pertaining to energy and nutrients, which included proteins, fats, carbohydrates, and crude fibers, were analyzed using One Sample T-Test in IBM® SPSS® Statistics Version 26 Licensed Material, Property of IBM Corp [19]. Acceptability test data analysis was carried out by calculating the average scores for each parameter such as color, aroma, taste, and texture from all panelists. To analyze the glycemic index, the area under the curve between the intervention/test food and the reference food (bread) was compared using Microsoft Excel 2010, and calculated using the following formula [26]:
$\mathrm{L}=\frac{\Delta 30 t}{2}+\Delta 60 t+\frac{(\Delta 30-\Delta 60) t}{2}+\Delta 90 t+\frac{(\Delta 60-\Delta 90) t}{2}+\Delta 120 t+\frac{(\Delta 90-\Delta 120) t}{2}$ (2)
where,
L=Area under the curve,
t=Time interval of blood collection (30 minutes),
∆30=The difference in blood glucose levels 30 minutes after the load with fasting,
∆60=Difference in blood glucose levels 60 minutes after the load with fasting,
∆90=Difference in blood glucose levels 90 minutes after the load with fasting,
∆120=Difference in blood glucose levels 120 minutes after the load with fasting.
The glycemic index value was computed using the formula [27]:
Glycemic index$=\frac{(\text { The area under the blood glucose response curve in the body after } 2 \text { hours to the test food })} {(\text { The area under the blood glucose response curve in the body after } 2 \text { hours to the reference food })} \;\;\;\;\;\;\;\;\;\;\;\;\;\; \times 100$ (3)
Finally, the data were compiled, tabulated, and analyzed in a descriptive manner.
3.1 Energy value
The experimental data demonstrates that the energy value of the product, denoted as F0, yields 248.4 kcal, exceeding the 10% reference energy standard (2,150 kcal) stipulated by the Indonesian Nutrition Label Reference (INLR). Statistical analysis of the energy value reveals a p-value less than 0.001, thus asserting a significant deviation from the energy value intrinsic to the standard steamed sponge cake (Refer to Table 2). The marginal escalation in energy value, compared to the INLR standard, is potentially attributed to the incorporation of 20% wheat flour in the product. Wheat flour, noted for its energy value of 350 kcal/100 g, is substantially higher than that of Ambon banana peel flour, which is recorded at 117 kcal/100 g as per Proverawati et al. [6]. Another contributing factor to the augmented energy value might be the substitution of sugar with dates in the steamed sponge cake formulation. As documented by Siddeeg et al. [28], Sukari dates exhibit an energy value of 342 kcal/100 g.
Table 2. Energy value and nutrient levels (100 g)
|
Samples |
Energy Value (kcal) |
± 10% Reference Energy (2,150 kcal) |
p-value |
|
F0 |
248.4 |
193.5 – 236.5 |
0.001 |
|
F1 |
273.6 |
||
|
F2 |
280.2 |
||
|
F3 |
284.9 |
||
|
Samples |
Carbohydrate Level (g) |
± 10% Reference Carbohydrate (325 g) |
p-value |
|
F0 |
42.4 |
29.3 – 35.3 |
0.001 |
|
F1 |
52.3 |
||
|
F2 |
54.5 |
||
|
F3 |
56.4 |
||
|
Samples |
Protein Level (g) |
± 10% Reference Protein (60 g) |
p-value |
|
F0 |
8.7 |
5.4 – 6.6 |
0.001 |
|
F1 |
6.9 |
||
|
F2 |
7.2 |
||
|
F3 |
7.9 |
||
|
Samples |
Fat Level (g) |
± 10% Reference Fat (67 g) |
p-value |
|
F0 |
4.8 |
6.0 – 7.3 |
0.002 |
|
F1 |
4.0 |
||
|
F2 |
3.6 |
||
|
F3 |
3.0 |
||
|
Samples |
Crude Fiber Level (g) |
± 10% Reference Crude Fiber (30 g) |
p-value |
|
F0 |
20.3 |
2.7 – 3.3 |
0.420 |
|
F1 |
1.2 |
||
|
F2 |
1.3 |
||
|
F3 |
1.3 |
3.2 Nutrient concentrations
3.2.1 Carbohydrate content
The results indicate that F0 contains a carbohydrate concentration of 42.4 g/100 g, which exceeds the INLR's standard 10% reference carbohydrates (325 g). The carbohydrate analysis yielded a p-value less than 0.001, denoting a significant discrepancy from the standard steamed sponge cake's carbohydrate concentration (Refer to Table 2). The enhanced carbohydrate concentration is likely due to the 20% wheat flour content, which has a higher carbohydrate concentration (75 g/100 g) compared to that of Ambon banana peel flour, at 25.1 g/100 g, according to Proverawati et al. [6]. The replacement of sugar with dates may also impact the carbohydrate content of the steamed sponge cake. As documented by Siddeeg et al. [28], Sukari dates have a carbohydrate content of 78.3 g/100 g.
3.2.2 Protein content
The protein content in F0 was found to be 8.7 g/100 g, surpassing the INLR's 10% standard reference protein (60 g). A p-value less than 0.001 was obtained from the protein content analysis, signifying a significant variation from the standard steamed sponge cake's protein content (Refer to Table 2). The rise in protein content can likely be attributed to the use of 20% wheat flour and liquid milk. According to Proverawati et al. [6], wheat flour contains 10 g/100 g protein, which is significantly higher than that of Ambon banana peel flour, recorded as 1.3 g/100 g. Furthermore, based on the Table of Indonesian Food Composition (TIFC) of 2017, liquid milk, utilized in this study, contains 4 g/100 g protein [29].
3.2.3 Fat content
The obtained data suggests that the fat content of F0 equals 4.8 g/100 g, which is lesser than the INLR's 10% standard reference fat (67 g). The fat content analysis yielded a p-value of 0.002, thus implying a significant divergence from the steamed sponge cake's fat content (Refer to Table 2). The diminished fat content might be due to the selection of low-fat raw materials, and the absence of added fats like cooking oil, butter, or margarine. According to the TIFC of 2017, low-fat liquid milk, incorporated in the product, contains 1.2 g/100 g fat [29].
3.2.4 Crude fiber level
The research findings highlight a crude fiber content of 20.3 g/100 g in F0, surpassing the INLR's 10% standard reference crude fiber (30 g). The crude fiber content analysis yielded a p-value of 0.42, hence no significant difference was observed when compared with the steamed sponge cake's crude fiber content (Refer to Table 2). A product is considered high in fiber when it has a fiber level of no less than 6 g/100 g (in solid form) and 3 g/100 g (in liquid form) [24]. The elevated fiber content in the steamed sponge cake might be attributed to the use of Ambon banana peel flour as a primary ingredient, and the substitution of sugar with dates. As per the Table of Indonesian Food Composition 2017, Sukari dates contain 3.2 g/100 g fiber, unlike white sugar which lacks fiber content [6, 28, 29].
3.3 Acceptability analysis
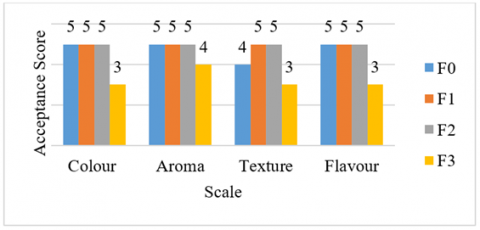
A hedonic evaluation was conducted with the assistance of a panel consisting of 25 untrained participants, three of whom were male, and 22 female. The panel was comprised of students from the Nutrition study program at Tadulako University, with an average age of 21. The most accepted formula, as demonstrated by the results of the hedonic test, was F1, achieving a score of 5, indicating ‘acceptable’ (see Figure 1). The product under investigation, labeled F0, was likewise assessed as ‘acceptable’, achieving an equivalent score of 5.
Figure 1. Acceptability analysis of the steamed sponge cake
3.3.1 Colour evaluation
The F0 variant was deemed ‘acceptable’, scoring 5 in the test. The deep brown hue, characteristic of F0, can be attributed to the integration of banana peel flour and dried dates. As suggested by Shafi et al. [30], the resultant brown colouration from the banana peel flour is an effect of an enzymatic browning reaction, a reaction between oxygen and phenolic compounds catalysed by polyphenol oxidase, leading to the formation of quinones which then polymerise into brown melanin pigments.
3.3.2 Aroma assessment
In the context of aroma, F0 was the most favored formula, achieving a score of 5 (‘acceptable’). The scent of F0 predominantly highlighted the fragrances of banana and vanilla. The importance of scent in food acceptability is emphasized by Boesveldt and de Graaf [31], stating its role in determining an individual’s appraisal and quality assessment when encountering novel food items.
3.3.3 Texture analysis
The texture of a food product, as defined by Shewfelt [32], is the sensory perception of pressure in the mouth (during biting, chewing, and swallowing) or when touched by the fingers. F0 secured a score of 4 (‘slightly acceptable’), with a somewhat fibrous texture as a consequence of the banana peel flour and dates, which retain a certain degree of roughness upon grinding. It has been observed that the texture and consistency of ingredients can influence taste perception by affecting the stimulation rate of olfactory receptor cells and salivary glands.
3.3.4 Flavor examination
Breslin [33] suggests that taste has a substantial impact on the acceptance of a food product. Even if other sensory elements such as aroma, colour, and texture are appealing, if the taste does not resonate with the consumer, the product is likely to be rejected. The likability assessment of the steamed sponge taste was based on individual preference. The taste of the product, notably sweet, is a consequence of the incorporation of brown sugar in the raw ingredients. In this category, F0 achieved a score of 4 (‘slightly acceptable’).
3.4 Glycemic index assessment
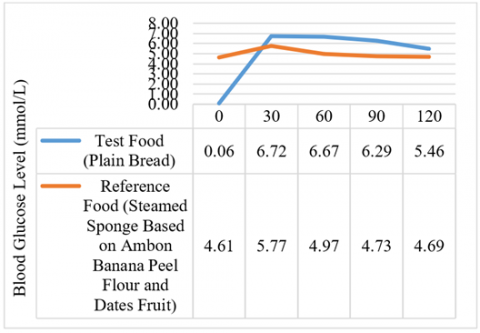
The categorization of glycemic index values, as outlined by Rimbawan and Siagian [21], comprises three divisions: low glycemic index (<55), moderate glycemic index (55-70), and high glycemic index (>70). In accordance with this classification, the product under investigation fell within the low category (<50). The low glycemic index value of the steamed sponge cake is believed to be attributable to its elevated fiber content of 20.3 g/100 g. Mean blood glucose levels of subjects can be seen in Figure 2.
Zafar et al. [34] posited a correlation between fiber intake and fasting blood glucose levels in patients with Type 2 Diabetes Mellitus. Dietary fiber has the potential to decelerate food transit within the digestive tract and inhibit enzyme activity, thus slowing down the digestion process, particularly of starch. This delayed digestive process results in a slower increase in blood glucose levels, leading to a lower glycemic index.
Undigested dietary fiber arrives in the large intestine intact, where it undergoes fermentation by resident bacteria, resulting in the production of Short-Chain Fatty Acids (SCFA). The generation of these SCFAs triggers the secretion of hormones such as Glucagon Like Peptide-1 (GLP-1), Gastric Inhibitory Polypeptide (GIP), and Peptide YY (PYY), all of which enhance insulin sensitivity, thereby reducing blood glucose levels.
Moreover, a connection has been identified between carbohydrate and fiber intake and the prevalence of Type 2 Diabetes Mellitus. Foods with a higher glycemic index lead to a more rapid increase in blood glucose levels. Conversely, individuals with diabetes mellitus can control their blood glucose levels more effectively by consuming foods with a low glycemic index and an ample amount of dietary fiber [34].
Figure 2. Mean blood glucose levels of subjects
3.5 Serving size
The standard serving size was calculated based on energy considerations as stipulated by the Regulation of the Indonesian Food and Drug Supervisory Agency Number 22 of 2019 regarding Information on Nutritional Values on Processed Food Labels [25]. The recommended serving size of the steamed sponge was determined to be 80 g to provide 10% of the energy and nutritional value reference. The total energy, carbohydrates, protein, fat, and crude fiber in this serving size were found to be 198.7 kcal, 33.9 g, 7 g, 3.8 g, and 16.2 g, respectively. According to the Regulation of the Head of the Food and Drug Supervisory Agency of the Republic of Indonesia Number 13 of 2016, high fiber nutrient level claims are permissible when they meet the requirement of no less than 6 g/100 g [35]. The nutritional value per serving (80 g) is presented in Table 3.
For individuals diagnosed with T2DM, the regulation of meal schedule, food type, and caloric intake are important considerations [36]. Based on the Indonesian Regulation of the Food and Drug Supervisory Agency Number 22 of 2019, the recommended serving portion for bakery products is 40 to 100 g per serving. The determined serving size in this study was 80 g, which provided a total energy value of 220 kcal. This serving size fulfilled 9% of the recommended dietary allowance (RDA) for energy, 11% RDA for carbohydrates, 12% RDA for protein, 6% RDA for fat, and 53% RDA for crude fiber. The balance of nutrients indicates that the steamed sponge cake, based on Ambon banana peel flour and dates, may be a beneficial food choice for individuals with T2DM.
Table 3. Information on nutritional value per serving (80 g)
|
Nutritional Value Information |
||
|
Serving size Number of servings per pack |
80 g 1 |
|
|
Total energy Energy from fat |
200 kcal 36 kcal |
|
|
|
% RDA |
|
|
Total fat |
4 g |
6 % |
|
Protein |
7 g |
12 % |
|
Total carbohydrates |
34 g |
11 % |
|
Crude fiber |
16 g |
53 % |
*Percentage of RDA based on energy needs 2150 kcal. Your energy requirements may be higher or lower.
The steamed sponge cake, which incorporates Ambon banana peel flour and dates, has demonstrated a noteworthy blend of nutritional attributes, low glycemic index, and favorable acceptability. Consequently, it merits consideration as a prospective alternative snack with potential in mitigating hyperglycemia. A serving size of 80g is recommended for optimal benefit.
For the advancement of this research, an investigation into related variables is deemed essential. These include the micronutrient content, starch digestibility, and product longevity. Furthermore, it is vital to educate the public regarding the health advantages linked to the consumption of Ambon banana peel flour and dates. This dissemination of knowledge might pave the way for viable business opportunities or provide a broader range of snack alternatives for individuals managing hyperglycemia.
Despite the promising results, several areas warrant further investigation. An in-depth understanding of the micronutrient composition could provide additional insight into the potential health benefits of this food product. Furthermore, the digestibility of the starch content in the cake could play a role in its effect on glycemic responses. Lastly, the product's longevity, both in terms of shelf-life and sustained consumer interest, is an important area for future study.
Additionally, while the findings of this study offer potential health benefits, the larger impact on public health will only be realized through comprehensive education efforts. The promotion of Ambon banana peel flour and dates as viable food ingredients can stimulate innovation in the food industry, potentially opening up new business ventures. Furthermore, these efforts could increase the variety of snack options available to those with hyperglycemia, providing a way to manage their condition without sacrificing the enjoyment of food.
In conclusion, the steamed sponge cake, crafted with Ambon banana peel flour and dates, presents promising attributes that warrant further exploration. As it stands, this study offers a stepping stone towards more comprehensive research into this product's potential in hyperglycemia management and possibly even beyond. It also prompts discussions about the need for public education and the expansion of food industry innovation.
The author would like to thank the grant provider for supporting this research. Also, all researchers contribute to completing this research until the final writing stage.
[1] American Diabetes Association. (2014). Diagnosis and classification of diabetes mellitus. Diabetes Care, 37(S1): S81-S90. https://doi.org/10.2337/dc14-S081
[2] De Munter, J.S.L., Hu, F.B., Spiegelman, D., Franz, M., Van Dam, R.M. (2007). Whole grain, bran, and germ intake and risk of type 2 diabetes: A prospective cohort study and systematic review. PLoS medicine, 4(8): e261. https://doi.org/10.1371/journal.pmed.0040261
[3] Ebbeling, C.B., Leidig, M.M., Feldman, H.A., Lovesky, M.M., Ludwig, D.S. (2007). Effects of a low-glycemic load vs low-fat diet in obese young adults: A randomized trial. Jama, 297(19): 2092-2102. https://doi.org/10.1001/jama.297.19.2092
[4] Global Burden of Disease Collaborative Network. (2020). Global burden of disease study 2019. Institute for Health Metrics and Evaluation. https://vizhub.healthdata.org/gbd-results
[5] Audina, M., Maigoda, T.C., Wahyu, T. (2018). Nutritional status, physical activity and fiber intake are associated with fasting blood sugar levels in type 2 DM patients. Jurnal Ilmu Dan Teknologi Kesehatan, 6(1): 59-71. https://doi.org/10.32668/jitek.v6i1.109
[6] Proverawati, A., Nuraeni, I., Sustriawan, B., and Zaki, I. (2019). Efforts to increase the nutritional value of food through optimizing the potential of plantain peel flour, banana kepok, and banana ambon. Jurnal Gizi dan Pangan Soedirman, 3(1): 49-63. http://jos.unsoed.ac.id/index.php/jgps/article/view/1525/1044.
[7] Oryza, R.Z., Dwiloka, B., Pramono, Y.B. (2019). Effect of wheat flour substitution with Kepok banana flour (Musa Acuminata L.) on protein content, fiber content, flourishing power, and hedonic quality of steamed sponge cake. Jurnal Teknologi Pangan, 3(1): 80-85.
[8] Meliala, A., Sumiwi, Y.A.A., Narwidina, P., Rini, S.L.S., Setyaningsih, W. (2020). Banana peel flakes alleviate blood glucose and stress in a dose-dependent manner. International Journal of Pharmacy and Pharmaceutical Sciences, 12(8): 75–81. https://doi.org/10.22159/ijpps.2020v12i8.37659
[9] Jain, D., Bansal, M.K., Dalvi, R., Upganlawar, A., Somani, R. (2014). Protective effect of diosmin against diabetic neuropathy in experimental rats. Journal of integrative medicine, 12(1): 35-41. https://doi.org/10.1016/S2095-4964(14)60001-7
[10] Singh, A., Singh, S.N. (2015). Dietary fiber content of Indian diets. Asian Journal of Pharmaceutical and Clinical Research, 8(3): 58-61.
[11] Ble-Castillo, J.L., Juárez-Rojop, I.E., Tovilla-Zárate, C.A., García-Vázquez, C., Servin-Cruz, M.Z., Rodríguez-Hernández, A., Araiza-Saldaña, C.I., Nolasco-Coleman, A.M., Díaz-Zagoya, J.C. (2017). Acute consumption of resistant starch reduces food intake but has no effect on appetite ratings in healthy subjects. Nutrients, 9(7): 696. https://doi.org/10.3390/nu9070696
[12] Rodríguez-Ambriz, S.L., Islas-Hernández, J.J., Agama-Acevedo, E., Tovar, J., Bello-Perez, L.A. (2008). Characterization of a fibre-rich powder prepared by liquefaction of unripe banana flour. Food Chemistry, 107(4): 1515-1521. https://doi.org/10.1016/j.foodchem.2007.10.007
[13] AlGeffari, M.A., Almogbel, E.S., Alhomaidan, H.T., El-Mergawi, R., Barrimah, I.A. (2016). Glycemic indices, glycemic load and glycemic response for seventeen varieties of dates grown in Saudi Arabia. Annals of Saudi medicine, 36(6): 397-403. https://doi.org/10.5144/0256-4947.2016.397
[14] Alalwan, T.A., Perna, S., Mandeel, Q.A., Abdulhadi, A., Alsayyad, A.S., D’Antona, G., Rondanelli, M. (2020). Effects of daily low-dose date consumption on glycemic control, lipid profile, and quality of life in adults with pre-and type 2 diabetes: A randomized controlled trial. Nutrients, 12(1): 217. https://doi.org/10.3390/nu12010217
[15] Maulana, M.S. (2020). Efektivitas Kurma (Phoenix dactylifera) dalam menurunkan kadar HbA1c pada pasien diabetes mellitus tipe 2: Laporan Kasus Berbasis Bukti. Journal of Pharmaceutical Care Anwar Medika (J-PhAM), 3(1): 31-45. https://doi.org/10.36932/jpcam.v3i1.47
[16] Atwater, W.O., Woods, C.D., Bryant, A.P. (1906). The Chemical Composition of American Food Materials (No. 28). US Government Printing Office, USA.
[17] Koehler, L.H. (1952). Differentiation of carbohydrates by anthrone reaction rate and color intensity. Analytical Chemistry, 24(10): 1576-1579. https://doi.org/10.1021/ac60070a014
[18] Simonian, M.H. (2002). Spectrophotometric determination of protein concentration. CP Cell Biology, 15(1). https://doi.org/10.1002/0471143030.cba03bs15.
[19] Association of Official Analytical Chemists. (2005). https://www.researchgate.net/publication/292783651_AOAC_2005.
[20] Dwi, S., Apriyantono, A., Sari, M.P. (2014). Sensory Analysis for the Food Industry and Argo. PT. Penerbit IPB Press, Indonesia.
[21] Rimbawan, Siagian, A. (2004). Food Glycemic Index: An Easy Way to Choose Healthy Foods. Penebar Swadaya, Indonesia.
[22] Food and Agriculture Organization, Carbohydrates in Human Nutrition. (1997). Report of an FAO/WHO Expert Consultation on Carbohydrates. Rome (Italy): FAO.
[23] Whistler, R.L., BeMiller, J.N. (1997). Carbohydrate Chemistry for Food Scientists. St. Paul (USA): Eagan Press.
[24] Food and Drug Supervisory Agency of the Republic of Indonesia. (2016). Regulation of the Head of the Drug and Food Control Agency of the Republic of Indonesia Number 9 of 2016 Concerning Reference to Nutrition Labels.
[25] Food and Drug Supervisory Agency of the Republic of Indonesia. (2019). Regulation of the Food and Drug Supervisory Agency Number 22 of 2019 Concerning Information on Nutritional Value on Processed Food Label.
[26] Dodd, H., Williams, S., Brown, R., Venn, B. (2011). Calculating meal glycemic index by using measured and published food values compared with directly measured meal glycemic index. The American Journal of Clinical Nutrition, 94(4): 992-996. https://doi.org/10.3945/ajcn.111.012138
[27] Yahia, E.M., Carrillo-Lopez, A. (2019). Postharvest Physiology and Biochemistry of Fruits and Vegetables. Woodhead Publishing, United Kingdom.
[28] Siddeeg, A., Zeng, X.A., Ammar, A.F., Han, Z. (2019). Sugar profile, volatile compounds, composition and antioxidant activity of Sukkari date palm fruit. Journal of Food Science and Technology, 56: 754-762. https://doi.org/10.1007/s13197-018-3534-y
[29] Ministry of Health of the Republic of Indonesia, Table of Indonesian Food Composition 2017. Jakarta (ID): Ministry of Health of Indonesia Republic, 2018. https://ahligizi.id/blog/2019/05/01/tabel-komposisi-pangan-indonesia-tkpi-terbaru/.
[30] Shafi, A., Ahmad, F., Mohammad, Z.H. (2022). Effect of the addition of banana peel flour on the shelf life and antioxidant properties of cookies. ACS Food Science & Technology, 2(8): 1355-1363. https://doi.org/10.1021/acsfoodscitech.2c00159
[31] Boesveldt, S., de Graaf, K. (2017). The differential role of smell and taste for eating behavior. Perception, 46(3-4): 307-319. https://doi.org/10.1177/0301006616685576
[32] Shewfelt, R.L. (2014). Introduction to Food Science. Boca Raton, CRC Press.
[33] Breslin, P.A. (2013). An evolutionary perspective on food and human taste. Current Biology, 23(9): R409-R418. https://doi.org/10.1016/j.cub.2013.04.010
[34] Zafar, M.I., Mills, K.E., Zheng, J., Regmi, A., Hu, S.Q., Gou, L., Chen, L.L. (2019). Low-glycemic index diets as an intervention for diabetes: A systematic review and meta-analysis. The American Journal of Clinical Nutrition, 110(4): 891-902. https://doi.org/10.1093/ajcn/nqz149
[35] Food and Drug Supervisory Agency of the Republic of Indonesia. (2016). Drug and food control agency regulation number 13 of 2016 about supervision of claims on processed food labels and advertisements. Food and Drug Supervisory Agency of the Republic of Indonesia.
[36] Guidelines for the Management and Prevention of Type 2 Diabetes Mellitus in Adults in Indonesia 2021. (2021). https://pbperkeni.or.id/wp-content/uploads/2021/11/22-10-21-Website-Pedoman-Pengelolaan-dan-Pencegahan-DMT2-Ebook.pdf.