Noor Suhaiza Sauti*![]() | Mohd Effendi Daud
| Mohd Effendi Daud![]() | Masiri Kaamin
| Masiri Kaamin![]() | Suhaila Sahat
| Suhaila Sahat![]()
© 2023 IIETA. This article is published by IIETA and is licensed under the CC BY 4.0 license (http://creativecommons.org/licenses/by/4.0/).
OPEN ACCESS
Due to the complex nature of seismic vulnerability assessment, different approaches and data are required, based on the country. Alternatively, seismic vulnerability assessment can be categorized into two common techniques, the conventional and holistic methods, the use of which depends on the region’s conditions. Generally, conventional methods concern the consequences of an earthquake by estimating the potential loss caused by the structural inventory damage and the number of casualties. Meanwhile, holistic methods focus on the different primary factors that contribute to seismic vulnerability, which are represented by the social, economic, physical, and environmental elements of a community or structure in a region. However, less attention has been given to the quantitative evaluation of holistic seismic vulnerability in Malaysia compared to hazard-related research. Therefore, the aim of this study was to identify the holistic seismic vulnerability indicators in the context of an earthquake in Malaysia. Analysis is critical for understanding the numerous indicators of causes of earthquakes to define their relative relationships and the disaster risk probability. Based on the Preferred Reporting Items for Systematic Reviews and Meta-Analyses (PRISMA) reporting method, a comprehensive review of the Scopus and Web of Science databases was undertaken to search for indicators with a substantial impact on the aforementioned dimensions of earthquake vulnerability. This article concludes that there are three major elements of vulnerability (exposure, resilience, and coping capacity), comprising eighteen indicators of seismic vulnerability, in the context of earthquakes in Malaysia.
seismic vulnerability, indicator, exposure, resilience, coping capacity
The first step in addressing risk is recognizing it as a significant socioeconomic and environmental issue. Various aspects of risk, vulnerability, preparedness, and mitigation can be reflected by a diverse range of subjective indicators in a risk indicators system [1]. To estimate or measure risk, various indicators for risk analysis and risk management can be designed. The combination of the vulnerability, hazard, and capacity factors qualitatively and quantitatively reflects a region's seismic risk. The system of indicators focuses on enhancing the use and output of seismic vulnerability assessment to assist the regulatory body in identifying the optimum allocation of resources to reduce risk through disaster preparedness and mitigation. Furthermore, indicators allow countries likely to experience natural disasters to quantify key elements of vulnerability and define national risk management capacities [2]. Vulnerability index indicators are generated based on the input data and specific data sources used. Certain variables or types of information are not readily available and necessitate original research. In contrast, rote collection occurs as a regular component of data systematization at national and international levels.
The vulnerability index was developed using the current theory that defines disaster risk as the accumulation of three major components: the hazard's frequency or severity, the vulnerability, and the capacity. Issues with the indicator system are principally associated with its considerable subjectivity in the estimation and selection of variables, the measurement techniques used, and the aggregating procedures employed [3]. Furthermore, vulnerability is dynamic, varies across temporal and spatial scales, and is driven by physical, economic, social, and geographic factors [4].
Due to the multifaceted nature of vulnerability concepts, most conventional sets of indicators for seismic vulnerability assessment have been developed according to local settings and experts, and they cannot be applied to all areas. They can, however, be modified by evaluating and modifying the indicators and their associated weights [5]. Therefore, the objective of the current research was to identify a range of different indicators for seismic vulnerability assessment in the context of Malaysia. The potential indicators identified to measure vulnerability were selected via comparison indicators, allowing comparisons between different regions or communities.
The susceptibility of a community to a hazard is referred to as vulnerability. The physical, social, and economic factors that impair a community's ability to respond to hazards or disaster events are included in the prevailing conditions [6]. In addition, economic inequality, disempowerment, inadequacies, limited capacity, and a lack of resources are always associated with vulnerability. The main contributors are the use of inappropriate technologies, the lack of building code enforcement, the lack of construction designs (which is considered a disaster risk), the absence of vulnerability analysis, and unplanned urban settlements in high-risk areas.
Preparedness and mitigation strategies are used in disaster risk reduction to limit the actual or potential effects of a disaster on communities and structures, as well as economic, social, and environmental systems. Therefore, the Hyogo Framework for Action (HFA) 2005-2015 highlighted the use of vulnerability indices in addressing holistic vulnerability, capacity, and resilience assessment [7, 8].
2.1 The conceptual framework of vulnerability and proposed framework for Malaysia
In the last decade, diverse definitions of and frameworks for vulnerability have been established and applied worldwide. Among the terms introduced in the growing vulnerability literature have been resilience, adaptation, coping capacity, risk, hazard, community engagement, and adaptation regulations.
2.1.1 The double structure of vulnerability
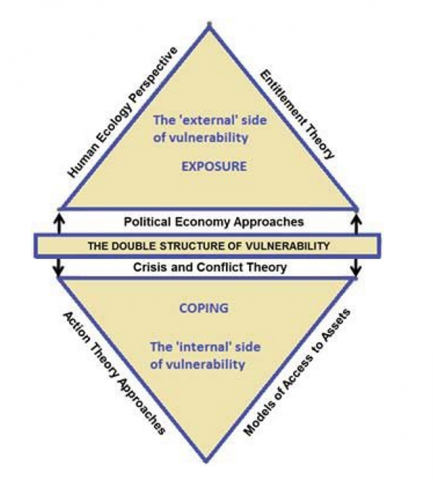
The study [9] defined vulnerability as having two sides, internal and external. The external side is concerned with risk and shock exposure, and it is influenced by the following factors (Figure 1):
a) Political and economic perspectives - social imbalances, upper-class asset control,
b) Perspectives on human ecology - population dynamics and the capacity to manage the environment and,
c) Entitlement theory - this refers, in terms of vulnerability, to people's inability to obtain or manage assets through legitimate financial means.
Figure 1. Bohle's vulnerability analysis framework [9]
Coping refers to the capacity to manage, deal with, resist, and recover from the effects of a hazard from an internal perspective. It has been influenced by three major theories: Crisis and Conflict Theory, Action Theory Approaches, and Asset Access Models. Crisis and Conflict Theory is concerned with asset and resource control, as well as the ability to manage crisis situations and handle disputes. Action Theory Approaches are concerned with how people act and react either freely or as a result of societal, economic, or governmental constraints; meanwhile, Models of Access to Assets are involved with vulnerability mitigation through access to assets.
2.1.2 Pelling model
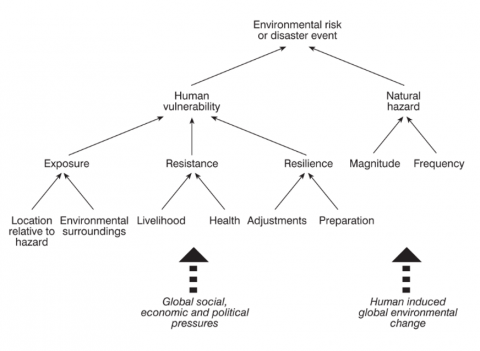
Human vulnerability is defined in the framework for vulnerability by three key aspects: exposure, resistance, and resilience. The location and characteristics of a hazard influence exposure; resistance is linked to economic, psychological, and physical health, along with the ability of individuals or communities to withstand the event's impact and maintain their livelihoods; resilience encompasses a society’s ability to withstand or adapt to adversity through spontaneous readiness and its adaptation as soon as the event manifests itself (Figure 2).
Figure 2. Proposed exposure, resistance and resilience component [10]
2.1.3 MOVE framework
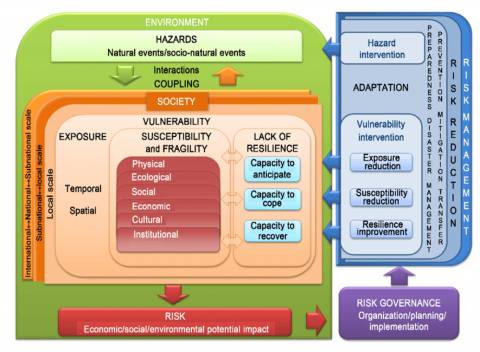
The 'Methods for Improving Vulnerability Assessment in Europe (MOVE)' conceptual framework identifies vulnerabilities and risks from natural hazards from a holistic and multidimensional perspective [11] (Figure 3). This framework defines two key concepts related to risk: first, risk is the result of a community's exposure to danger in time and space, as well as its vulnerability; second, risk management and adaptation are intended to change the initial state of weakness or hazard. A community’s level of vulnerability is determined by a combination of exposure and resilience factors. Effective risk management is influenced by aspects of identifying and understanding hazards, vulnerabilities, and risks. Risks can be caused by geological, hydrometeorological, man-made, or technological hazards. The ability of a community to anticipate, adapt to, or prepare for dangerous future events is influenced by the community's lack of resilience and reflects a community's level of vulnerability. A lack of capacity makes a society more vulnerable.
Figure 3. Exposure, susceptibility and adaptation terms [11]
2.1.4 Risk within the framework of hazard and vulnerability
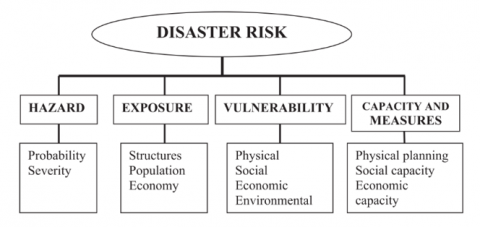
The conceptual framework defines risk within the framework of vulnerability and hazard, in which risk is viewed in the context of separate features: exposure, vulnerability, hazard, and coping capacity [12]. In other words, the risk is viewed as the sum of these features (Figure 4). Each of these features is represented by a hazard and describes the hazard's likelihood and severity, whereas exposure is described by structures, the population, and the economy. In contrast, vulnerability has social, economic, physical, and environmental consequences. Coping capacity and measures that tend to be directly linked to this include physical planning, social capacity, economic capacity, and management.
Figure 4. Risk within the framework of hazard and vulnerability [13]
In summary, a review of previous risk and vulnerability assessment models revealed a variety of vulnerability and risk perspectives; therefore, to fit the study context, the MOVE framework was adopted with slight modifications by considering the definition of vulnerability that was globally standardized by the United Nations International Strategy for Disaster Reduction (UNISDR). The vulnerability index was calculated based on vulnerability indicators to assess vulnerability, capacity, and resilience holistically. Based on the vulnerability definitions and frameworks established in previous studies, the fundamental principles of the indicators were chosen and justified as follows (Table 1):
Table 1. Vulnerability component for seismic vulnerability assessment
|
Vulnerability component |
Description |
|
Exposure |
Interpreted as the direct danger to the presence of societies, environmental system and properties, and the extent of the geographical context that could be adversely affected by disaster risk occurrence [4, 11]. Exposure is measured through an integrated understanding of how relevant factors can be combined to determine a community’s level of resilience [14, 15]. These techniques include methods for assessing the vulnerability of local societies, which are generally based on statistical data obtained from national censuses and supplemented data sources, in order to determine how they are likely to respond in the face of natural disasters. |
|
Resilience |
Expressed by a community's and system's ability to avoid, resist, withstand, and recover from natural disasters through adaptive capabilities, including the preservation and restoration of its key basic structures and services [11, 16]. The problem of inequality, which puts certain populations at greater risk, also influences response and coping techniques. |
|
Coping capacity |
Focused on the probability of a given physical component or element at risk, including available facilities and critical infrastructures to be affected during disaster events [17, 18]. The lack of coping capacity presented by the strengths, attributes and resources available within an organization, community or society to manage and respond against disaster risks and strengthen resilience [19-22]. |
2.2 Earthquake in Malaysia
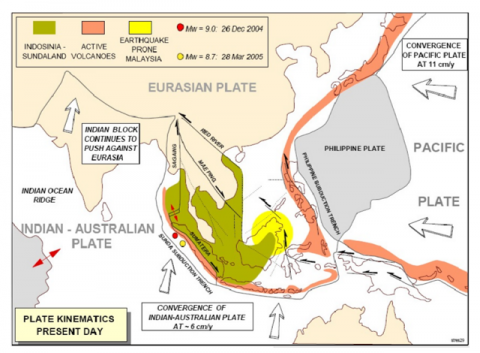
Malaysia is located on the Eurasian Plate, outside the Pacific Ring of Fire. It sits between latitudes 12°S to 20°N and longitudes 90°E to 140°E, thus bordering the Australian Plate and the Philippines Plate [23]. The region around Malaysia is classified as moderate seismic due to the proximity to areas of high seismic activity around Sumatra and the Andaman Sea [24] (Figure 5).
Figure 5. Malaysia's earthquake-prone region (Tjia, 2010 as cited in study [23])
The Malaysian Meteorological Service (MMS) of the Department of Minerals and Geosciences Malaysia (JMG) provides ongoing monitoring and updating of earthquake activity. Tremors due to Sumatran earthquakes have been reported many times over the last 30 years, with the largest geophysical earthquake disaster occurring in Ranau, Sabah in 2015. The 6.0 magnitude earthquake caused significant economic losses due to structural destruction and triggered numerous aftershocks and cascading geohazards. The severe consequences of the quake included damages to private and government buildings, cracks in utilities (drainage pipes and water tanks), partial damage to facilities (Kota Kinabalu hotels and hiking trails), landslides, debris flow, and liquefaction. Moreover, 18 deaths and several injured were reported [25]. The other three most significant earthquakes in Sabah occurred in July 1976 in the Lahad Datu-Kunak region; on May 26, 1991 in the Kundasang-Ranau region; and in 2008 in the Kunak district [25]. Sabah is the area of Malaysia most prone to earthquakes due to the series of regional and local earthquakes that have occurred due to its location in the active subduction zone consisting of the trenches of Manila, Negros, Sulu, Cotabato, and North Sulawesi.
The 1976 Lahad Datu-Kunak earthquake had a magnitude of 6.2 and resulted in structural damage to buildings such as houses, a hospital, a police complex, and water pipe and jetty structures [25]. Meanwhile, the 1991 earthquake in Kundasang-Ranau (5.1 magnitude) caused one death and several injuries, as well as minor cracks to buildings such as teachers' quarters and a secondary school. It triggered tension cracks (en-enchelon) in Kg. Gaur, Bt. Kambura, and Bt. Mitabang. In 2008, a more moderate earthquake with a magnitude of 5.0 struck the Kunak district, resulting in considerable damage to several structures, including a mosque, a concrete floor, and stone-walled houses. No fatalities were recorded in relation to the shock that followed the quake.
Based on the record of historical earthquakes, the majority of such events have occurred in Peninsular Malaysia, specifically in Bukit Tinggi, Manjung, Kenyir, Temenggor, and Kuala Pilah. Only a few minor local earthquakes (less than 4.0 magnitude) have been recorded, with no major damage or fatalities reported. However, between 2007 and 2009, about 24 tremors in Bukit Tinggi with magnitudes of less than 3.0 were recorded by the Malaysian Meteorological Department (MetMalaysia) [26, 27]. Geomorphic investigation research identified fault segments in the Bukit Tinggi zone that were deemed active. The Bentong Fault, which consists of the Bukit Tinggi Fault and Kuala Lumpur (which is located in the Bukit Tinggi area), has the potential to cause earthquakes in the future. Therefore, the JMG agency and the collaboration team are conducting ongoing research on and monitoring seismic activity in the Bukit Tinggi area.
Since 1874, the earthquakes recorded in Sarawak have mostly been generated locally and had magnitudes ranging from 3.5 to 5.3 on the Richter scale [26]. A mild tremor measuring 3.5 magnitude was reported in January 2010 in Batu Niah, Sarawak [26]. Based on the MetMalaysia Database and the Incorporated Research Institutions for Seismology (IRIS) browser, most earthquakes have been concentrated in the Niah and Selangau areas. The active intraplate in the earthquake zone consists of the faults of Tubau, Mersing, Kelawit, Tinjar, and West Baram.
There are several studies related to earthquake vulnerability assessment in Malaysia. Most studies on earthquakes in Ranau, Sabah, focus on recognising socioeconomic and environmental vulnerabilities, such as the study [28-30] examined physical and environmental vulnerabilites in the aftermath of the Ranau earthquake in Sabah. The study [31] employed the Rapid Visual Screening (RVS) method to map the physical vulnerabilities of the Kundasang area in Sabah, addressing the issue of limited building inventory data. Researchers are also working to uncover the spatial variance of the social vulnerability index to seismic risks in Pahang [32, 33] and Sabah [34, 35] by analysing demographic data and the density distribution of residential buildings.
A systematic literature search of English-language academic articles was undertaken to obtain articles related to seismic vulnerability assessment indicators. PRISMA statement searches of the Web of Science (WoS) and Scopus databases were conducted for this purpose. The elements performed included the eligibility and exclusion criteria process, review process steps, data extraction, and analysis [36].
3.1 PRISMA
Although PRISMA statements are commonly used in medical and health systematic reviews, the method is also frequently used to guide reviews in the field of environmental management. It enables users to assemble all the relevant evidence that meets predefined eligibility criteria to answer a specific research question. A PRISMA statement supports a rigorous, accurate, and reliable search through a clear definition of research questions; admission identification; exclusion criteria; and an inspection of large scientific databases within a set time [37]. A review protocol was developed for this study, focusing on the article eligibility criteria, search techniques, data extraction, and data analysis techniques related to seismic or earthquake indicators for seismic vulnerabilities and risks, as well as coded information for future environmental management reviews. This methodology can be used to identify earthquake or seismic indicators of earthquake vulnerability and risk assessment, which is gaining more attention in the country.
3.1.1 Resources
The review systematically searched two main electronic databases, referring to the Web of Science (WoS) and Scopus for items produced between 2003 and 2022. Both these high-value online databases consist of interdisciplinary bibliographies for journal searches and indexing databases. The WoS database consists of over 33,000 scientific publications in the natural, technical, and social science disciplines. The publications are worldwide and include journals, conference proceedings, symposia, seminars, colloquia, workshops, and conventions. Scopus comprises more than 23,700 active titles from 5,000 publishers of scholarly literature in the sciences, social sciences, arts, and humanities. Furthermore, Google Scholar database searches were also considered for this research.
3.1.2 Systematic review process
The most common technique for a systematic literature review includes four basic steps: a) a keyword or search string to identify relevant literature; b) a screening inclusion and exclusion procedure; c) analysis of extracts and organized data; and d) a synthesis-interpretation of the findings [38]. The methodology shows the steps used to conduct the systematic review of earthquake indicators for global vulnerability assessment.
Table 2. The searching terms and searching information strategy
|
Databases |
Keywords used |
|
Scopus |
TITLE-ABS-KEY (earthquake OR seismi* OR quake*) AND TITLE-ABS-KEY (indicator* OR variabl* OR param* OR index* OR cursor*) AND TITLE-ABS-KEY (vulnerab* AND assess* OR vulnerab* AND evalua* OR risk* AND assess* OR threat* AND assess*) AND NOT tsunami* |
|
Web of Science |
TS = (earthquake OR seismi* OR quake*) AND TITLE-ABS-KEY (indicator* OR variabl* OR param* OR index* OR cursor*) AND TITLE-ABS-KEY (vulnerab* AND assess* OR vulnerab* AND evalua* OR risk* AND assess* OR threat* AND assess*) AND NOT tsunami* |
|
Google Scholar |
(“earthquake vulnerability assessment”) (“seismic vulnerability assessment”) (indicator)(parameter)(index) |
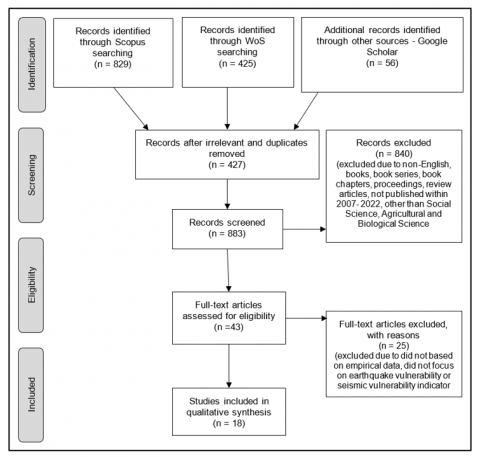
Identification. The first phase of the search strategy and delivery was conducted to gather relevant information from publications using recognized databases. The keyword or search string used to find the relevant research focused on the terms "earthquake indicator" and "vulnerability assessment" (Table 2). Furthermore, the Boolean operator 'NOT' was included in the search string to exclude tsunami-related articles. Despite the exclusion of some earthquake-related articles, the output generated enough samples to investigate the current use of vulnerability indicators. In total, 829 related articles were identified from the Scopus database and 425 were obtained from the WoS database. An additional 56 source articles were found from the Google Scholar searches.
Screening and eligibility. Screening and eligibility involve identifying studies that meet the inclusion criteria or eliminating irrelevant material obtained from literature searches (Figure 6). Initially, 1,310 publications or articles were identified from the selected database sources (Scopus, WoS, and Google Scholar). Overall, a total of 427 irrelevant or duplicated publications were removed. Subsequently, the selected articles (titles and abstracts) were screened to exclude obviously unrelated articles from the review. Second, to avoid confusion and translation difficulties, non-English language articles were excluded and the searches were limited to English-language publications. Next, the publication types search included only accessible scholarly journal articles and excluded other types of literature such as books, book series, book chapters, proceedings, keynotes, and review articles. Efforts focused on research published between 2007 and 2022. Table 3 describes the criteria followed throughout the screening process and eligibility decisions. After removing the unrelated articles, only 43 remained for the further screening process. Finally, 18 articles met the eligibility criteria and were downloaded for further review.
Table 3. Inclusion and exclusion criteria in screening process
|
Criteria |
Condition |
|
Predefined search string is present throughout the paper, or at least in the title, keywords, and abstract sections |
Inclusion |
|
English-based publication Publication between 2007 -2022 |
Inclusion Inclusion |
|
Duplicated papers Publication types are books, book series, book chapters, proceedings, keynotes and review articles Inaccessible publication Social Science, Agricultural and Biological Science |
Exclusion Exclusion Exclusion Exclusion |
Data extraction and analysis. Data extraction and analysis were performed on the eligible articles to determine the themes and sub-themes related to the objectives. During the full article readings, appropriate qualitative analysis was used to analyze and organized the themes and sub-themes of the seismic vulnerability assessment indicators.
The literature review of previous research on seismic vulnerability assessment indicators is simplified in Table 4. Based on the systematic literature review, the selection of six main themes and 35 sub-themes referring to the composite indicators for a measurement system was a major conceptual and technical challenge.
The review process revealed six major groups of indicators to assess seismic vulnerability: hazard elements, as well as social, economic, physical, natural, and manmade factors. A further explanation of the indicators used in previous studies is given as follows:
4.1 Hazard element
Seismic hazards are the sources of the level of potential ground shaking during earthquakes that may cause loss of life, injury, property damage, social and economic disruption, or environmental degradation [39]. The seismicity of an area is measured by both the intensity and magnitude of an earthquake occurring in the region within a specific period. Magnitude represents the energy released at the source of an earthquake and is measured according to globally accepted scales, the Modified Mercalli Intensity scale (MMI) or the Richter scale [40]. Earthquakes are also measured in terms of Peak Ground Acceleration (PGA), which is defined as the acceleration of the ground during an earthquake. Earthquake intensity measurement uses the PGA value in units of 'g' (gravity) as the most important indicator for structural design purposes. The type of soil is an important factor in determining an area's seismicity [41]. Scholars also use geological indicators to represent soil factors and seismicity conditions. The depth of the seismic bedrock and groundwater contributes to the geological conditions. The occurrence of earthquakes is closely related to the groundwater levels and water quality in wells. The ground amplification factor (AF) of seismic amplification is defined as the ratio of the response spectrum to the rock response spectrum. Fault lines are used by researchers to assess seismic vulnerability. The impact of an earthquake increases as the distance between the fault line and the epicenter of the earthquake decreases [42].
Figure 6. The PRISMA flow diagram for systematic review process
4.2 Social
Social indicators are intended to represent the demographic characteristics of a society of interest. These indicators include age structures, gender, disabilities, family structures, education levels, migrants, and population growth. The most important non-seismic and non-structural factor in determining vulnerabilities is the population information from the national census data for each zone. Therefore, rapid growth in a district leads to poor-quality housing, and social services networks may not have enough time to adapt to the expanding population. New migrants unfamiliar with the local language and culture make it difficult to deliver relief or disaster recovery information, increasing the vulnerability [43, 44].
An evacuation process is hampered by a high population density. Hazards that occur in densely populated areas have a greater impact than those that occur in less densely populated areas. The detailed characteristics of the population refer, in turn, to the age structure, which is classified into vulnerable groups that include children and the elderly. By norms and culture, age factors affect vulnerability in terms of reduced mobility, illiteracy, and financial constraints. Similarly, studies have proven that women are more affected by disaster events due to their sector-specific employment, lower wages, family care responsibilities, and biological characteristics, particularly in developing countries. Meanwhile, vulnerable groups such as the disabled face various obstacles, including psychological, physical, and financial obstacles [45-47]. Family structures or sizes with high birth rates, large families, and single-parent households are vulnerable groups that will be impacted by the levels of disaster resilience and recovery [43, 48, 49]. Education levels can promote reduced vulnerability and greater adaptive capacity through better individual and household opportunities in terms of employment, quality of life, access to material, and both informational and social resources.
Table 4. List of seismic vulnerability indicator and references
|
Theme |
Sub-theme |
References |
|
Hazard element |
Peak ground acceleration (PGA) value |
[5, 41, 42, 50-58] |
|
Soil |
[41, 51, 54-56, 58-63] |
|
|
Geology |
[41, 51, 52, 54-56, 58, 62, 64-66] |
|
|
Bedrock |
[52, 54] |
|
|
Groundwater |
[42, 52, 54, 62, 66] |
|
|
Fault line |
[41, 42, 50, 51, 58, 60, 64] |
|
|
Ground amplification |
[52, 53, 55, 56] |
|
|
Social |
Population density |
[19, 42, 48, 53, 57, 58, 60-63, 65-71] |
|
Age structure |
[19, 42, 48, 53, 57, 63, 67, 68, 70-72] |
|
|
Gender |
[42, 48, 49, 65, 68, 70, 71] |
|
|
Disabilities |
[45-47, 71-74] |
|
|
Family structure (household) |
[48, 49, 53, 59, 68, 70, 71] |
|
|
Education level |
[53, 57, 59, 67, 68, 71] |
|
|
Migrant |
[49, 67] |
|
|
Population growth |
[43, 44] |
|
|
Economy |
Unemployment rate |
[53, 57, 59, 68, 71] |
|
Land use |
[50, 58, 62, 63, 68, 75] |
|
|
Income |
[53, 59, 71] |
|
|
Gross Domestic Product (GDP) value |
[53, 76] |
|
|
Poverty level |
[48, 49, 65, 74] |
|
|
Physical |
Public facilities |
[5, 19, 42, 57, 59, 60, 63, 67] |
|
Road network/width |
[5, 57, 59, 60, 63, 65, 67, 69, 71] |
|
|
Building type/material |
[5, 19, 42, 53, 57, 61-64, 66-68] |
|
|
Building density |
[5, 19, 42, 48, 53, 57, 60, 64, 65] |
|
|
Number of floors |
[19, 42, 62-64, 67, 68] |
|
|
Building age |
[19, 42, 57, 62-64, 68] |
|
|
Building quality |
[42] |
|
|
Nature |
Slope |
[41, 42, 55-57, 65, 66] |
|
Induce hazard (tsunami, landslide, liquefaction, fire, etc) |
[5, 19, 42, 53, 62] |
|
|
Manmade |
Distance to vital facilities (hospital, school, fire station, evacuation center, etc) |
[5, 19, 42, 51, 57, 59, 60, 63, 67, 69, 71] |
|
Distance to open sites/space |
[5, 53, 57, 63, 67] |
|
|
Water/pipeline network |
[5, 57, 60] |
|
|
Electrical network |
[57, 60, 69] |
|
|
Gasoline |
[5, 42, 60, 69] |
|
|
Fuel station |
[42] |
4.3 Economic
The best indicator of a community's socioeconomic status is income. Higher-income populations may experience higher household losses in absolute terms, but they can absorb and recover from losses more quickly due to insurance policies, social safety nets, financial investments, and entitlement programs [48, 49, 53, 59]. In contrast, poor households usually suffer more due to constrained financial reserves for preparation for possible disasters or recovery in the aftermath. Furthermore, such groups typically live in poorly built housing and have less access to transport to heed evacuation warnings [44, 45, 47, 48]. The unemployed population perceives more risk and feels more concerned about disasters due to being unprepared for them. In a broader sense, disaster preparedness is also seen as related to economic factors at the district and national levels. Land use and Gross Domestic Product (GDP) values represent the capability of an area to prepare itself economically with the capital to recover after a disaster strikes [53, 76].
4.4 Physical
An earthquake disaster may destroy infrastructures and buildings. Most injuries or deaths during an earthquake are caused by collapsing walls or large objects falling from buildings. Therefore, information about the building characteristics - including the types, ages, and levels of buildings, as well as other factors - is necessary to measure seismic vulnerability [5, 42, 48, 57, 60, 65, 77]. Important buildings for disaster management are public facilities such as medical centers, fire and rescue departments, police stations, and schools. The failure or collapse of a large number of services can disrupt and worsen the impact of a disaster as a community-based risk. Likewise, damage to high-density residential structures such as schools often results in a large number of disaster-related deaths and injuries [5, 19, 42, 57, 78]. Road networks provide transport facilities during the evacuation process. However, a road network affected by a disaster result in increased adverse effects and disrupts emergency response travel times.
4.5 Natural
Topographic effects are an important factor in earthquake hazard mapping [41]. Areas with various types of land slopes have a vulnerability ranging from low to high. This variable depicts a diverse range of slopes, beginning with flat slopes that are more resistant to earthquakes and more stable against landslides and possible landslides, and progressing to steep slopes that are extremely vulnerable to landslides caused by earthquakes. It can be concluded that the slope of the soil influences its stability [65]. It is also important to measure seismic vulnerability through the induced hazards due to surface ruptures along the fault and ground shaking that may trigger a tsunami, landslide, liquefaction, fire, and other types of losses.
4.6 Manmade
The distance from certain areas known as critical and sensitive spots may influence the likelihood of earthquake damage. Although these areas are not dangerous under normal circumstances, their characteristics mean they have the potential to exacerbate critical conditions and increase the associated damage and losses. The distance to vital facilities (such as hospitals, schools, fire stations, and evacuation centers) is important after a disaster. Effective disaster response needs adequate numbers of hospital beds and medical technical personnel once casualties occur. According to the study [42], the important parameters to which less attention has been given are the distances from other specific facilities: fuel stations, open sites/spaces, electrical networks, and gasoline. In addition, the water/pipeline network is a crucial disaster management parameter after an earthquake.
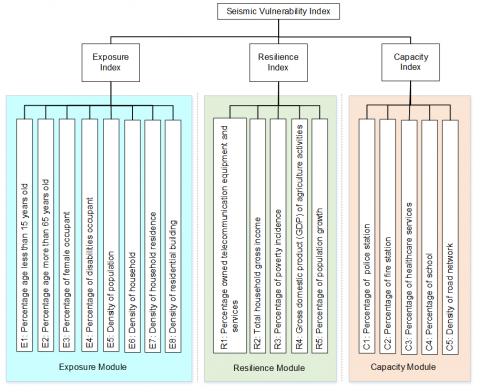
The identification of indicators and sub-indicators was important in defining the factors that contribute to seismic vulnerability assessment. Existing vulnerability assessment models require a substantial amount of empirical data. In other words, they are limited to data-rich areas and do not include developing countries such as Malaysia. Based on a combination of a review of the relevant literature, expert opinion, and the available data, three key indicators in the context of the Malaysian situation were selected and structured. The group of indicators was classified into exposure, resilience, and capacity indicators. Each group of indicators was assigned respective sub-indicators (Figure 7).
Exposure is defined as a vulnerability component that is important to determine the geographical boundaries of the risk area in terms of the population and properties in the natural disaster hazard area [11]. Population information such as age structures, gender, population density, disability status, household density, and other demographic statistics are important in assessing the level of vulnerability [45, 48]. Meanwhile, the exposure to properties in the event of an earthquake is always represented by the vulnerable buildings in the risk area [42, 77]. Significant indicators - such as the density of residential buildings and the density of household residences - measure the exposure level.
The literature on resilience refers to it as a society’s ability to respond to a disaster. Therefore, the level of resilience reflects the extent to which a society can absorb, cope with, and adapt to predetermined hazards [79]. The indicators are commonly associated with economic resilience, critical communication infrastructure, and community capital [21, 48]. A combination of resilience characteristics represented by household wealth, poverty incidence, population growth, communication facilities, and financial resources can be used to analyze the resilience of different groups in a community.
According to the study [79], capacity is referred to as the integration of an organization's or people's abilities, strengths, and resources to overcome or handle the consequences of a disaster and improve their resilience. Capacity is measured by referring to critical facilities and transportation networks. The elements at risk consist of police stations, fire stations, healthcare services, schools, and road network [5, 19, 57].
Overall, the selection of indicators for measuring disaster vulnerability includes the level of exposure, lack of resilience, and community coping ability, as measured by vulnerable area boundaries, access limits, and a community’s mobilization or social-ecological capital to respond to predetermined hazards [19-22].
Figure 7. Structure of the seismic vulnerability index assessment
The recent literature on the concept of vulnerability to seismic disasters reflects a basic understanding of the components involved in assessing the level of vulnerability of an area at risk of earthquakes. Furthermore, three main components used to measure the level of vulnerability of a population and property to earthquake disasters were identified, based on a systematic study conducted in the current research. Based on the history of earthquakes in Malaysia, three main components and their respective indicators have been outlined: 1) exposure (age less than 15 years, age over 65 years, gender, ability status, household density, and density of housing buildings); 2) resilience (percentage with telecommunication equipment and service facilities, household gross income, poverty incidence, GDP of agriculture activities, and population growth; and 3) capacity (percentage of police stations, fire stations, healthcare services, schools, and road network density).
These indicators are intended to provide a comprehensive view of the potential impact of earthquakes on the human population in the region, and to inform disaster preparedness and planning efforts. The sub-indicators provide a more detailed understanding of the factors that contribute to seismic vulnerability, and can be used to identify areas most at risk. Furthermore, the set of indicators proposed in this study can be used for any region in Malaysia, and can be replicated across different regional scales and variations
The results of this measurement via these indicators should be useful to the authorities, who could include it as complementary data to earthquake disaster risk management mapping based on earthquake locations. This research is critical for understanding the primary elements that contribute to the vulnerability of buildings and infrastructure in seismic zones. By identifying these indicators, future research can concentrate on gathering the data required to compute a vulnerability index, which will be useful in disaster risk reduction and mitigation planning.
The authors are thankful to the government agencies (DSM, JMG, and MaCGDI) for the primary data provided in this research. Communication of this research is made possible through monetary assistance by Universiti Tun Hussein Onn Malaysia and the UTHM Publisher’s Office via Publication Fund E15216.
[1] Vahdat, K., Smith, N.J. (2010). Multidisciplinary integrated tools in seismic risk management. Risk Management, 447-458.
[2] Cardona, O.D., Carreño, M.L. (2011). Updating the indicators of disaster risk and risk management for the Americas. IDRiM Journal, 1(1): 27-47. https://doi.org/10.5595/idrim.2011.0014
[3] Martınez-Cortizas, A., Pontevedra-Pombal, X., Garcıa-Rodeja, E., Novoa-Munoz, J.C., Shotyk, W. (1999). Mercury in a Spanish peat bog: Archive of climate change and atmospheric metal deposition. Science, 284(5416): 939-942. https://doi.org/10.1126/science.284.5416.939
[4] UNISDR. (2016). UNISDR Science and Technology Conference on the Implementation of the Sendai Framework for Disaster Risk Reduction 2015-2030: Exposure and Vulnerability.
[5] Mili, R.R., Hosseini, K.A., Izadkhah, Y.O. (2017). Developing a holistic model for earthquake risk assessment and disaster management interventions in urban fabrics. International Journal of Disaster Risk Reduction, 27: 355-365 https://doi.org/10.1016/j.ijdrr.2017.10.022
[6] Villagrán De León, J.C. (2006). Vulnerability: A conceptual and methodological review (Source No. 4/2006). UNU-EHS, 64p.
[7] UN-ISDR. (2005). Hyogo Framework for Action 2005–2015: Building the Resilience of Nations and Communities to Disasters. Final Report of the Word Conference on Disaster Reduction, 2006 (A/CONF. 206/6). https://www.unisdr.org/we/inform/publications/1037.
[8] UNISDR. (2015). Sendai Framework for Disaster Risk Reduction 2015-2030.
[9] Bohle, H.G. (2001). Vulnerability and criticality: Perspectives from social geography. Newsletter of the International Human Dimensions Programme on Global Environmental Change, 2: 1-6.
[10] Pelling, M. (2003). The vulnerability of cities: Natural disasters and social resilience. In Earthscan Publications Ltd. (First edit). https://doi.org/10.1039/J19660001254
[11] Birkmann, J., Cardona, O.D., Carreño, M.L., Barbat, A.H., Pelling, M., Schneiderbauer, S., Kienberger, S., Keiler, M., Alexander, D., Zeil, P., Welle, T. (2013). Framing vulnerability, risk and societal responses: The move framework. Natural Hazards, 67(2): 193-211. https://doi.org/10.1007/s11069-013-0558-5
[12] Davidson, R.A. (1997). A multidisciplinary urban earthquake disaster risk index. Earthquake Spectra, 13(2): 211-223. https://doi.org/https://doi.org/10.1193/1.1585942
[13] Davidson, R., Shah, H.C. (1997). An urban earthquake disaster risk index. Stanford University: Phd Thesis.
[14] Burton, C., Silva, V. (2014). Integrated risk modeling within the Global Earthquake Model (GEM): Test case application for Portugal. Second European Conference on Earthquake Engineering and Seismology, August, Istanbul, 1-10. https://doi.org/10.13140/2.1.4084.8643
[15] Carreno, M.L., Cardona, O.D., Salgado-Galvez, M.A., Velasquez, C.A., Barbat, A.H. (2016). Urban seismic risk assessment with a holistic approach for the national district in Santo Domingo, Dominican Republic. UNISDR Science and Technology Conference on the Implementation of the Sendai Framework for Disaster Risk Reduction, January, 1-7.
[16] Cutter, S.L., Burton, C.G., Emrich, C.T. (2010). Disaster resilience indicators for benchmarking baseline conditions. Journal of Homeland Security and Emergency Management, 7(1): 1-22. https://doi.org/10.2202/1547-7355.1732
[17] ADPC. (2015). Disaster Recovery Toolkit, Tsunami Global Lessons Learned Project: Guidance on Critical Facilities Services. Tsunami Global Lessons Learned Project Steering Committee (TGLLP-SC). www.adpc.net/tgllp/drt.
[18] NISDR. (2018). Strategic Approach to Capacity Development for Implementation of the Sendai Framework for Disaster Risk Reduction (Issue July).
[19] Banica, A., Rosu, L., Muntele, I., Grozavu, A. (2017). Towards urban resilience: A multi-criteria analysis of seismic vulnerability in Iasi city (Romania). Sustainability, 9(2): 1-17. https://doi.org/10.3390/su9020270
[20] Bergstrand, K. (2017). Assessing the relationship between social vulnerability and community resilience to hazards. Social Indicators Research, 122(2): 391-409. https://doi.org/10.1007/s11205-014-0698-3
[21] Doorn, N. (2017). Resilience indicators: opportunities for including distributive justice concerns in disaster management. Journal of Risk Research, 20(6): 711-731. https://doi.org/10.1080/13669877.2015.1100662
[22] Welle, T., Birkmann, J. (2015). The world risk index–an approach to assess risk and vulnerability on a global scale. Journal of Extreme Events, 2(01): 1550003. https://doi.org/10.4324/9780429463723
[23] Marto, A., Tan, C.S., Kasim, F., Mohd, N.Z. (2013). Seismic impact in Peninsular Malaysia. The 5th International Geotechnical Symposium - Incheon, May, Seoul, Korea, pp. 237-242. https://doi.org/10.13140/2.1.3094.9129
[24] Adnan, A., Hendriyawan, H., Marto, A., Irsyam, M. (2005). Seismic hazard assessment for Peninsular Malaysia using gumbel distribution method. Jurnal Teknologi, 42(B): 57-73.
[25] Tongkul, F. (2016). The 2015 Ranau earthquake: Cause and impact. Sabah Society Journal, 32: 1-28.
[26] Alexander, Y. (2011). Geological Assessment of the Earthquake Sources and Hazard in Malaysia.
[27] Wert, E.C., Dong, M.M., Rosario-Ortiz, F.L. (2013). Using digital flow cytometry to assess the degradation of three cyanobacteria species after oxidation processes. Water Research, 47(11): 3752-3761. https://doi.org/10.1016/j.watres.2013.04.038
[28] Indan, E., Roslee, R., Tongkul, F., Simon, N. (2018). Earthquake vulnerability assessment (EVAS): Analysis of environmental vulnerability and social vulnerability in Ranau Area, Sabah, Malaysia. Geological Behavior (GBR), 2(1): 24-28. https://doi.org/http://doi.org/10.26480/gbr.01.2018.24.28
[29] Aziera, J., Rambat, S., Ros, C., Shi, Z., Amri, S. (2021). Seismic vulnerability assessment in Ranau, Sabah, using two different models. International Journal of Geo-Information, 10(271): 1-25. https://doi.org/https://doi.org/10.3390/ijgi10050271
[30] Indan, E., Roslee, R., Tongkul, F., Simon, N. (2018). Earthquake vulnerability assessment (EVAS): Analysis of environmental vulnerability and social vulnerability in Ranau Area, Sabah, Malaysia. Geological Behavior (GBR), 2(1): 24-28. https://doi.org/http://doi.org/10.26480/gbr.01.2018.24.28
[31] Ghafar, M., Ramly, N., Alel, M., Adnan, A., Mohamad, E.T., Yunus, M.Z.M. (2015). A simplified method for preliminary seismic vulnerability assessment of existing building in Kundasang, Sabah, Malaysia. Jurnal Teknologi, 72(3): 1-7. https://doi.org/10.11113/jt.v72.4003
[32] Sauti, N.S., Daud, M.E., Kaamin, M. (2020). Construction of an Integrated social vulnerability index to identify spatial variability of exposure to seismic hazard in Pahang, Malaysia. International Journal of Design and Nature and Ecodynamics, 15(3): 365-372. https://doi.org/10.18280/ijdne.150310
[33] Sauti, N.S., Daud, M.E., Kaamin, M., Sahat, S. (2021). GIS spatial modelling for seismic risk assessment based on exposure, resilience, and capacity indicators to seismic hazard: A case study of Pahang, Malaysia. Geomatics, Natural Hazards and Risk, 12(1): 1948-1972. https://doi.org/10.1080/19475705.2021.1947903
[34] Sauti, N.S., Daud, M.E., Kaamin, M., Sahat, S. (2021). Development of an exposure vulnerability index map using GIS modeling for preliminary seismic risk assessment in Sabah, Malaysia. International Journal of Design & Nature and Ecodynamics, 16(1): 111-119. https://doi.org/10.18280/ijdne.160115
[35] Sauti, N.S., Daud, M.E., Kaamin, M., Sahat, S. (2022). Earthquake risk assessment of sabah, malaysia based on geospatial approach. International Journal of Integrated Engineering, 14(5): 34-48. https://doi.org/10.30880/ijie.2022.14.05.004
[36] Mohamed Shaffril, H.A., Samah, A.A., Samsuddin, S.F., Ali, Z. (2019). Mirror-mirror on the wall, what climate change adaptation strategies are practiced by the Asian’s fishermen of all? Journal of Cleaner Production, 232: 104-117. https://doi.org/10.1016/j.jclepro.2019.05.262
[37] Sierra-Correa, P.C., Cantera Kintz, J.R. (2015). Ecosystem-based adaptation for improving coastal planning for sea-level rise: A systematic review for mangrove coasts. Marine Policy, 51: 385-393. https://doi.org/10.1016/j.marpol.2014.09.013
[38] Mengist, W., Soromessa, T., Legese, G. (2020). Method for conducting systematic literature review and meta-analysis for environmental science research. MethodsX, 7: 100777. https://doi.org/10.1016/j.mex.2019.100777
[39] USGS, “What is seismic hazard?,” 2018. https://www.usgs.gov/faqs/what-seismic-hazard-what-a-seismic-hazard-map-how-are-they-made-how-are-they-used-why-are-there?qt-news_science_products=7#qt-news_science_products, accessed on Oct. 24, 2018.
[40] Torres-Vera, M.A. (2011). Spain: Natural Hazards in the Country. In Encyclopedia of Environmental Health (2nd ed., Issue April). Elsevier Inc. https://doi.org/10.1016/b978-0-444-52272-6.00410-4
[41] Al-Dogom, D., Schuckma, K., Al-Ruzouq, R. (2018). Geostatistical seismic analysis and hazard assessment; United Arab Emirates. International Archives of the Photogrammetry, Remote Sensing and Spatial Information Sciences - ISPRS Archives, 42(3/W4): 29-36. https://doi.org/10.5194/isprs-archives-XLII-3-W4-29-2018
[42] Bahadori, H., Hasheminezhad, A., Karimi, A. (2017). Development of an integrated model for seismic vulnerability assessment of residential buildings: Application to Mahabad city, Iran. Journal of Building Engineering, 12: 118-131. https://doi.org/10.1016/j.jobe.2017.05.014
[43] Aksha, S.K., Juran, L., Resler, L.M., Zhang, Y. (2019). An analysis of social vulnerability to natural hazards in Nepal using a modified social vulnerability index. International Journal of Disaster Risk Science, 10: 103-116. https://doi.org/10.1007/s13753-018-0192-7
[44] de Loyola Hummell, B.M., Cutter, S.L., Emrich, C.T. (2016). Social vulnerability to natural hazards in Brazil. International Journal of Disaster Risk Science, 7(2): 111-122. https://doi.org/https://doi.org/10.1007/s13753-016-0090-9
[45] Flanagan, B.E., Gregory, E.W., Hallisey, E.J., Heitgerd, J.L., Lewis, B. (2011). A social vulnerability index for disaster management. Journal of Homeland Security and Emergency Management, 8(1): 1-22. https://doi.org/10.2202/1547-7355.1792
[46] Ronoh, S., Gaillard, J.C., Marlowe, J. (2015). Children with disabilities and disaster risk reduction: A review. International Journal of Disaster Risk Science, 6(1): 38-48. https://doi.org/10.1007/s1373-015-0042-9
[47] Rygel, L., O’sullivan, D., Yarnal, B. (2006). A method for constructing a social vulnerability index: An application to hurricane storm surges in a developed country. Mitigation and Adaptation Strategies for Global Change, 11: 741-764. https://doi.org/10.1007/s11027-006-0265-6
[48] Cutter, S.L., Boruff, B.J., Shirley, W.L. (2003). Social vulnerability to environmental hazards. Social Science Quarterly, 84(2): 242-261. https://doi.org/https://doi.org/10.1111/1540-6237.8402002
[49] Morrow, B.H. (1999). Identifying and mapping community vulnerability. Disasters, 23(1): 1-18. https://doi.org/https://doi.org/10.1111/1467-7717.00102
[50] Jena, R., Pradhan, B., Naik, S.P., Alamri, A.M. (2021). Earthquake risk assessment in NE India using deep learning and geospatial analysis. Geoscience Frontiers, 12(3): 101110. https://doi.org/10.1016/j.gsf.2020.11.007
[51] Al-Dogom, D., Al-Ruzouq, R., Kalantar, B., Schuckman, K., Al-Mansoori, S., Mukherjee, S., Al-Ahmad, H., Ueda, N. (2021). Geospatial multicriteria analysis for earthquake risk assessment: Case study of Fujairah city in the UAE. Journal of Sensors, 2021. https://doi.org/10.1155/2021/6638316
[52] Ganapathy, G.P. (2011). First level seismic microzonation map of Chennai city - A GIS approach. Natural Hazards and Earth System Science, 11(2): 549-559. https://doi.org/10.5194/nhess-11-549-2011
[53] Hajibabaee, M., Amini-Hosseini, K., Ghayamghamian, M.R. (2014). Earthquake risk assessment in urban fabrics based on physical, socioeconomic and response capacity parameters (a case study: Tehran city). Natural Hazards, 74(3): 2229-2250. https://doi.org/10.1007/s11069-014-1300-7
[54] Mohanty, W.K., Walling, M.Y., Nath, S.K., Pal, I. (2007). First order seismic microzonation of Delhi, India using geographic information system (GIS). Natural Hazards, 40(2): 245-260. https://doi.org/10.1007/s11069-006-0011-0
[55] Moustafa, S.S.R. (2015). Application of the analytic hierarchy process for evaluating geo-hazards in the greater cairo area, Egypt. Electronic Journal of Geotechnical Engineering, 20: 1921-1938.
[56] Moustafa, S.S.R., SN Al-Arifi, N., Jafri, M.K., Naeem, M., Alawadi, E.A., Metwaly, M. (2016). First level seismic microzonation map of Al-Madinah province, western Saudi Arabia using the geographic information system approach. Environmental Earth Sciences, 75(3): 1-20. https://doi.org/10.1007/s12665-015-5073-4
[57] Rezaie, F., Panahi, M. (2015). GIS modeling of seismic vulnerability of residential fabrics considering geotechnical, structural, social and physical distance indicators in Tehran using multi-criteria decision-making techniques. Natural Hazards and Earth System Sciences, 15(3): 461-474. https://doi.org/10.5194/nhess-15-461-2015
[58] Rivas-Medina, A., Gaspar-Escribano, J.M., Benito, B., Bernabé, M.A. (2013). The role of GIS in urban seismic risk studies: Application to the city of Almería (southern Spain). Natural Hazards and Earth System Sciences, 13(11): 2717-2725. https://doi.org/10.5194/nhess-13-2717-2013
[59] Walker, B.B., Taylor-Noonan, C., Tabbernor, A., McKinnon, T.B., Bal, H., Bradley, D., Schuurman, N., Clague, J.J. (2014). A multi-criteria evaluation model of earthquake vulnerability in Victoria, British Columbia. Natural Hazards, 74(2): 1209-1222. https://doi.org/10.1007/s11069-014-1240-2
[60] Alam, M.N., Tesfamariam, S., Alam, M.S. (2013). GIS-Based Seismic Damage Estimation: Case Study for the City of Kelowna, BC. Natural Hazards Review, 14(1): 66-78. https://doi.org/10.1061/(ASCE)NH.1527-6996.0000082
[61] Maithani, S. (2004). Radius: A methodology for earthquake hazard assessment in urban areas in a gis environment, case study dehradun municipal area. Institute of Town Planners India (IPTI) Journal, 3: 55-64.
[62] Nath, S.K., Adhikari, M.D., Devaraj, N., Maiti, S.K. (2015). Seismic vulnerability and risk assessment of Kolkata City, India. Natural Hazards and Earth System Sciences, 15(6): 1103-1121. https://doi.org/10.5194/nhess-15-1103-2015
[63] Pervin Ishita, R., Khandaker, S. (2010). Application of analytical hierarchical process and GIS in earthquake vulnerability assessment: Case study of ward 37 and 69 in Dhaka city. Journal of Bangladesh Institute of Planners, 3: 103-112.
[64] Sarris, A., Loupasakis, C., Soupios, P., Trigkas, V., Vallianatos, F. (2010). Earthquake vulnerability and seismic risk assessment of urban areas in high seismic regions: Application to Chania city, Crete Island, Greece. Natural Hazards, 54: 395-412. https://doi.org/10.1007/s11069-009-9475-z
[65] Irjaya, N., Pamungkas, A. (2014). Penentuan zona kerentanan bencana gempa bumi tektonik di kabupaten malang wilayah selatan. Jurnal Teknik Pomits, 3(2): C107-C112.
[66] Karimzadeh, S., Miyajima, M., Hassanzadeh, R., Amiraslanzadeh, R., Kamel, B. (2014). A GIS-based seismic hazard, building vulnerability and human loss assessment for the earthquake scenario in Tabriz. Soil Dynamics and Earthquake Engineering, 66: 263-280. https://doi.org/10.1016/j.soildyn.2014.06.026
[67] Aliabadi, S.F., Sarsangi, A., Modiri, E. (2015). The social and physical vulnerability assessment of old texture against earthquake (case study: Fahadan district in Yazd City). Arabian Journal of Geosciences, 8(12): 10775-10787. https://doi.org/10.1007/s12517-015-1939-8
[68] Martins, V.N., Silva, D.S., Cabral, P., Silva, D.S., Cabral, P., Silva, D.S., Cabral, P., Silva, D.S., Cabral, P. (2012). Social vulnerability assessment to seismic risk using multicriteria analysis : the case study of Vila Franca do Campo (Sao Miguel Island, Azores, Portugal). Natural Hazards, 62(2): 385-404. https://doi.org/https://doi.org/10.1007/s11069-012-0084-x
[69] Barbat, A.H., Carreño, M.L., Pujades, L.G., Lantada, N., Cardona, O.D., Marulanda, M.C. (2010). Seismic vulnerability and risk evaluation methods for urban areas. A review with application to a pilot area. Structure and Infrastructure Engineering, 6(1-2): 17-38. https://doi.org/10.1080/15732470802663763
[70] Agrawal, N., Gupta, L., Dixit, J. (2021). Assessment of the socioeconomic vulnerability to seismic hazards in the national capital region of India using factor analysis. Sustainability, 13(17): 9652. https://doi.org/10.3390/su13179652
[71] Nafeh, A.M.B., Beldjoudi, H., Yelles, A.K., Monteiro, R. (2020). Development of a seismic social vulnerability model for northern Algeria. International Journal of Disaster Risk Reduction, 50: 101821. https://doi.org/10.1016/j.ijdrr.2020.101821
[72] Buckle, P., Mars, G., Smale, S. (2000). New approaches to assessing vulnerability and resilience. Australian Journal of Emergency Management, 15(2): 8-14.
[73] Alexander, D. (2011). Disability and disaster. In J. C. Gaillard, B. Wisner, & I. Kelman (Eds.), Handbook of Hazards and Disaster Risk Reduction, pp. 384-394. https://doi.org/10.4324/9781315208558-9
[74] Burton, C.G., Toquica, M., Asad, K.M. Bin, Musori, M. (2022). The validation and development of composite indices for measuring vulnerability and recovery potential from earthquakes. Natural Hazards, 111: 1301-1334.
[75] Muhammad Ramzanee, M.N., Shuib, R., Ida Sharmiza, A.H. (2022). GIS based sesimic vulnerability assessment in tourist attractions area: A case study in Bukit Tinggi, Pahang, Malaysia. Disaster Advances, 15(4): 1-12.
[76] Nguyen, L., Corotis, R.B. (2013). Seismic risk and society development indicators: Examination of three countries. Natural Hazards Review, 14(2): 122-133. https://doi.org/10.1061/(asce)nh.1527-6996.0000093
[77] Armaş, I., Toma-Danila, D., Ionescu, R., Gavriş, A. (2017). Vulnerability to earthquake hazard: Bucharest case study, Romania. International Journal of Disaster Risk Science, 8(2): 182-195. https://doi.org/10.1007/s13753-017-0132-y
[78] Anzala, M., Fatimah, E., Ismail, N. (2015). Kajian pemetaan kawasan risiko gempa bumi di Kabupaten Aceh Tengah. Jurnal Ilmu Kebencanaan (JIKA), 2(1): 19-27.
[79] UN Secretary-General. (2016). Report of the open-ended intergovernmental expert working group on indicators and terminology relating to disaster risk reduction. https://www.preventionweb.net/publication/report-open-ended-intergovernmental-expert-working-group-indicators-and-terminology.