Irma Dewiyanti![]() | Darmawi Darmawi*
| Darmawi Darmawi*![]() | Zainal A. Muchlisin
| Zainal A. Muchlisin![]() | Teuku Z. Helmi
| Teuku Z. Helmi![]() | Iko I. Arisa
| Iko I. Arisa![]()
© 2023 IIETA. This article is published by IIETA and is licensed under the CC BY 4.0 license (http://creativecommons.org/licenses/by/4.0/).
OPEN ACCESS
Mangrove ecosystems harbor diverse bacterial communities that significantly affect soil properties. Among these bacteria are cellulolytic species, which contribute to the breakdown of organic matter. This study aimed to analyze the total population of cellulolytic bacteria and their relationship with soil characteristics in mangrove ecosystems along the coast of Banda Aceh and Aceh Besar, Aceh Province, Indonesia. Six research locations were selected, with soil samples taken at three depth intervals: 0-15 cm (Layer 1), 15-30 cm (Layer 2), and 30-45 cm (Layer 3). The total population of cellulolytic bacteria was found to vary depending on both sampling location and soil depth. The highest total population of bacterial colonies was observed at location 2.3. However, on average, the soil surface (Layer 1) harbored a higher number of cellulolytic bacteria (13.0×10⁷ CFU g-1 dry soil) compared to Layers 2 and 3 (5.0×10⁷ and 8.0×10⁷ CFU g-1 dry soil, respectively). A significant correlation was observed between the total bacterial population and organic carbon content (P < 0.05), while no significant correlations were found with soil particle size, pH, salinity, total nitrogen, available phosphorus, or soil moisture (P > 0.05). Unrehabilitated mangrove ecosystems exhibited higher levels of cellulolytic bacterial populations, sand and silt fractions, pH, salinity, organic carbon, total nitrogen, and moisture compared to rehabilitated mangrove ecosystems.
Aceh Province, cellulolytic bacteria, mangrove, organic carbon, rehabilitated, soil properties, total population
Soil, a vital abiotic component, serves as a habitat for a myriad of organisms, including bacteria commonly found in mangrove ecosystems. These bacteria produce extracellular enzymes, such as cellulase, protease, and lipase, which play pivotal roles in these ecosystems [1, 2]. Mangroves are unique tropical ecosystems characterized by high levels of organic matter, nutrient recycling [3], and low-oxygen, muddy soil [4]. Cellulolytic bacteria and other extracellular enzyme-producing bacteria contribute to efficient biodegradation [5] by decomposing cellulose through cellulase synthesis [6]. As the primary structural component of plant cell walls, cellulose is the most abundant biomass on Earth [7]. The presence of cellulolytic bacteria in mangrove soil is facilitated by the decomposition of organic compounds, specifically cellulose from dead plants, which serves as a nutrient source for growth and enzyme production [8, 9].
Bacteria play an integral role in organic matter decomposition and nutrient mineralization for plant use [10-12]. Their population and activities are influenced by seasonal changes and the physical and chemical characteristics of the soil [13, 14]. Furthermore, environmental conditions affect the abundance and activity of cellulolytic bacteria [15, 16]. Several studies have indicated that soil organic matter and pH are among the major factors impacting the number and diversity of microorganisms [17, 18]. According to Fan et al. [19], the total number of bacteria is positively correlated with the organic matter content in an ecosystem. Bacteria directly participate in nutrient cycling and provide insight into soil quality through decomposition processes [20].
Forest ecosystem health assessments often evaluate ecological indicators such as tree growth, species diversity (biodiversity), population, and soil fertility [21]. In mangrove ecosystems, bacterial populations contribute to the biotransformation and biomineralization of minerals [22, 23]. Mangrove soil and leaf litter are abundant in cellulolytic bacteria [24-27], which adapt to salinity changes and low oxygen availability. However, some studies suggest that salinity does not necessarily determine microbial abundance in mangrove ecosystems [28]. Das and Dangar [29] reported average bacterial populations of 1.8-2.1×10⁶ and 2.2-6.0×10⁶ CFU per gram of mangrove soil with low salinity and without salinity, respectively. Bacterial populations vary in colony number, density, and diversity depending on soil type and depth. Previous studies have found a higher microbial density on the soil surface compared to other layers [30, 31], while others have reported high numbers deep below the soil surface [12, 32, 33]. Microbial biomass populations serve as valuable indicators of soil biology and fertility [34]. However, cellulolytic bacterial populations have not been examined in the mangrove ecosystems of Aceh Province.
Mangrove ecosystems along the coast of Aceh Besar and Banda Aceh districts are divided into rehabilitated and unrehabilitated areas, with different soil characteristics such as sand, silt, and clay percentages, salinity, organic carbon, total nitrogen, available phosphorus, and soil moisture, which affect cellulolytic bacterial species and abundance. The total bacterial population correlates with soil characteristics in the mangrove ecosystems. Therefore, investigating the presence of cellulolytic bacteria within different mangrove soil layers and types is essential. This study aims to analyze the total colonies and population of cellulolytic bacteria and their correlation with soil characteristics in both rehabilitated and unrehabilitated mangrove ecosystems.
2.1 Description of study site
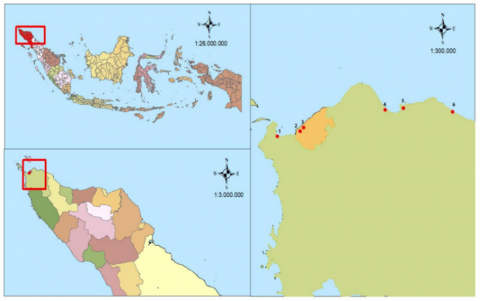
The study was conducted between July 2020 to February 2021 at two different sites, namely unrehabilitated and rehabilitated mangrove areas located on the coast of Banda Aceh and Aceh Besar districts in Indonesia. The rehabilitated mangrove area was the vegetation planted after the tsunami catastrophe in 2004, while the unrehabilitated was the undestroyed ecosystem. The rehabilitated mangroves were dominated by Rhizophora sp., but the three-common species in the unrehabilitated ecosystem included Rhizophora sp., Avicennia marina, and Sonneratia alba. The purposive sampling method was used to select six sampling locations, where numbers 1, 2, and 3 were rehabilitated, while 4, 5, and 6 were unrehabilitated, as shown in Figure 1 and Table 1.
Figure 1. Red dots showed the study location
Table 1. Location and coordinate of study area
|
NO. |
Location |
Coordinate |
|
1 |
Gampong Lambadeuk |
05°32'35.8"N 95°14'30.9"E |
|
2 |
Gampong Dayan Teungoh |
05°33'50.3"N 95°18'13.3"E |
|
3 |
Gampong Pande |
05°34'15.3"N 95°18'46.4"E |
|
4 |
Gampong Ruyung |
05°36'08.2"N 95°29'46.8"E |
|
5 |
Gampong Lamreh |
05°36'30.0"N 95°32'18.1"E |
|
6 |
Gampong Lampanah |
05°35'25.1"N 95°40'20.9"E |
2.2 Soil sampling
Soil sampling was carried out at six locations which was further categorized into three sampling points based on soil depth. At each location, samples were selected randomly at three depths, namely 0-15 cm (surface/1st layer), 15-30 cm (2nd), and 30-45 cm (3rd). There were differences in the level of soil depth sampling applied by several studies. For example, Ambeng et al. [35] collected soil samples from three depths, namely 0-15 cm, 15-30, and 30-45. Pupin and Nahas [36] divided soil depth into 0-5 cm and 5-10 cm, while Akpan and Solomon [37] only obtained samples at the depth of 0-20 cm. Approximately 100 g of soil was collected from each study point using a sterilized spatula, then replicated three times, combined to form a composite sample, and dropped into sterilized plastic bags. The samples were transported to the microbiology laboratory of SKIPM, Aceh for isolation and calculation of the bacteria population. Additionally, they were analyzed for measurements of pH, salinity, organic carbon, N-total, P-available, moisture, and soil texture (sand, dust, and clay fractions) at the soil laboratory of the Agriculture Faculty, Universitas Syiah Kuala (USK).
2.3 Preparation of selective media
Selective media for cellulolytic bacteria were prepared by weighing 1 g of CMC, 0.02 g of MgSO4.7H2O, 0.05 g of KH2PO4, 0.075 of KNO3, 0.002 of FeSO4, 0.004 of CaCl2, 0.2 g of yeast extract, 1.5 g of Bacto agar, and 0.1 g of glucose. All these materials were put into 100 mL of distilled water and poured inside an Erlenmeyer flask, then covered with aluminum foil and plastic wrap. The media were sterilized in an autoclave at 121℃ with a pressure of 1 atm for 15 minutes and subsequently transferred into a sterilized petri dish.
2.4 Estimation of cellulolytic bacterial population
Up to 1 g of the mangrove soil sample was weighed and diluted from 10-1 to 10-6 with a NaCl physiological solution. About 1 mL of the 10-4, 10-5, and 10-6 dilutions were spread on media enriched with 1% CMC (Carboxy Methyl Cellulose) using a scattering rod in a duplicate manner. This was incubated at 30℃ for 48 h to count the number of colonies formed in different samples. The total population of cellulolytic bacteria per unit gram of the media (CFU. g-1) was also calculated using the Total Plate Count (TPC) method [37]. The number of microorganisms obtained with the TPC method is only an estimate and possibly greater than the actual number [38]. Bacteria are counted only from Petri dishes which have 30-300 colonies [39]. The total population can be calculated using the following formula [39, 40].
Total population $(\mathrm{CFU}) \mathrm{g}^{-1}$ of dried soil $=\frac{(\text { number of colinies }) X(d f)}{d w \text { soil }}$
df = dilution factor (10-4, 10-5, and 10-6)
dw = dry weight of soil sample (g) = wet weight x (1-water content)
2.5 Data analysis
Data on the cellulolytic bacterial population were analyzed descriptively, then presented in tables. The soil properties distribution was analyzed descriptive statistical with boxplot and biplot. The correlation between bacterial population and soil properties was determined using the Spearmen test, and the data obtained were analyzed with the R Studio software. Differences between the two environments were assessed using the Mann-Whitney-Wilcoxon Test and visualized using R Studio's Ggplot.
Based on the results, the number of cellulolytic bacteria colonies was different in each soil depth and sampling location with three dilutions (10-4, 10-5, and 10-6). Figure 2 shows bacteria colonies growing on Carboxy Methyl Cellulose (CMC) media incubated at 37℃ for 48 h.
Figure 2. Cellulolytic bacteria that grow in CMC media with different dilutions (a)10-4, (b)10-5, and (c)10-6
Generally, it was observed that the total colony decreased with increasing dilution. In the mangrove soil with 10-4, 10-5, and 10-6 dilution, the bacterial population ranged from 3.9 to 32.9×10⁵, 3.7-32.9×10⁶, and 3.1-27.2×10⁷ CFU. g-1 dry soil, respectively. The highest population of cellulolytic bacteria, reaching 32.9×10⁵, 32.9×10⁶, and 27.2×10⁷ CFU. g-1 dry soil was found at location 2.3 with a soil depth of 30-45 cm (3rd layer). Location 3.1 had 24.7×10⁷ CFU. g-1, while 5.1 had 22.0×10⁷ CFU. g-1. The lowest population was found at locations 1.2, 1.3, and 6.1, namely 3.1×10⁷ CFU. g-1. Complete data on the total and average total population at the six locations and three depths are presented in Tables 2 and 3.
The number of bacterial colonies in mangrove soil varies based on habitat characteristics. The total population of cellulolytic bacteria at the 10-5 dilution ranged from 3.7 to 32.9×10⁶ CFU. g-1, higher than the 1.8-2.1×10⁶ CFU. g-1 in soil containing salinity [29]. Moreover, Khotimah et al. [41] stated the population of cellulolytic bacteria in peat soil forests was 4.9×10⁴ CFU. g-1. The range of total bacteria is different at each level of dilution. According to Olsvik et al. [42], the purpose of multilevel dilution is to reduce the number of microbes growing in a media, hence, only fewer microbes are produced at a higher dilution. Cellulolytic bacteria populations differ between regions and environments [43]. This study shows that variations in the cellulolytic bacterial population are influenced by environmental factors and soil characteristics.
The highest total population of cellulolytic bacteria at location 2.3, this is possibly due to a higher soil organic carbon (SOC) content (2.18%) at that location compared to other locations. A high density of the bacteria population correlates to soil physical and chemical characteristics as well as thickness. The higher the sediment thickness, the higher the concentration of bacteria [35]. A high bacterial population indicates an adequate supply of food sources. Bacteria break down organic matter and recycle nutrients, thereby influencing both soil chemical and physical characteristics. Several studies stated soil pH and organic matter content as the main characteristics affecting the number and diversity of microorganisms [17, 18].
Table 2. Number of colonies and the total population of cellulolytic bacteria in mangrove soil
|
Station |
Dilution 10-4 (colony) |
Total Population (CFU. g-1) |
Dilution 10-5 (colony) |
Total Population (CFU. g-1) |
Dilution 10-6 (colony) |
Total Population (CFU. g-1) |
|
1.1 |
300 |
30.6×10⁵ |
300 |
30.6×10⁶ |
87 |
8.9×10⁷ |
|
1.2 |
38 |
3.9×10⁵ |
36 |
3.7×10⁶ |
30 |
3.1×10⁷ |
|
1.3 |
250 |
26.1×10⁵ |
52 |
5.4×10⁶ |
30 |
3.1×10⁷ |
|
2.1 |
300 |
30.8×10⁵ |
300 |
30.8×10⁶ |
68 |
7.0×10⁷ |
|
2.2 |
300 |
31.0×10⁵ |
48 |
5.0×10⁶ |
33 |
3.4×10⁷ |
|
2.3 |
300 |
32.9×10⁵ |
300 |
32.9×10⁶ |
256 |
27.2×10⁷ |
|
3.1 |
300 |
31.7×10⁵ |
300 |
31.7×10⁶ |
240 |
24.7×10⁷ |
|
3.2 |
300 |
31.0×10⁵ |
67 |
6.9×10⁶ |
32 |
3.3×10⁷ |
|
3.3 |
88 |
9.3×10⁵ |
53 |
5.6×10⁶ |
31 |
3.3×10⁷ |
|
4.1 |
300 |
31.8×10⁵ |
263 |
27.9×10⁶ |
72 |
7.6×10⁷ |
|
4.2 |
153 |
16.0×10⁵ |
113 |
11.8×10⁶ |
91 |
9.5×10⁷ |
|
4.3 |
53 |
6.0×10⁵ |
42 |
4.7×10⁶ |
42 |
4.7×10⁷ |
|
5.1 |
226 |
24.0×10⁵ |
300 |
31.9×10⁶ |
200 |
22.0×10⁷ |
|
5.2 |
104 |
11.1×10⁵ |
40 |
4.3×10⁶ |
39 |
4.1×10⁷ |
|
5.3 |
230 |
24.7×10⁵ |
220 |
23.7×10⁶ |
64 |
6.9×10⁷ |
|
6.1 |
250 |
25.9×10⁵ |
106 |
11.0×10⁶ |
30 |
3.1×10⁷ |
|
6.2 |
144 |
15.2×10⁵ |
66 |
7.0×10⁶ |
39 |
4.1×10⁷ |
|
6.3 |
130 |
14.7×10⁵ |
77 |
8.7×10⁶ |
44 |
5.0×10⁷ |
1, 2, 3, 4, 5, 6: sampling location; 1, 2, 3: level of soil depth (layer)
Table 3. The average total bacterial population at different soil depth
|
Variable |
Unit |
1st layer (0-15 cm) |
2nd layer (15-30 cm) |
3rd layer (30-45 cm) |
|
Total bacterial population |
CFU×105. g-1 |
29.1 |
18.0 |
19.0 |
|
CFU×106. g-1 |
27.3 |
6.5 |
13.5 |
|
|
CFU×107. g-1 |
12.2 |
4.6 |
8.4 |
Table 4. Characteristics of mangrove soil based on depth
|
Parameters |
Unit |
1st layer (0-15 cm) |
2nd layer (15-30 cm) |
3rd layer (30-45 cm) |
|
Sand |
% |
59.8 |
53.5 |
42.8 |
|
Silt |
% |
35.0 |
32.0 |
43.2 |
|
Clay |
% |
5.2 |
14.2 |
14.0 |
|
Texture |
- |
Sandy loam |
Sandy loam |
Dusty loam |
|
pH |
- |
7.6 |
6.5 |
7.3 |
|
Salinity |
μscm-1 ppt |
5.6 3.02 |
6.4 3.49 |
9.6 5.39 |
|
Organic Carbon |
% |
1.00 |
0.95 |
1.27 |
|
N total |
% |
0.08 |
0.06 |
0.09 |
|
P available |
ppm |
27.92 |
26.05 |
26.19 |
|
Moisture |
% |
3.72 |
4.47 |
7.99 |
According to Fan et al. [19], the total number of bacteria is positively correlated with the organic matter content in an ecosystem. Furthermore, Huang et al. [44] stated that bacterial number and diversity increase proportionally with soil organic matter. Commonly, at the 3rd soil layer near wider roots, the mangrove rhizosphere is rich in nutrients, including sugars, amino acids, organic acids, and fatty acids from root exudates, which commonly lead to a dominant bacterial population [45]. Bacteria in the rhizosphere have a symbiotic relationship with plant roots since their exudates serve as the main food source for microorganisms [46].
Otherwise based on soil depth, the average total population of cellulolytic bacteria on the soil surface was higher compared to 2nd and 3rd layers for all dilution series. The values obtained in the 1st, 2nd, and 3rd layers at 10-6 dilution were 12.2×10⁷, 4.6×10⁷, and 8.4×10⁷ CFU. g-1 dry soil, respectively. Meanwhile, at dilutions 10-4 and 10-5, each layer had 29.1×10⁵, 18.0×10⁵, and 19.0×10⁵ CFU. g-1 and 27.3×10⁶, 6.5×10⁶, and 13.5×10⁶ CFU. g-1 dry soil, as presented in Table 2. Kruskal Wallis analysis showed that the relationship between bacterial population and soil depth (layer) had significant relationship where Psig.<0.05. Moreover, the analysis obtained that there was a significant difference the bacterial population at 1st layer and 2nd layer (Psig. <0.05), whereas, there were no significant difference at 2nd and 3rd layers, and at 1st and 3rd layers (Psig.>0.05). The Psig value of 1st and 2nd layers, 2nd and 3rd layers, and 1st and 3rd layers were 0.003, 0.882, and 0.078, respectively.
The highest bacterial population was detected in the 1st layer, followed by the 3rd and 2nd. The soil surface contains a high number of bacterial colonies, which decreases with increasing depth due to less sunlight and organic matter. Furthermore, organic matter is mainly concentrated on the surface due to leaf litter [47]. The lowest bacterial population is found in the 2nd layer at a depth of 15-30 cm. Some factors causing a smaller number of microorganisms are compact soil and low organic matter [48], as well as soil strata [31].
The bacterial community in soil sediments depends on depth, porosity, organic matter, and pH [31]. Soil organic carbon is higher in fine soil with small porosity compared to coarse soil with big porosity. Soil texture influences bacterial population, where a high population is possibly due to higher percentages of silt and clay with fine texture, than sand with coarse texture. Carney and Matson [49] mentioned that fine-textured soils support more microbial biomass than their coarse-textured counterpart. Moreover, texture as an abiotic factor may also affect mineral distribution, organic matter retention, microbial biomass, and other soil characteristics [50]. The small size of soil pores and pore space distribution greatly influence bacteria and fungi abundance as well as high carbon levels [51]. As in research Hamarashid et al. [52], the highest bacteria population (8.77 and 8.03 log CFU. g-1 dry weight of soil) in dusty clay soil and silty clay, while sandy loam and silty soil have the lowest (6.07 and 6.42 log CFU. g-1), the same result as location 2.3 supported by fine texture and high soil organic carbon.
Table 4 showed the value of pH, salinity, organic carbon, N total, P-available, moisture, soil fraction, and the texture of each soil layer. Soil fractions in the study area consisted of sand, silt, and clay. The sand was higher at the 1st layer than at the 2nd, and 3rd, with values of 59.8%, 53.5%, and 42.8%, respectively. The soil texture of the 1st and 2nd layers were sandy loam, while the 3rd had dusty loam. The soil pH was 6.5 - 7.6 and the salinity ranged from 5.6 - 9.6 (μscm-1) which was equal to 3.02 - 5.39 ppt. The highest salinity and soil moisture value were in the 3rd layer, the value was 5.39 ppt and 7.99%. There was more soil organic carbon (SOC) and N-total in the 3rd layer compared to the other layers (1.27 and 0.09%).
Soil acidity (pH) level affects microorganisms living in the mangrove areas. The pH at the study site low and leads to acid in 2nd soil layer, and neutral in the 1st and 3rd layer, the average value measured at the 1st, 2nd, and 3rd depths were 7.6, 6.5, and 7.3, respectively. The bacterial population observed decreased with decreasing pH, indicating that low soil pH leads to fewer bacteria. These results were consistent with the statement of Zi et al. [53] that soil microbial population and pH decrease proportionally due low pH inhibited the presence of soil microorganism. Furthermore, recent studies showed a relationship between bacteria composition, diversity, and soil pH [54, 55], bacterial diversity and abundance high in soil neutral and low in acidic soil [56]. Soil surface has higher pH than the deeper layers due to high organic matter from decomposed leaf litter, causing soil sediment to become neutral [55]. In soil, pH is an important soil property that can stimulate soil microbial community structures [57]. The pH value at the study site was still in the suitable range that favors bacterial growth.
Furthermore, the soil salinity increased with depth, where a higher bacterial population was found at a soil depth containing lower salinity (1st layer) compared to the 2nd and 3rd. This contradicts the result by Pupin and Nahas [36] who detected higher salinity (11.62 mscm-1) on the mangrove soil surface (0-2 cm). The salinity contained in the 1st, 2nd, and 3rd layers were 5.6 mscm-1 (3.02 ppt), 6.4 mscm-1 (3.49 ppt), and 9.65 mscm-1 (5.39 ppt). Several studies reported that salinity is not a determining factor for the presence of microbes associated with the dynamics of mangrove ecosystems [28]. However, soil salinity can affect microorganisms' composition and number [58]. The bacterial community in saline soil changes with salinity [59, 60], where the number and phylogenetic diversity of bacteria decrease alongside increasing salinity. High salinity was reported to have a significant negative impact on the microbial population [61].
According to Wang et al. [62] and Ramirez et al. [63], soil Nitrogen (N) was associated with bacterial biomass and diversity, and soil bacterial biomass will increase in mangrove soil containing high P element [64]. Nitrogen (N) is an important element that affects soil fertility and environmental quality. The range of N-total contained in soil for each depth was 0.08% (1st layer), 0.06% (2nd), and 0.09% (3rd), while the values of P-available in each depth were 27.92 ppm, 27.05 ppm, and 26.19 ppm, respectively. The highest P-available was in the 1st layer which contained the highest bacterial population. The availability of sufficient N and P may elevate plant productivity, leading to the increased release of plant exudates into the soil. Consequently, cellulose-degrading bacteria that utilize the litter from plant in the area will become more abundant [65]. High soil nutrient levels (N, P, K) in the rainy season boost the microbial population [66]. Increasing both P and N has a synergistic effect on microbial population growth [67].
Figure 3 shows the distribution of bacterial population and soil characteristics in study area. A non-normal distribution of the total population was formed because the boxplot was not symmetrical, with more skewness to the right and three outliers. Up to 50% of the total population was below 4.92×10⁷ CFU. g-1. Sand, silt, and N-total were normally distributed since the boxplot was symmetrical with no outliers. Half of these three parameters were below 52%, 39%, and 0.07%, respectively. Furthermore, clay, pH, salinity, organic carbon, P-available, and soil moisture had non-normal distributions. Furthermore, half of them were below 5%, 7.40, 6.25 μscm-1, 1.09%, 26.43 ppm, and 5.15%, respectively.
Figure 4 shows that the correlation between the total population and soil characteristics statistically, some variable lacks a parametric pattern, but some produced two curves. Due to the non-normal distribution of the data, the nonparametric Spearmen correlation method was used.
Based on Table 5, there was a strong significant correlation (0.65) between the cellulolytic bacteria population and organic carbon (Psig<0.05). However, the correlation with soil fraction, pH, salinity, N-total, P-available, and soil moisture was insignificant correlation (Psig>0.05). The total population had a negative correlation with sand, clay, pH, and P-available, but it shared a positive correlation with silt, salinity, N-total, P-available, and moisture.
Figure 3. Boxplot of the soil characteristics and cellulolytic bacteria population in each sampling location
Table 5. Correlation between the total population and soil characteristics
|
No |
Variable 1 |
Variable 2 |
Correlation |
P-sig |
Significant/ notsignificant |
|
1 |
Total population |
Sand |
-0.36 |
0.14 |
Not significant |
|
2 |
Total population |
Silt |
0.43 |
0.08 |
Not significant |
|
3 |
Total population |
Clay |
-0.13 |
0.61 |
Not significant |
|
4 |
Total population |
pH |
-0.07 |
0.77 |
Not significant |
|
5 |
Total population |
Salinity |
0.15 |
0.54 |
Not significant |
|
6 |
Total population |
Organic Carbon |
0.65 |
0.00* |
Significant |
|
7 |
Total population |
N-total |
0.35 |
0.16 |
Not significant |
|
8 |
Total population |
P-available |
-0.20 |
0.42 |
Not significant |
|
9 |
Total population |
Moisture |
0.17 |
0.50 |
Not significant |
Figure 4. The distribution of correlation between the total bacterial population and soil characteristics
Soil organic carbon (SOC) significantly influenced the bacteria population and the correlation between both was strong and positive. Commonly, high SOC can stimulate high bacterial population activity. Hua et al. [68] stated that the dynamics of the bacterial population have a high correlation with soil carbon availability. Bacteria as microorganisms can promote the formation of soil aggregates to store carbon. They are also essential decomposers that play a critical role in carbon cycling [69, 70]. The organic carbon in the 1st and 3rd layers was categorized as low, while the 2nd was very low. Organic carbon is classified as very low (provided the content <1.00%), low (1-2.00%), moderate (2.01-3.00%), and high (>5.00%) [71].
The boxplot in Figure 5 explains the differences between soil parameters measured in the two study areas (rehabilitated and unrehabilitated) based on median values. The data obtained were not normally distributed and included some outlier points.
The unrehabilitated mangroves had a higher total bacterial population (5.07×10⁷ CFU. g-1) than the rehabilitated counterpart (3.47×10⁷ CFU. g-1). Percentage values of the sand fraction had a nearly similar median between both areas, namely 52% and 53%. Soil organic carbon was higher in the unrehabilitated mangroves than in the rehabilitated with values of 1.23% and 0.90%, respectively. Furthermore, the values of dust, pH, salinity, N-total, and moisture were higher in the unrehabilitated area. In contrast, there was more P content in the rehabilitated area.
Table 6. The differences between total population and soil characteristics based on the study areas
|
No |
Parameters |
Median |
Psig. |
|
|
Mangrove Rehabilitated |
Mangrove Unrehabilitated |
|
||
|
1 |
Total population (107 CFU. g-1) |
3.47 |
5.07 |
0.666 |
|
2 |
Sand (%) |
53 |
52 |
0.796 |
|
3 |
Silt (%) |
31 |
43 |
0.931 |
|
4 |
Clay (%) |
5 |
5 |
0.863 |
|
5 |
pH |
7.23 |
7.86 |
0.222 |
|
6 |
Salinity (mscm-1) |
5.6 |
7.6 |
0.077 |
|
|
(ppt) |
3.02 |
4.19 |
|
|
7 |
Organic carbon (%) |
0.90 |
1.23 |
0.113 |
|
8 |
N-total (%) |
0.06 |
0.07 |
0.489 |
|
9 |
P-available (ppm) |
38.05 |
7.55 |
0.001* |
|
10 |
Moisture (%) |
3.09 |
5.93 |
0.014* |
* Significantly different at α 5%
Figure 5. Ggplot distribution of bacterial population and soil characteristics in rehabilitated and unrehabilitated mangrove
The unrehabilitated mangroves contained more bacteria and organic carbon than the rehabilitated mangrove ones due to more vegetation. There were 70 individuals. 100m-2 in unrehabilitated compared to 39 individuals. 100m-2 in their counterparts. Vegetation litter significantly contributes organic carbon to mangrove soil [72], which promotes the abundance and diversity of cellulolytic bacteria. Furthermore, the number of microbes can vary in soils due to distinctions in the amount of litter and vegetation in different ecosystems [73]. Cellulolytic bacteria provide carbon sources to improve soil fertility and mangrove productivity [74].
Furthermore, the Mann-Whitney-Wilcoxon test was used to determine the significance of differences in soil parameters between the rehabilitated and unrehabilitated mangrove areas. Significant differences were found between P-available and soil moisture (Psig<0.05), but the total population, sand, silt, clay, pH, salinity, organic carbon, and N-total had no significant differences (Psig>0.05) between study areas, as presented in Table 6. Kurth et al. [75] found that higher soil P content leads to an increased absolute and relative abundance of bacteria involved in P changes. Baumann et al. [76] concluded that the microbiome directly transfers and immobilizes P, while sandy soil texture reduces its absorption, leading to high P content.
The result of research concluded that the bacterial population in mangrove soil varies based on soil depth and mangrove sites (rehabilitated and unrehabilitated). In the average, the total bacterial population isolated was higher in the surface soil or 1st layer with a depth of 0-15 cm, than in the 2nd (15-30 cm) and 3rd layers (30-45 cm), and followed by 3rd layer. Differences in the level of soil depth sampling will lead to differences in bacteria population, and there was the significant relationship between bacteria population and soil depth. Bacteria population was significantly different at 1st and 2nd soil layers. Specifically, location 2.3 contain more cellulolytic bacteria than other location due to highest soil organic carbon in this location. This study shows that variations in the cellulolytic bacterial population are influenced by environmental factors and soil characteristics, such as pH, salinity, soil fraction, organic carbon, N-total, P-available and moisture. The value obtained had a strong correlation soil organic carbon content with total of bacteria population, and fine soil texture support the presence of bacteria population compare to the coarse soil. The presence of bacterial populations can affect the soil characteristics and vice versa.
Furthermore, more bacterial population and soil organic carbon were recorded in soil of the unrehabilitated mangrove site compared to the rehabilitated counterpart. The number of mangrove vegetation is higher in mangrove unrehabilitated than rehabilitated, so contribute more litter production and stimulate soil fertility in unrehabilitated site. Soil characteristics including P-available and moisture significantly different (Psig<0.05) between both sites, however the total population, sand, silt, clay, pH, salinity, organic carbon, and N-total had no significant differences (Psig>0.05) between sites.
The authors are grateful to the Universitas Syiah Kuala for providing research grants through the PNBP research (Lector scheme) with grant numbers: 270/UN11/SPK/PNBP/2020. Furthermore, the authors would like to thank to Dila, Iko, Erly, Rahmi for their assistance during the fieldwork.
[1] Sahoo, K., Dhal, N.K. (2009). Potential microbial diversity in mangrove ecosystems: A review. Indian Journal of Marine Sciences, 38(2): 249-256.
[2] Dias, A.C.F., Andreote, F.D., Dini-Andreote, F., Lacava, P.T., Sá, A.L.B., Melo, I.S., Azevedo, J.L., Araújo, W.L. (2009). Diversity and biotechnological potential of culturable bacteria from Brazilian mangrove sediment. World Journal Microbiology and Biotechology, 25: 1305-1311. https://doi.org/10.1007/s11274-009-0013-7
[3] Holguin, G., Vazquez, P., Bashan, Y. (2001). The role of sediment microorganisms in the productivity, conservation, and rehabilitation of mangrove ecosystems: An overview. Biology and Fertility of Soils, 33: 265-278. https://doi.org/10.1007/s003740000319
[4] Srikanth, S., Kaihekulani, K., Lum, Y., Chen, Z. (2015). Mangrove root: Adaptations and ecological importance. Trees, 30: 451-456. https://doi.org/10.1007/s00468-015-1233-0
[5] Joutey, N.T., Bahafid, W., Sayel, H., Ghachtouli, N.E. (2013). Biodegradation: involved microorganisms and genetically engineered microorganisms. Intech Open Science, Open Minds, p 11. https://doi.org/10.5772/56194
[6] Gunavathy, P., Boominathan, M. (2015). Isolation and molecular characterization of cellulase producing bacteria from soil of Sacred Grove, Puducherry, India. International Journal of Current Microbiology and Applied Sciences, 4(12): 584-590.
[7] Zhang, Y.H.P., Lynd, L.R. (2004). Toward an aggregated understanding of enzymatic hydrolysis of cellulose: Noncomplexed cellulase systems. Biotechnology and Bioengineering, 88(7): 797-824. https://doi.org/10.1002/bit.20282
[8] Thatoi, H., Bikash, C.B., Rashmi R.M., Dutta, S.K. (2013). Biodiversity and biotechnological potential of microorganisms from mangrove ecosystems: A review. Annals of Microbiology, 63: 1-19. https://doi.org/10.1007/s13213-012-0442-7
[9] Naresh, S., Balakrishnan, K., Ahmad, A.N.G., Yi, P., Siew, H., Qi, H., Peng, Y. (2019). Isolation and partial characterization of thermophilic cellulolytic bacteria from north Malaysian tropical mangrove soil. Tropical Life Sciences Research, 30(1): 123-147. https://doi.org/10.21315/tlsr2019.30.1.8
[10] McGuire, K.L., Fierer, N., Bateman, C., Treseder, K.K., Turner, B.L. (2012). Fungal community composition in neotropical rain forests: The influence of tree diversity and precipitation. Microbial Ecology, 63(4): 804-812. https://doi.org/10.1007/s00248-011-9973-x
[11] Elliott, D.R., Caporn, S.J.M., Nwaishi, F., Nilsson, R.H., Sen, R. (2015). Bacterial and fungal communities in a degraded ombrotrophic peatland undergoing natural and managed re-vegetation. PLoS ONE, 10(5): e0124726. https://doi.org/10.1371/journal.pone.0124726
[12] Senga, Y., Mikiya, H., Nohara, S.T.S. (2015) Variation in microbial function through soil depth profiles in the Kushiro Wetland, Northern Hokkaido. Ecological Research, 30: 563-572. https://doi.org/10.1007/s11284-015-1257-3
[13] Zhang, Y.Y., Dong J.D., Yang, B., Ling, J., Wang, Y.S., Zhang, S. (2009). Bacterial community structure of mangrove sediments in relation to environmental variables accessed by 16S rRNA gene-denaturing gradient gel electrophoresis fingerprinting. Scientia Marina, 73(2): 487-498. https://doi.org/10.3989/scimar.2009.73n3487
[14] Oller Costa, P.M., Souza-Motta, C.M., Malosso, E. (2012). Diversity of filamentous fungi in different systems of land use. Agroforestry Systems, 85(1): 195-203. https://doi.org/10.1007/s10457-011-9446-8
[15] Dilly, O., Bartsch, S., Rosenbrock, P., Buscot, F., Munch, J.C. (2001). Shifts in physiological capabilities of the microbiota during the decomposition of leaf litter in a black alder (Alnus glutinosa (Gaertn.) L.) forest. Soil Biology and Biochemistry, 33(7-8): 921-930. https://doi.org/10.1016/S0038-0717(00)00239-X
[16] Ulrich, A., Klimke, G., Wirth, S. (2008). Diversity and activity of cellulose-decomposing bacteria, isolated from a sandy and a loamy soil after long-term manure application. Microbial Ecology, 55(3): 512-522. https://doi.org/10.1007/s00248-007-9296-0
[17] Pupin, B., Freddi, O.S., Nahas, E. (2009). Microbial alterations of the soil influenced by induced compaction. Revista Brasileira de Ciencia do Solo, 33(5): 1207-1213. https://doi.org/10.1590/S0100-06832009000500014
[18] Rahman, M.H., Ismal, M.R., Jahiruddin, M., Puteh, A.B., Mondal, M.M.A. (2013). Influence of organic matter on nitrogen mineralization pattern in soils under different moisture regimes. International Journal of Agriculture and Biology, 15(1): 55-61.
[19] Fan, L.F., Shieh, W.Y., Wu, W.F., Chen, C.P. (2006). Distribution of nitrogenous nutrients and denitrifies strains in estuarine sediment profiles of the Tanshui River, Taiwan. Estuarine Coastal Shelf Science, 69(3): 543-553. https:/doi.org/10.1016/j.ecss.2006.05.016
[20] Hafich, K., Perkins, E.J., Hauge, J.B., Barry, D., Eaton, W.D. (2012). Implications of land management on soil microbial communities and nutrient cycle dynamics in the lowland tropical forest of northern Costa Rica. Tropical Ecology, 53(2): 215-224.
[21] Safe’I, R., Kaskoyo, H., Ardiansyah, F. (2022). Trend analysis of mangrove forest health in East Lampung regency as community preparedness for natural disasters. International Journal of Design & Nature and Ecodynamics, 17(6): 943-949. https://doi.org/10.18280/ijdne.170616
[22] Selvam, M.M., Kathiresan, K. (2010). Beneficial bacteria from soil of a tropical mangrove. Asian Journal of Microbiology, Biotechnology & Environmental Sciences, 12(1): 89-96.
[23] Mendes, L.W., Tsai, S.M. (2018). Distinct taxonomic and functional composition of soil microbiomes along the gradient forest-restinga mangrove in southeastern Brazil. Antonie van Leeuwenhoek. International Journal of General and Molecular Microbiology, 111(1): 101-114. https://doi.org/10.1007/s10482-017-0931-6
[24] Kurniawan, A., Sari, S.P., Asriani, E., Kurniawan, A., Sambah, A.B., Prihanto, A.W. (2018). Isolation and identification of cellulolytic bacteria from mangrove sediment in Bangka Island. IOP Conf. Series: Earth and Environmental Science, 137: 012070. https://doi.org/10.1088/1755-1315/137/1/012070
[25] Kurniawan, A., Sari, S.P., Asriani, E., Kurniawan, A., Sambah, A.B., Prihanto, A.W. (2018). Mangrove leaf litter cellulolytic bacteria on Bangka Island. Samakia, 9(1): 6-11.
[26] Chantarasiri, A. (2015). Aquatic Bacillus cereus JD0404 isolated from the muddy sediments of mangrove swamps in Thailand and characterization of its cellulolytic activity. The Egyptian Journal of Aquatic Research, 41(3): 257-264. https://doi.org/10.1016/j.ejar.2015.08.003
[27] Ningsih, R.L., Khotimah, S., Lovadi I. (2014). Cellulose degradation bacteria from Avicennia alba blume leaf litter in the safety mangrove forest in Pontianak Regency. Protobiont, 3(1): 34-40.
[28] Essien, J.P., Antai, S.P., Benson, N.U. (2006). Microbial population dynamics as a function of sediment salinity gradients in the qua lboe estuary mangrove swamp (Nigeria). Research Journal of Microbiology, 5(6): 542-552. https://doi.org/10.3923/jm.2006.255.265
[29] Das, J., Dangar, T.K. (2008). Microbial population dynamics, especially stress tolerant Bacillus thuringiensis, in partially anaerobic rice field soils during postharvest period of the Himalayan, island, brackish water and coastal habitats of India. World Journal of Microbiology and Biotechnology, 24: 1403-1410. https://doi.org/10.1007/s11274-007-9620-3
[30] Fierer, N., Schimel, J.P., Holden, P.A. (2003). Variations in microbial community composition through two soil depth profiles. Soil Biology and Biochemistry, 35(1): 167-176. https://doi.org/10.1016/S0038-0717(02)00251-1
[31] Begum, A. (2020). Variation of bacterial population in four soil depths in the Sundarbans mangrove forest, Bangladesh. International Journal of Advanced Research in Biological Sciences, 7(6): 65-76. http://dx.doi.org/10.22192/ijarbs.2020.07.06.006
[32] Fritze, H., Pietikainen, J., Pennanen, T. (2000). Distribution of microbial biomass and phospholipid fatty acids in Podzol profiles under coniferous forest. European Journal of Soil Science, 51(4): 565-573. https://doi.org/10.1111/j.1365-2389.2000.00346.x
[33] Blume, E., Bischoff, M., Reichert, J.M., Moorman, T., Konopka, A., Turco, R.F. (2002). Surface and subsurface microbial biomass, community structure and metabolic activity as a function of soil depth and season. Applied Soil Ecology, 20(3): 171-181. https://doi.org/10.1016/S0929-1393(02)00025-2
[34] Dewi, W.S., Puspaningrum, A., Tinuntun, R.S.T., Suntoro, S., Mujiyo. (2022). A modified soil fertility assessment method using earthworm density and microbial biomass C at various land uses in Wonogiri, Indonesia. International Journal of Design & Nature and Ecodynamics, 17(6): 929-936. https://doi.org/10.18280/ijdne.170614
[35] Ambeng., Zubair, H., Oka, N.P., Tonggiroh., A. (2019) Isolation and characterization of bacteria from mangrove sediment at coastal area in Pangkep South Sulawesi. Journal of Physics: Conference Series, 1341(2): 022016. https://doi.org/10.1088/1742-6596/1341/2/022016
[36] Pupin, B., Nahas, E. (2013). Microbial populations and activities of mangrove, restinga and atlantic forest soils from Cardoso Island, Brazil. Journal of Applied Microbiology, 116(4): 851-864. https://doi.org/10.1111/jam.12413
[37] Akpan, I.A.U., Solomon. (2012). Bacterial isolates of the mangrove swamp soils in cross River Estuary, South-East Nigeria. Research Journal of Soil Biology, 4(2): 32-41. http://doi.org/10.3923/rjsb.2012.32.41
[38] Singleton, S. (2006). Dictionary of Microbiology and Molecular Biology. 3rd Edition, Jhon Wiley and Sons, Sussex, England.
[39] Skinner, F.A., Jones P.C.T., Mollison, J.E. (1952). A comparison of a direct and plate counting technique for quantitative estimation of soil microorganisms. The Journal of General Microbiology, 6(3-4): 261-271. https://doi.org/10.1099/00221287-6-3-4-261
[40] Foght, J., Aislabie, J. (2005). Enumeration of soil microorganisms. in: monitoring and assessing soil bioremediation. Soil Biology, Springer, Berlin, Heidelberg. https://doi.org/10.1007/3-540-28904-6_13
[41] Khotimah, S., Suharjono., Ardyati, T., Nurani, Y. (2020). Isolation and identification of cellulolytic bacteria at fibric, hemic, and sapric peat in Teluk Bakung Peatland, Kubu Raya District, Indonesia. Biodiversitas, 21(5): 2103-2112. https://doi.org/10.13057/biodiv/d210538
[42] Olsvik, Ø., Wasteson, Y., Hornes, E. (2009). Pathogenic Escherichia coli found in food. International Journal Food Microbiology, 12(1): 103-113. https://doi.org/10.1016/0168-1605(91)90051-p
[43] Trujillo-Cabrera, Y., Vásquez-Murrieta, M.S., Rivera-Orduña, F.N., Wang, E.T. (2013). Diverse cellulolytic bacteria isolated from the high humus, alkaline-saline chinampa soils. Annals of Microbiology, 63: 779-792.
[44] Huang, X., Zhao, J., Zhou, X., Zhang, J., Cai, Z. (2019). Differential responses of soil bacterial community and functional diversity to reductive soil disinfestation and chemical soil disinfestation. Geoderma, 348: 124-134. https://doi.org/10.1016/j.geoderma.2019.04.027
[45] Batubara, U.M., Suparjo, Ui Maritsa, H., Pujianto, E., Herlini, M. (2022) Screening and determination of potential cellulolytic bacteria from mangrove ecosystem. Jurnal Perikanan dan Kelautan, 27(2): 264-271.
[46] Raaijmakers, J.M., Paulitz, T.C., Steinberg, C., Alabouvette, C., Moënne-Loccoz, Y. (2009). The rhizosphere: A playground and battlefield for soil borne pathogens and beneficial microorganisms. Plant Soil, 321: 341-361. https://doi.org/10.1007/s11104-008-9568-6
[47] Krishna, M.P., Rinoy, V., Mohamed, H.A.A. (2012). Depth wise variation of microbial load in the soils of midland region of Kerala: A function of important soil physicochemical characteristics and nutrients. Indian Journal of Education and Information Management, 1(3): 126-129.
[48] Bhattarai, A., Bhattarai, B., Pandey, S. (2015). Variation of soil microbial population in different soil horizons. Journal of Microbiology & Experimentation, 2(2): 75-78. https://doi.org/10.15406/jmen.2015.02.00044
[49] Carney, K.M., Matson, P.A. (2005). Plant communities, soil microorganisms, and soil carbon cycling: does altering the world belowground matter to ecosystem functioning? Ecosystems, 8(8): 928-940. https://doi.org/10.1007/s10021-005-0047-0
[50] Bechtold, J.S., Naiman, R.J. (2006). Soil texture and nitrogen mineralization potential across a riparian top sequence in a semi-arid savanna. Soil Biology & Biochemistry, 38: 1325-1333. https://doi.org/10.1016/j.soilbio.2005.09.028
[51] Raiesi, F. (2006). Carbon and N mineralization as affected by soil cultivation and crop residue in a calcareous wetland ecosystem in Central Iran. Agriculture, Ecosystem & Environment, 112(1): 13-20. https://doi.org/10.1016/j.agee.2005.07.002
[52] Hamarashid, N.H., Othman, M.A., Hussain, M.A.H. (2010). Effects of soil texture on chemical compositions, microbial populations, and carbon mineralization in soil. The Egyptian Journal of Experimental Biology, 6(1): 59-64.
[53] Zi, H., Hu, L., Wang, C. (2022). Differentiate responses of soil microbial community and enzyme activities to nitrogen and phosphorus addition rates in an alpine meadow. Frontiers in Plant Science, 13: 1-15. https://doi.org/10.3389/fpls.2022.829381
[54] Lauber, C.L., Hamady, M., Knight, R., Fierer, N. (2009). Pyrosequencing-based assessment of soil pH as a predictor of soil bacterial community structure at the continental scale. Applied and Environmental Microbiology, 75(15): 5111-5120. https://doi.org/10.1128/AEM.00335-09
[55] Akond, M.A., Jahan, M.N., Sultana, N., Rahman, F. (2016) Effect of temperature, pH, and NaCl on the isolates of Actinomycetes from straw and compost samples from Savar, Dhaka, Bangladesh. American Journal of Microbiology and Immunology, 1(2): 10-15.
[56] Wu, Y., Zeng, J., Zhu, Q., Zhang, Z., Lin, X. (2017). pH is the primary determinant of the bacterial community structure in agricultural soils impacted by polycyclic aromatic hydrocarbon pollution. Scientific Reports, 7: 1-7. https://doi.org/10.1038/srep40093
[57] Msimbira, L.A., Smith, D.L. (2020). The roles of plant growth promoting microbes in enhancing plant tolerance to acidity and alkalinity stresses. Frontiers in Sustainable Food System, 4: 106. https://doi.org/10.3389/fsufs.2020.00106
[58] Rath, K.M., Noah, F., Daniel, V.M., Johannes, R. (2018). Linking bacterial community composition to soil salinity along environmental gradients. The ISME Journal, 13: 836-846. https://doi.org/10.1038/s41396-018-0313-8
[59] Hollister, E.B., Engledow, A.S., Hammett, A.J.M., Provin, T.L., Wilkinson, H.H., Gentry, T.J. (2010). Shifts in microbial community structure along an ecological gradient of hypersaline soils and sediments. The ISME Journal, 4(6): 829-838. https://doi.org/10.1038/ismej.2010.3
[60] Van Horn, D.J., Okie, J.G., Buelow, H.N., Gooseff, M.N., Barrett, J.E., Takacs-Vesbach, C.D. (2014) Soil microbial responses to increased moisture and organic resources along a salinity gradient in a polar desert. Applied and Environmental Microbiology, 80(10): 3034-3043. https://doi.org/10.1128/AEM.03414-13
[61] Yuan, B.C., Xu, X.G., Li, Z.Z., Gao, T.P., Gao, M., Fan, X.W., Deng, H.M. (2007). Microbial biomass and activity in alkalized magnetic soils under arid conditions. Soil Biology and Biochemistry, 39(12): 3004-3013. https://doi.org/10.1016/j.soilbio.2007.05.034
[62] Wang, C., Liu, D., Bai, E. (2018). Decreasing soil microbial diversity is associated with decreasing microbial biomass under nitrogen addition. Soil Biology and Biochemistry, 120: 126-133. https://doi.org/10.1016/j.soilbio.2018.02.003
[63] Ramirez, K.S., Craine, J.M., Fierer, N. (2012). Consistent effects of nitrogen amendments on soil microbial communities and processes across biomes. Global Change Biology, 18(6): 1918-1927. https://doi.org/10.1111/j.1365-2486.2012.02639.x
[64] Yue, K., Yang, W., Peng, Y., Peng, C., Tan, B., Xu, Z., Zhang, L., Ni, X., Zhou, W., Wu, F. (2018). Individual and combined effects of multiple global change drivers on terrestrial phosphorus pools: A meta-analysis. Science of The Total Environment, 630: 181-188. https://doi.org/10.1016/j.scitotenv.2018.02.213
[65] Waghmare, P.R., Patil, S.M., Jadhav, S.L., Jeon, B.H., Govindwar, S.P. (2018). Utilization of agricultural waste biomass by cellulolytic isolate Enterobacter sp. SUK-Bio. Agriculture and Natural Resources, 52(5): 399-406. https://doi.org/10.1016/j.anres.2018.10.019
[66] Mishra, P.K., Maruthi Sankar, G.R., Mandal, U.K., Nalatwadmath, S.K., Patil, S.L., Manmohan, S. (2012). Amelioration of vertisols with sand for management of soil physical, chemical and hydraulic properties in south India. Indian Journal of Soil Conservation, 40(1): 13-21.
[67] Rojas, A., Holguin, G., Glick, B.R., Bashan, Y. (2001). Synergism between Phyllobacterium sp. (N2-fixer) and Bacillus licheniformis (P-solubilizer), both from semiarid mangrove rhizosphere. FEMS Microbial Ecology, 35(2): 181-187. https://doi.org/10.1111/j.1574-6941.2001.tb00802.x
[68] Hua, S.J., van Bruggenb, A.H.C., GruÈnwaldb, N.J. (1999). Dynamics of bacterial populations in relation to carbon availability in a residue-amended soil. Applied Soil Ecology, 13(1): 21-30. https://doi.org/10.1016/S0929-1393(99)00015-3
[69] Crowther, T.W., Van den Hoogen, J., Wan, J., Mayes, M.A., Keiser, A.D., Mo, L., Averill, C., Maynard, D.S. (2019). The global soil community and its influence on biogeochemistry. Science, 365(6455). https://doi.org/10.1126/science.aav0550
[70] Lu, J., Li, S., Liang, G., Wu, X., Zhang, Q., Gao, C., Li, J., Jin, D., Zheng, F., Zhang, M., Abdelrhman, A.A., Degré, A. (2021). The contribution of microorganisms to soil organic carbon accumulation under fertilization varies among aggregate size classes. Agronomy, 11(11): 2126. https://doi.org/10.3390/agronomy11112126
[71] Fitriana, Y.R. (2006). Diversity and abundance of macrozoobenthos in mangrove rehabilitation forest in Great Garden Forest Ngurah Rai Bali. Biodiversitas, 7(1): 67-72. https://doi.org/10.13057/biodiv/d070117
[72] Alongi, D.M. (2009). The Energetic of Mangrove Forests. Springer, Australian Institute of Marine Science Townsville, Queensland Australia. Australia. Springer Science + Business Media B.V.
[73] Leff, J.W., Nemergut, D.R., Grandy, A.S., O’Neil, S.P., Wickings, K., Townsend, A.R., Cleveland, C.C. (2011). The effects of soil bacterial community structure on decomposition in a tropical rain forest. Ecosystems, 15: 284-298. https://doi.org/10.1007/s10021-011-9510-2
[74] Yang, J., Zhang, J., Yu, H., Cheng, J., Miao, L. (2014). Community composition and cellulase activity of cellulolytic bacteria from forest soils planted with broad-leaved deciduous and evergreen trees. Applied Microbiology and Biotechnology, 98(3): 1449-1458. https://doi.org/10.1007/s00253-013-5130-4
[75] Kurth, J.K., Albrecht, M., Karsten, U., Glaser, K., Schloter, M., Schulz, S. (2021). Correlation of the abundance of bacteria catalyzing phosphorus and nitrogen turnover in biological soil crusts of temperate forests of Germany. Biology and Fertility of Soils, 57: 179-192. https://doi.org/10.1007/s00374-020-01515-3
[76] Baumann, K., Glaser, K., Mutz, J.E., Karsten, U., MacLennan, A., Hu, Y., Michalik, D., Kruse, J., Eckhardt, K.U., Schall, P., Leinweber, P. (2017). Biological soil crusts of temperate forests: Their role cycling. Soil Biology and Biochemistry, 109: 156-166. https://doi.org/10.1016/j.soilbio.2017.02.011