Mohammed Jabbar Mawat*![]() | Ahmed Naseh Ahmed Hamdan
| Ahmed Naseh Ahmed Hamdan![]()
© 2023 IIETA. This article is published by IIETA and is licensed under the CC BY 4.0 license (http://creativecommons.org/licenses/by/4.0/).
OPEN ACCESS
Shatt Al Arab River in Basrah province southern Iraq is a tidal stream and it represents the main feeder of water to Basrah province. The river is characterized by having many branches during its course from upstream to downstream. The main aim of this study is to model a 2D hydrodynamic model for Shatt Al-Arab River with seven branches inside Basrah city which are Jubyla, Muftya, Robat, Khandek, Ashar, Al-Khora, and Saraji in addition to Karmat Ali river by the Hydrologic Engineering Centre’s River Analysis System (HEC-RAS) software, where most of the previous studies relied on the consideration of the river as one-dimensional, i.e., neglecting the transverse or vertical directions. Accurate input data like Digital Elevation Models (DEMs) were provided and enhanced with the help of Geographic Information Systems (GIS) as well as a data for the year 2014 was used as boundary conditions to develop the hydrodynamic model. The discharge values at the Qurnah station were extracted from the results of a previous one-dimensional HEC-RAS mathematical model. To prove the efficiency of the model, mean absolute error (MAE), root mean squared error (RMSE), and Nash-Sutcliffe efficiency (NSE) were implemented to check the convergence between observed and simulated data through calibration and validation processes. The result of NSE was 0.836, and this indicates an acceptable convergence between the simulated and observed values. Also, the methods of RMSE and MAE support that convergence to zero. It is worth noting here that the NSE method was more sensitive to the change in the resulting values and therefore it can be recommended to use this method in hydrodynamic models. The hydrodynamic model can provide important information for models of sediment transport or water quality. Therefore, it is essential to have a good understanding of the hydrodynamic processes in a water system, before embarking on studies of sediment transport, or water quality.
2D St. Venant equations, hydraulic simulation, modeling of Shatt Al Arab River, HEC- RAS software
Surface water system is any water that accrues on the surface of the earth and certainly open to the atmosphere such as oceans, seas, rivers, lakes, reservoirs and estuaries. These types of surface water, although their characteristics differ, but they share the same uses. Surface water is extremely necessary as it makes up about 80% of the water used on a daily basis, and it also makes up most of the water used for aquatic life support, water supply, transportation, industry, and irrigation. Surface water, is an interactive system, that continually changes because human and natural forces. Modeling surface waters such as rivers is complex for several reasons, including the change of geometric shape during the flow and the change of hydrological properties with time and space. Previously, most studies relied on simplified methods such as a one-dimensional model in representing the Shatt al-Arab river in southern Iraq and neglecting these studies for the impact of the many branches of the River within the borders of Basra province. 1D unsteady flow was adopted to study hydrodynamic simulation of the Shatt Al-Arab River by using HEC-RAS was made [1]. Al-Mahmoud et al. [2], were used Mike 11 hydrodynamic (HD) model to simulate the hydrodynamic demeanor of 64 kilometers of Shatt Al Arab River, from the Qurnah confluence (upstream of the river) to Maqal port in Basrah province (downstream of the river). The Danish Hydrologic Institute (DHI) created Mike 11, for the river modeling system. It used the Saint Venant equations to produce an implicit finite difference computation of unsteady flow in rivers. The simulation process was executed at Basrah University's Marine Science Center. Abdullah [3] studied a systematic monitoring and modeling on water availability, quality and seawater intrusion into the Shatt al-Arab River. Hamdan [4] find hydrodynamic simulations of river water for whole length of 200 km by controller gates in the Shatt Al Arab River. Hamdan et al. [5] focused on tracking the sea water penetration into the river from the Arabian Gulf. One-dimensional HEC-RAS model has been used to understanding the dynamics of total dissolved solid in the river. The study for the purpose of studying the Hydrochemical of the River’s water was conducted by AL-Amiri and Disher [6]. Al-Asadi et al. [7] investigated dimensional variability of the temporal, spatial, and vertical salinity in the transitional zone between the water of Shatt Al-Arab River and the gulf (estuary region) that helps to display the saltwater propagation into the river during 2019-2020. Al Murib [8] used CE-QUAL-W2 to develop a two dimensional hydrodynamic and water quality model (width averaged) of the main stem Tigris River from Dam of Mosul to Kut Barrage (880 km). Alzahrani [9] focused on the implementation and making a comparison of two models (1D and 2D) by relying the results of the water level of the main channel as well as flood plain. Fan et al. [10] used HEC-RAS model combined with Qual2K model in their study to examine of a tidal river’s water quality. Because its popularity and ease to use. The empirical hydraulic characteristic constants used in their study were adapted from previous study, which are required to compute velocity and water depth using empirical equations. Hydraulic characteristics like slopes of riverbed, wetting perimeter, and roughness coefficients were gathered to establish the hydraulic factors for the Manning equation. To estimate the influence of tidal impact on water quality simulation, the HEC-RAS software was used. HEC-RAS assisted with Qual2K simulations, on average; agree with river monitoring data as the results showed. For comparison, a Streeter-Phelps method (in conjunction with HEC-RAS) was run, and the results show very good conformant with the observed data.
This paper looking to build an improved two-dimensional hydrodynamic model by evolving input data using and HEC-RAS tools and it includes an overview of the study area's topographic and hydrographic data using HEC-RAS and Geographic Information System (GIS) software. The study area covers the entire course of the river from the confluence of the Tigris and Euphrates Rivers in the Qurna district to its mouth in the Arabian Gulf. The river situation was unsteady and the influence of the tidal phenomenon was taken into consideration in the model-building, as well as the main river branches were taken into account which was overall the most important reason that made the simulation of the river complex A seven branches inside Basrah city which are Jubyla, Muftya, Robat, Khandek, Ashar, Khora and Saraji. So, most of studies did not cover the total interested area of the entire Shatt al-Arab river and used a one-dimensional model as well as neglecting the effect of main branches. To prove the efficiency of the model, mean absolute error (MAE), root mean squared error (RMSE), and Nash-Sutcliffe efficiency (NSE) were implemented to check the convergence between observed and simulated data through calibration and verification processes. It is worth noting here that the NSE method was more sensitive to the change in the resulting values and therefore it can be recommended to use this method in hydrodynamic models. The results showed that the Shatt Al Arab River is a complex stream has varying hydrological properties along its course with respect to tidal period. Therefore, it can be considered that this model is a basic step for studying sediment transport or pollutant concentrations in the Shatt Al-Arab River. Cross-section data, land cover classifications, flow data, and boundary conditions are all provided in this research. The topographic data sets were created in raster format by the Space Shuttle Radar Topography Mission (SRTM) Arc-Second Global is adopted in model building procedure.
The Tigris and Euphrates Rivers meet near Al- Qurna district in southern Iraq to form the Shatt al-Arab River (Figure 1). The Shatt al-Arab River is a 192-kilometer-length tidal river that flows south-eastwards, passing through Basrah and then, discharging into the Arabian Gulf [11]. The province's seven creeks (Jubyla, Muftya, Robat, Khandek, Ashar, Khora, and Saraji) are linked to the Shatt al-Arab River and they are affected by the tidal phenomenon. The river's width changes along its length, from 250 to 300 meters at the Euphrates-Tigris meeting and reach to 600 meters around the town of Basrah and 2000 meters at the estuary [12]. For the last 95 kilometers of its course, the river forms part of the border between Iraq and Iran [3]. In addition to transportation, Shatt al-Arab River has an important role in delivering water for domestic use, irrigation, and manufacturing [13]. The river serves as the region's primary supply of water it promotes agricultural and industrial operations, as well as navigation and ecological biodiversity. The water is diverted for irrigation purposes, mostly in the upper stream for grain production and in the lower course for palm forest. Several water treatment plants along the river divert water for household use. Several tributaries of the Shatt al-Arab River, including the Al-Sweeb, Ezz, Garmat Ali, Karkheh, and Karun Rivers, discharged into it over its course. These rivers connect Shatt al-Arab River to the marshes. This work aims to complete the hydrodynamic description which necessary within the field of Water Resources Management. Currently, these contributions have been decreased as a result of surrounding governments' strategies, which resulted in a very significant increase in TDS values in the Shatt al-Arab River due to the effect of the Arabian Gulf [5].
Figure 1. Shatt al-Arab River and its branches
The area of study can be considered as shallow water surface because of the ratio of width to depth is more than 10 [14]. Therefore, depth-averaged 2D hydrodynamic model is adopted to simulate hydrological parameter variation in plane view (longitudinal and transverse direction). The default solver is the 2D Diffusion Wave computational approach, which allows computations to execute faster and with more stability. While the 2D full Momentum (Saint Venant) flow equations, which adopted in this study, applicable to a wider set of conditions than 2D Diffusion Wave approach because can account for turbulence and Coriolis effects, but require more processing resources, resulting in longer run times. It is worth mentioning here, the Implicit Finite Volume solution system is used by both the 2D Diffusion Wave and 2D Saint Venant solvers. With allow variable time step option offered by HEC-RAS, the computational process adjusts the necessary time step during the solution depending on the selected Courant number. However, the 2D Saint Venant equations are [15, 16]:
$\frac{\partial \mathrm{h}}{\partial \mathrm{t}}+\frac{\partial(\mathrm{Hu})}{\partial \mathrm{x}}+\frac{\partial(\mathrm{Hv})}{\partial \mathrm{y}} \mathrm{q}$ (1)
$\begin{gathered}\frac{\partial u}{\partial t}+u \frac{\partial u}{\partial x}+v \frac{\partial u}{\partial y}-f_c v=-g \frac{\partial h}{\partial x}+\frac{1}{H} \frac{\partial}{\partial x}\left(v_{t, x x} H \frac{\partial u}{\partial x}\right)+ \frac{1}{H} \frac{\partial}{\partial y}\left(v_{t, y y} H \frac{\partial u}{\partial y}\right)-\frac{\tau_{b, x}}{\rho R}-\frac{\tau_{s, x}}{\rho H}\end{gathered}$ (2)
$\begin{gathered}\frac{\partial v}{\partial t}+u \frac{\partial v}{\partial x}+v \frac{\partial v}{\partial y}+f_c u=-g \frac{\partial h}{\partial x}+\frac{1}{H} \frac{\partial}{\partial y}\left(v_{t, x x} H \frac{\partial v}{\partial x}\right)+ \frac{1}{H} \frac{\partial}{\partial y}\left(v_{t, y y} H \frac{\partial v}{\partial y}\right)-\frac{\tau_{b, y}}{\rho R}-\frac{\tau_{s, y}}{\rho H}\end{gathered}$ (3)
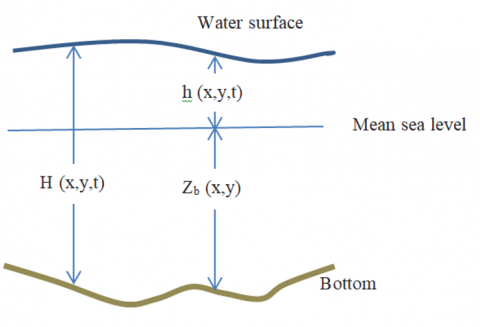
where, t is the time and H (depth of water) = h+zb, h and zb are defined in Figure 2, u and v: velocity components in the x and y direction respectively, q: source/sink flux term, sinks are negative, and sources are positive, g: acceleration of gravity, h: elevation of water surface, νt,xx and νt,yy: horizontal eddy viscosity coeffi.in the x and y directions, τb,x and τb,y: bottom shear stresses on the x and y directions, τs,x and τs,y: the surface wind stress directions, R: hydraulic radius, and fc: Coriolis parameter.
Figure 2. Schematic geometry of water and bed elevation
4.1 Digital elevation model
Topography data in the form of Digital Elevation Models (DEMs) is used to create a hydrodynamic model as well as to map the area of flood inundation. Digital Elevation Models (DEMs) are topographical elevation models that are free of vegetation and man-made features. It shows the height of the earth's surface as a digital image, with each pixel containing an elevation value for the pixel's center point. DEMs are a major input to any modeling or process quantification that involves the earth's topography and are employed in a variety of development fields, including water resource management (WRM). WRM and all of its subcategories rely on precise elevation or topographical information, which is often given as elevation map layers [17, 18]. The topographic datasets used in this investigation are freely available on the Earth Explorer website. The topographic data sets were created in raster format by the Space Shuttle Radar Topography Mission (SRTM) Arc-Second Global, which is widely used as the best free worldwide digital elevation data [19].
4.1.1 Digital elevation model modification
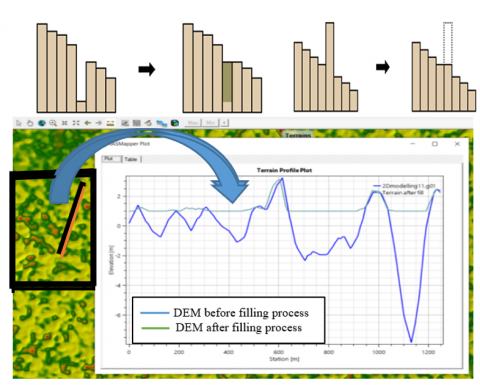
A depressionless DEM is the desired input to the flow direction procedure. The existence of sinks can lead to an incorrect flow-direction raster. There may be legit holes in the data in some circumstances. The capabilities in the ArcGIS Spatial Analyst extension's Hydrology toolset can help to create a depressionless elevation surface as appear in the upper part of Figure 3, where, Sinks/peaks should be treated to ensure correct basin and stream delineation. This treatment for the DEM is clearly recognized in the lower part of the Figure 3. This part explains the direct comparison between original free DEM and treated DEM since many of holes is filled with the minimum elevation along its watershed boundary. Depending on how the surfaces were processed, DEM data sources may include a high or low number of sinks [20]. The Fill tool iterates over all sinks within the chosen z limit. Figure 3 shows a number of holes which filled during this process.
Figure 3. Terrain profile before and after filling process
4.1.2 Including channels bathymetry into terrain
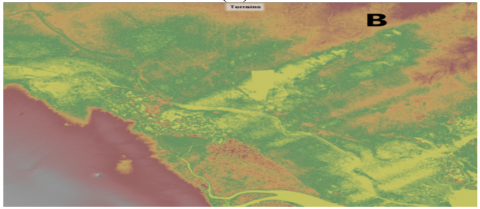
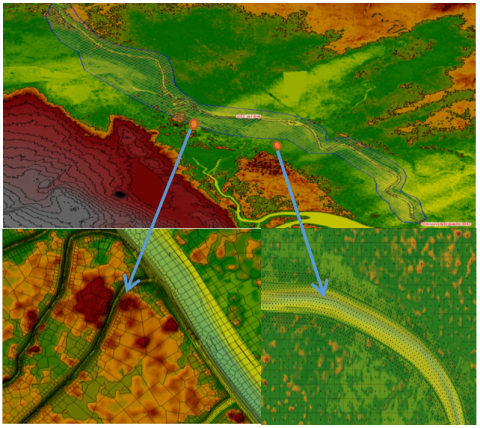
It is necessary to have a detailed and accurate terrain model to create a detailed and accurate hydraulic model. The problem is that the area under study includes many rivers that have no bathymetry data characterized in the digital terrain model. This is a generic issue as most sources of terrain data are collected today by different techniques that can’t penetrate water [9]. By having cross-section data along the channel, the channel terrain model is created by HEC-RAS 6.1 capabilities by right clicking on the geometry layer and selecting export layer, then creating Terrain GeoTiff From cross sections (XS’s) by choosing (channel only) from the popup menu. Then it combines with the original terrain in the RAS Mapper window to create a new comprehensive terrain. Fortunately, this can be accomplished within HEC-RAS. This strategy has been pursued in determining the geometric shape of Shatt al-Arab River and its branches, as shown in Figures 4 and 5.
(A) Created Terrain of Channel Data
(B) Original Terrain
(C) Final generated Terrain
Figure 4. DEM developed stages
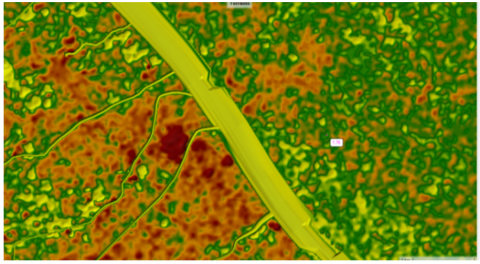
(A) Final terrain layer in RAS Mapper window
(B) Comparison between original DEM and final DEM
Figure 5. Properetes of final generated DEM
4.2 Cross sections (XS)
One of the basic inputs required to build a hydraulic model is a series of cross sections (XS) that extend across the channel. These have traditionally been generated by field surveying several XS in the stream reach to be modeled. Data for river XS are derived from the Ministry of Water Resources (MoWR).
For the Shatt al Arab River the 181 cross sections recently surveyed in 2014 were included in the databank of MoWR. A digital terrain model in the form of a Triangular irregular Network (TIN) in ArcGIS with HEC-Geo RAS toolbox is another option for creating the needed cross sections [21-23]. HEC-Geo RAS extension has been used under 3D Analyst tool and Spatial Analyst tool in ArcMap Software. The River Geometry is extracted step by step in the study [21]. Terrain models can portray the bare earth surface of the branches, but this method does not allow looking into the channel bed (i.e., under water surface). To correct this, additional surveyed information is required to represent the channel below water surface. This done by using GUT775 ultrasonic water depth meter detector, Leveling device, ruler and tape measure, see Figure 6.
Figure 6. Site measuring instruments
The surveyed Readings can be categorized into two types, wet and dry reading. A wet reading when it is measuring river bed level and a dry reading when it is measure on the river bank level. The elevations are referred to Water Surface Level (WSL) during survey to catch with references of elevations in DEM. This strategy has been pursued in formative the geometric shape of the Shatt al-Arab River’s branches. See Figure 7.
Figure 7. Cross Section of Shatt Al Arab River’s branches (Jubyla, Muftya, Robat, Khandek, Ashar, Al-Khora, and Saraji)
4.3 Generation of land-cover data from satellite images
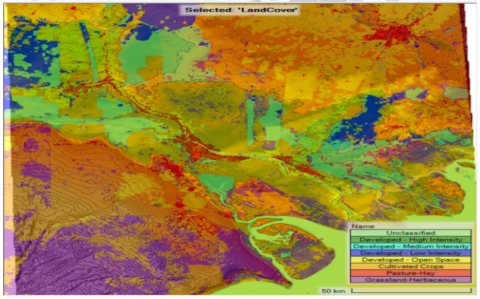
Coefficient of Roughness (Manning's n value) for 2D flow areas is generally related to landcover classes in HEC-RAS 2D modeling. Manning's n values for 2D modeling are influenced by a variety of characteristics, including but not limited to overland surface type and texture, pervious or impervious sections, 2D flow depth, channel irregularities, channel size and shape, and so on [9]. There has been a lot of research done on n values in the 1D channel, but not so much on it in 2D domains. RAS Mapper can generate a land cover layer and associate it with topography data for 2D models. Modelers can additionally provide manning's roughness values with various land use categories, which are defined in the land cover layer, as shown in Figure 8. Table 1 shows the variety of Manning's n values utilized for each land cover definition and value in the National Land Cover Database (NLCD) [24].
Figure 8. Region classification of land cover layer
Table 1. Roughness coefficient for land covers classification of NLCD
|
NLCD Value |
Land Cover Definition |
Range on n value |
|
11 |
Open Water |
0.025-0.05 |
|
21 |
Developed, Open Space |
0.03-0.05 |
|
22 |
Developed, low Intensity |
0.08-0.12 |
|
23 |
Developed, Medium Intensity |
0.06-0.14 |
|
24 |
Developed, High Intensity |
0.12-0.2 |
|
31 |
Barren Land (Rock/Sand/Clay) |
0.023-0.03 |
|
41 |
Deciduous Forest |
0.1-0.16 |
|
42 |
Evergreen Forest |
0.1-0.16 |
|
43 |
Mixed Forest |
0.1-0.16 |
|
52 |
Shrub/Scrub |
0.07-0.16 |
|
71 |
Grassland/Herbaceous |
0.07-0.16 |
|
81 |
Pasture/Hay |
0.025-0.05 |
|
82 |
Cultivated Crops |
0.025-0.05 |
|
90 |
Woody Wetlands |
0.045-0.15 |
|
95 |
Emergent Herbaceous Wetlands |
0.05-0.085 |
4.4 2D flow area and meshing
Spatial commands describing 2D area polygon can be generated inside HEC-RAS environment. In Figure 9, the study area covering both the river and its banks from Qurna city to Al-Faw city has been identified. The computational mesh was also generated with a uniform size for all the study areas at first, and then the process of mesh refinement for the region representing the channel was performed to make a better representation of results by using the break lines feature. Concerning the narrow branches of the river inside the city of Basrah, the size of the cell was refined by using the refinement polygon to reach 34763 cells in the whole study area.
4.5 Flow data and boundary conditions
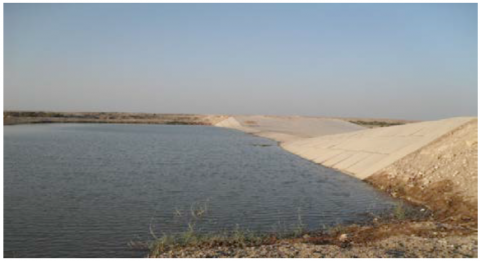
Previously, Euphrates, Tigris, and Karun Rivers were the principal water donors to Shatt al-Arab River. The Euphrates' water quality deteriorated as a result of upstream water resource scarcity. Furthermore, the water resources Policies in Iraq exacerbated the problem after 2009, when the Euphrates River inflow into Shatt Al-Arab River was separated by establishing an embankment on its stream, approximately 35 km distance west of Al-Qurnah location [25]. As a result of construct this embankment (Figure 10), the water from the Euphrates may no longer meet with Tigris in Qurna, this means that the flow Shatt Al Arab River is no longer impacted by the Euphrates flow.
Figure 9. 2D flow area perimeter and mesh details in different regions
Figure 10. Embankment across Euphrates River upstream of Al Madina [26]
Figure 11. Hourly discharge values during Simulation period at Qurnah station (River’s upstream)
Garmat Ali river also prevents flow to Shatt Al Arab River owing to establishing an embankment on it, as well as Karun river's flow contribution is small or almost approach to zero, therefore, Tigris now represent the main water supply to Shatt Al-Arab River. A boundary condition (BC) is used to input data of discharge at upstream BC and data of water stages at downstream BC. Unfortunately, there are no data available for discharge at Al Qurnah station, upstream of the Shatt al-Arab river. Therefore, a previous one-dimensional HEC-RAS mathematical model, done by Najm [27], starting from Qalat Saleh regulator where sufficient data is available. The discharge values at the Qurnah station were extracted from the results of this model as shown in the Figure 11. A recorded hourly water stages for year 2014 for the period extended from 1 Feb. up to 30 Jun., (see Table 2), were chosen as input downstream BC, as shown in Figure 12.
Figure 12. Water stages during simulation period at river’s downstream
Table 2. Station’s location of data collected during simulation time
|
Station |
Location Coordinate |
Data type |
Purpose |
|
|
E |
N |
|||
|
Al-Qurna |
47° 26.581' |
31° 00.267' |
Flow hydrograph |
Upstream BC |
|
Al-Maqal |
47° 46.768' |
30° 34.154' |
Stage hydrograph |
Verification |
|
Abu Flus |
48° 01.215' |
30° 27.542' |
Stage hydrograph |
Calibration |
|
Sehan |
48° 11.623' |
30° 19.587' |
Stage hydrograph |
Verification |
|
Al-Fao |
48° 30.256' |
29° 57.879' |
Stage hydrograph |
Downstream BC |
Model calibration is the process of adjusting values of model parameter to be within tolerable ranges so that the differences between simulated and observed value were reduced and within some tolerable limits of precision. Verification process is the following test analysis of a calibrated model against another independent data set to extra verify the model's capacity to represent the waterbody correctly [28].
Statistical indicators of (MAE), (RMSE), and (NSE) are expressed by the following equations [26]:
$MAE=\frac{1}{N} \sum_{i=1}^N\left|S_i-O_i\right|$ (4)
$R M S E=\sqrt{\frac{\sum_i^N\left(S_i-O_i\right)^2}{N}}$ (5)
$N S E=\frac{\sum_i^N\left(S_i-O_i\right)^2}{\sum_i^N\left(S_i-O_o\right)^2}$ (6)
where, N = number of observed- simulated pairs, Oi =observed data, Si= simulated data, and Oo = mean of the observed data. The data from the stage hydrograph at Abu Flus station in 2014 have been used to calibrate Manning's roughness coefficient; the simulated stage hydrographs were compared to the observed stage hydrograph at this station to arrive at an optimal value for the abovementioned model. In the calibration of the HEC-RAS model, three distinct values of 'n' were considered: n = 0.02, n = 0.025 and n = 0.035; then chose an appropriate 'n' value that give allowable criteria ranges between simulated and observed water stages. A performance-checking strategy using various statistical analyses can be used to attain the acceptable criterion range. Six statistical indicators are known to be used to assess the performance of calibrated and verified numerical models. They are the Nash-Sutcliffe efficiency (NSE), the root mean squared error (RMSE), the normalized (RMSE), the correlation coefficient, the mean absolute error (MAE), and the standard error of estimation (SEE) [26, 29].
The methods (RMSE, MAE, and NSE) were adopted to analyze the performance of the model in the current study. Data recorded of hourly stage at Abu Flus station is used in calibration process. The results of calibration are shown in Table 3. As it appears from the table, there is an acceptable convergence between the calculated and measured values. Where it is known that if the results of the NSE are close to one, it will be more acceptable, in contrast, the RMSE and MAE are accepted where they close to zero, so the best value of n when it equals 0.025. Figure 13 represents an example on the graphical comparison between observed stage and simulated stage which calculated at different n’value at Abu Flus station.
Al-Maqal and Sehan gauge stations are other recorded stage hydrograph data available through the simulation date (1 Feb. to 31 Jun.-2014) that were used for the verification process and the same statistical analysis methods have been used to prove the performance of the hydrodynamic model.
The results of the verification process were encouraging because of the criteria of the statistical methods match the results and as shown in Table 4. The results of HEC‑RAS, the water surface elevation, energy grade line elevation, critical depth elevation, and so on, can be shown by generate profile line. A profile line was made along the Shatt al-Arab River’s center and its results for Water Surface Elevation (WSE), velocity, and depth were recorded and discussed in the following sections.
Table 3. Model performances statistic during calibration
|
‘n’ value |
statistical analysis method |
||
|
RMSE |
MAE |
NSE |
|
|
0.02 |
0.182 |
0.144 |
0.806 |
|
0.025 |
0.176 |
0.140 |
0.836 |
|
0.035 |
0.178 |
0.145 |
0.812 |
Table 4. Model performances statistic during verification
|
Gauge Station |
statistical analysis method |
||
|
RMSE |
MAE |
NSE |
|
|
Al-Maqal |
0.223 |
0.185 |
0.928 |
|
Sehan |
0.248 |
0.212 |
0.841 |
Figure 13. Graphical comparison of stages at different n’value with observed stage at Abu Flus station
6.1 WSE results
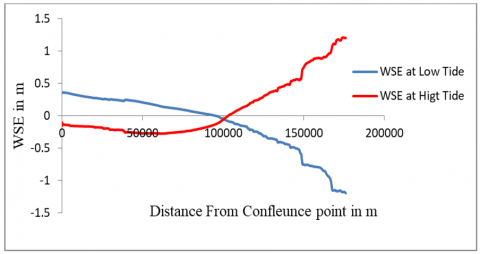
The profile of WSE of Shatt Al Arab River during high and low tide time at Fao station is illustrated in Figure 14. As shown in this figure, the effect of tidal phenomena is significant along the river. Thus, the tidal range, the difference between high and low tide, has approximately 3 meter in Fao city and then reduce gradually toward the upstream to reach 0.5 meter at Qurnah city during one tidal period. At low tide the water surface gradient was toward the Gulf along the River, while at high tide the gradient was divided into two parts. The first one was from Fao city toward the upstream until reach the inflection point, after this point the gradient is revised to become from Qurnah city to downstream which is the second part. The reason of this behavior is that the two masses of water, the one comes from upstream and the another comes from Arabian gulf, were in same direction in low tide period and in opposite direction in high tide period. The inflection point is located at station 100 000 m which is Um Alrasas Island for this day.
Figure 14. WSE during high and low tide of 21 Feb. 2014
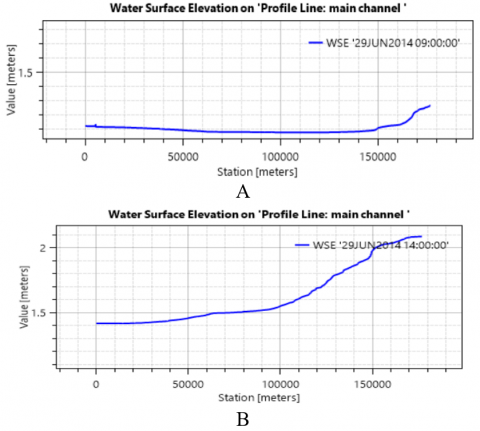
Figure 15 represents instantaneous of WSE during entire tidal period (approximatly13 hours), the time of result is fixed at the top right angle at each window. It can be seen that the effect of flood/ebb on the elevation of water along the river is starting from downstream end then penetrate toward upstream end. The rising level is about 1.1 m at stations (0-140000) m and 1.3 m at st. 180000 in hour 09:00, Figure 15-A, then it increases next hours to reach 1.55 m at station 0, 1.8 m at station 140000, and 2.1at st. 0 in hour 14:00, Figure 15-B. This increase occurred during 6 hours that represent the daily flood period. Similarly, the falling level is recognized through next 6 hours (ebb period), Figure 15-C, D, to reach 1.2 m at station 0, 1.0 m at st. 140000, and -0.2 m at st. 180000. The fluctuation values of water level due to the effect of tidal phenomena will be maximum range at River mouth (2.1-(-0.2)) m, (1.8-1.0) at st. 140000, and (1.55-1.2) at st. 0.
Figure 15. WSE profile along Shatt Al Arab River during entire tidal period
6.2 Velocity results
Figure 16 represents instantaneous of velocity value during entire tidal period, the time of result is fixed at the top right angle at each window. Velocity value at the beginning of flood is about 0.02 m/s along distance 140000 m from upstream at hour 09:00 and it increases to reach 0.08 m/s along last 40000 m of river length, Figure 16-A. Then the value of velocity increased during following hours to become 0.04 m/s at st. 50000 m, 1.02 m/s at st. 150000 m, Figure 16-B. Similarly, the variation is recognized through next 6 hours (ebb period), Figure 16-C and 16-D. it is can be clearly noted that the velocity value in ebb period will be more than that recorded during flood period because of the direction of fresh water come from upstream is same the direction of ebb flow, while during flood ebb the direction of fresh water versus the flood direction.
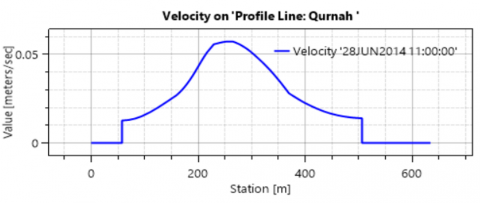
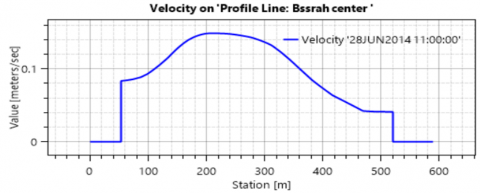
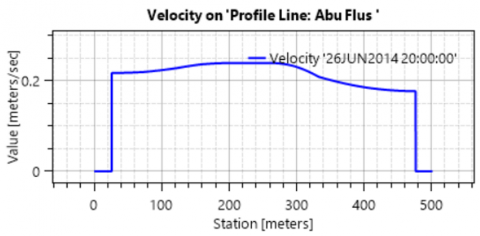
One of the 2D hydrodynamic model’s advantages is that the velocity variation across the river is substantial as shown in Figure 17. The figure illustrates velocity profile at four main stations (Qurnah, Basrah center, Abu Flus, and Sehan) along the Shatt Al Arab River. It is recognized from the figure that the velocity (tangent velocity) has significant values at solid boundary condition (both sides of the river) because the HEC-RAS dials with this boundary as slip condition.
Figure 16. Velocity profile along Shatt Al Arab River during entire tidal period
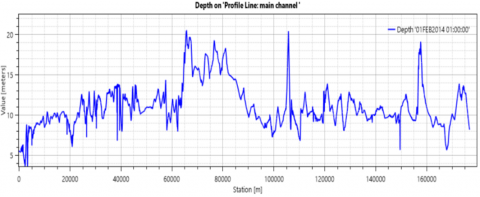
6.3 Depth results
The Shatt al-Arab River is characterized by a change in depth along its course. First, the depth was recorded at upstream in the Qurna station with value ranging from 4.5 meters to 5.5 meters. After that, it gradually increases within a distance of 40,000 meters from the upstream, reaching value within a range from 10 to 13 meters depth. The greatest depth’s value was observed in Al Maqal city, where it reached between 15 and 20 meters. While during the remaining length of the river, the depth ranged from 8 to 12 meters, ending with a recorded depth of 9 meters at Al Fao city (10 km away from the Arabian Gulf), Figure 18.
Figure 17. A: Velocity profile a cross Shatt al Arab River at Qurnah station
Figure 17. B: Velocity profile a cross Shatt al Arab River at Basrah center station
Figure 17. C: Velocity profile a cross Shatt al Arab River at Abu Flus station
Figure 17. D: Velocity profile a cross Shatt al Arab River at Sehan station
Figure 18. Depth profile along Shatt al Arab River
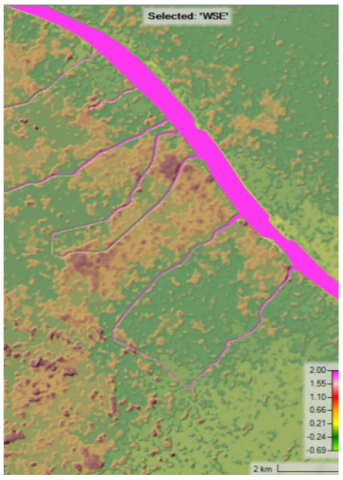
In addition, it is possible to display the results obtained from the model analysis in a spatial distribution shape in order to get a comprehensive view of the study area for a specific parameter such as Figure 19. The figure shows spatial distribution of velocity and WSE. The focus in this figure was on showing a clear image of the river with its branches inside the Basrah center. As appear from the Figure 19-A, the variation of WSE is not significant and has same color. From Figure 19-B, the velocity will be higher value (yellow color) at narrow section than wide section (blue color).
Figure 19-A. Spatial WSE distribution at Basrah center
Figure 19-B. Spatial velocity distribution at Basrah center
The study area covered the entire course of the river from the confluence of the Tigris and Euphrates Rivers in the Qurna district to its mouth in the Arabian Gulf. The river situation was unsteady and the influence of the tidal phenomenon was taken into consideration in the model-building, as well as the main river branches were taken into account which was overall the most important reason that made the simulation of the river complex A seven branches inside Basrah city which are Jubyla, Muftya, Robat, Khandek, Ashar, Khora and Saraji. So, most of studies did not cover the total interested area of the entire Shatt al-Arab river and used a one-dimensional model as well as neglecting the effect of main branches. The topographic data sets were created in raster format by the Space Shuttle Radar Topography Mission (SRTM) Arc-Second Global is adopted in model building procedure. The treatment for the DEM is made to minimize flow error caused by unexpected holes by using GIS tools. As mentioned earlier, the data collected in 2014 were used in the construction of the model. These data are represented by the values of discharges and the level of the water surface. The discharge was used as upstream boundary conditions and the stage hydrograph as downstream boundary conditions in Al-FAO city, while the measurements recorded at the Abu Flus station were used in the calibration process. The verification process was also carried out by relying on the data of the stations in Sehan and Al-Maqal. The results of both calibration and verification showed a clear convergence between the calculated and recorded data based on the previously mentioned statistical methods. The NSE method was more sensitive to the change in the resulting values and therefore it can be recommended to use this method in hydrodynamic models. The Manning’s values (n) of the Shatt Al-Arab River were 0.025. the results showed that the Shatt Al Arab River is a complex stream has varying hydrological properties along its course with respect to tidal period. Moreover, the effect of main branched on River characteristics should be considered.
[1] Abbas, A.H.A.K. (2017). Application of a hydrodynamic HEC-RAS model for Shatt Al-Arab River. Muthanna Journal of Engineering and Technology (MJET), 2: 11-22. https://doi.org/10.18081/mjet/2016-4/11-22
[2] Al-Mahmood, H.K.H., Al-Sayaab, H.A., Al-Miahi, D.S., Mahmoud, A.B., Mutasher, W.R. (2011). One dimensional model to study hydrodynamics properties for north part of Shatt Al Arab River (south Iraq). Basrah Journal of Science, 28(1): 1-14.
[3] Abdullah, A.D. (2016). Modelling approaches to understand salinity variations in a highly dynamic tidal river. In The Academic Board of the UNESCO-IHE Institute for Water Education. Delft University of Technology: Netherlands. http://dx.doi.org/10.1201/9781315115948
[4] Hamdan, A.N.A. (2016). Controlling the surface water of Shatt Al Arab River by using sluice gates. Journal of University of Babylon, 24(1): 85-94.
[5] Hamdan, A.N.A., Al-Mahdi, A.A.J., Mahmood, A.B. (2020). Modeling the effect of sea water intrusion into Shatt Al-Arab River (Iraq). Journal of University of Babylon for Engineering Sciences, 28: 210-224.
[6] AL-Amiri, N.J., Disher, M.A. (2021). Hydrochemical study of Shatt al-Arab water in Basra City. Agrica, 10(1): 17-23. http://dx.doi.org/10.5958/2394-448X.2021.00012.2
[7] Al-Asadi, S.A., Alhello, A.A., Ghalib, H.B., Muttashar, W.R., Al-Eydawi, H.T. (2022). Seawater intrusion into Shatt Al-Arab River, Northwest Arabian/Persian Gulf. Journal of Applied Water Engineering and Research, 1-14. https://doi.org/10.1080/23249676.2022.2113460
[8] Al Murib, M. (2018). Hydrodynamic and water quality modeling of the Tigris River system in Iraq using CE-QUAL-W2. Doctoral dissertation, Portland State University.
[9] Alzahrani, A.S. (2017). Application of two-dimensional hydraulic modeling in riverine systems using HEC-RAS. Doctoral dissertation, University of Dayton.
[10] Fan, C., Ko, C.H., Wang, W.S. (2009). An innovative modeling approach using Qual2K and HEC-RAS integration to assess the impact of tidal effect on River Water quality simulation. Journal of Environmental Management, 90(5): 1824-1832. https://doi.org/10.1016/j.jenvman.2008.11.011
[11] Hamdan, A.N.A., Dawood, A.S. (2016). Neural network modelling of TDS concentrations in Shatt Al-Arab River water. Engineering and Technology Journal, 34(2 Part A): 334-345. https://doi.org/10.30684/etj.34.2A.12
[12] Hamdan, A.N. (2016). Simulation of salinity intrusion from Arabian gulf to Shatt Al-Arab River. Basrah Journal for Engineering Science, 16(1): 28-32.
[13] Hamdan, A., Dawood, A., Naeem, D. (2018). Assessment study of water quality index (WQI) for Shatt Al-Arab River and its branches, Iraq. In MATEC Web of Conferences, 162: 05005. https://doi.org/10.1051/matecconf/201816205005
[14] Khudair, S.N.A. (2001). A finite element model to simulate the hydrodynamics of Shatt Al- Basrah canal and Khour Al-Zubair estuary. Journal of Engineering / Eng. College/ Univ.of Baghdad, 7(2): 283-308.
[15] Brunner, G. (2020). HEC-RAS, river analysis system hydraulic reference manual, Version 6.0. Report Number CPD-69, Hydrologic Engineering Center. US Army Corps of Engineers, Davis, California.
[16] Behzadi, F., Wasti, A., Steissberg, T.E., Ray, P.A. (2022). Vulnerability assessment of drinking water supply under climate uncertainty using a river contamination risk (RANK) model. Environmental Modelling & Software, 150: 105294. https://doi.org/10.1016/j.envsoft.2021.105294
[17] Louise Croneborg, K.S., Matera, M., McKeown, D., van Aardt, J. (2015). Digital elevation models. International Bank for Reconstruction and Development: Washington, DC.
[18] Merwade, V., Cook, A., Coonrod, J. (2008). GIS techniques for creating river terrain models for hydrodynamic modeling and flood inundation mapping. Environmental Modelling & Software, 23(10-11): 1300-1311. https://doi.org/10.1016/j.envsoft.2008.03.005
[19] Kadhim, A.A. (2018). Measuring and modeling the effects of sea level rise on near-coastal riverine regions: A geospatial comparison of the Shatt Al-Arab River in Southern Iraq with the Mississippi River Delta in Southern Louisiana, USA. Doctoral dissertation, Michigan State University.
[20] Tarboton, D.G., Bras, R.L., Rodriguez-Iturbe, I. (1991). On the extraction of channel networks from digital elevation data. Hydrological Processes, 5(1): 81-100. https://doi.org/10.1002/hyp.3360050107
[21] Pandya, K.H., Vadodaria, G.P., Prakash, I. (2018). Use of ArcGIS to extract river geometry as an input to HEC-RAS for flood modelling. International Journal of Innovative Research in Technology, 4(12): 696-699.
[22] Pathan, A.I., Vadher, P.B.M., Agnihotri, D.P.G. (2017). River flood modeling using GIS, HEC-GeoRAS and HECRAS for Purna River, Navsari District, Gujarat, India. International Journal of Scientific Development and Research, 2(3): 216-222.
[23] Gichamo, T.Z., Popescu, I., Jonoski, A., Solomatine, D. (2012). River cross-section extraction from the ASTER global DEM for flood modeling. Environmental Modelling & Software, 31: 37-46. https://doi.org/10.1016/j.envsoft.2011.12.003
[24] Nyaupane, N., Bhandari, S., Rahaman, M.M., Wagner, K., Kalra, A., Ahmad, S., Gupta, R. (2018). Flood frequency analysis using generalized extreme value distribution and floodplain mapping for Hurricane Harvey in Buffalo Bayou. In World Environmental and Water Resources Congress 2018: Watershed Management, Irrigation and Drainage, and Water Resources Planning and Management (pp. 364-375). Reston, VA: American Society of Civil Engineers. https://doi.org/10.1061/9780784481400.034
[25] Lafta, A.A. (2022). Investigation of tidal asymmetry in the Shatt Al-Arab river estuary, Northwest of Arabian Gulf. Oceanologia, 64(2): 376-386. https://doi.org/10.1016/j.oceano.2022.01.005
[26] Vedmani, R.K.P., Pandey, V.K. (2020). Calibration and validation of HEC-RAS model for minor command in coastal region. International Journal of Current Microbiology and Applied Sciences, 9(2): 664-678. https://doi.org/10.20546/ijcmas.2020.902.082
[27] Najm, A.T. (2017). Applications of two-dimensional surface flow modelling for Shatt Al-Arab River in civil engineering/ water resources. University of Basrah.
[28] Marvin, J.T., Wilson, A.T. (2016). One dimensional, two dimensional and three dimensional hydrodynamic modeling of a dyked coastal river in the bay of fundy. Journal of Water Management Modeling. http://dx.doi.org/10.14796/JWMM.C404
[29] Krause, P., Boyle, D.P., Bäse, F. (2005). Comparison of different efficiency criteria for hydrological model assessment. Advances in Geosciences, 5: 89-97. http://dx.doi.org/10.5194/adgeo-5-89-2005