Alyaa Shakir Oleiwi*![]() | Basim Sh. Abed
| Basim Sh. Abed![]() | Ban Flaieh Hasan
| Ban Flaieh Hasan![]()
© 2023 IIETA. This article is published by IIETA and is licensed under the CC BY 4.0 license (http://creativecommons.org/licenses/by/4.0/).
OPEN ACCESS
The study aims to examine the impacts of future climate change on the rainfall quantiles for the main sites of the Tigris River basin, including Mosul, Tikrit, Sammara, and Baghdad. There are two approaches, first: the global climate models (GCMs): (CMCC-CM2-SR5, CNRM/ESM2-1, EC-Earth3/Veg, MPI-ESM1/2-LR, MRI-ESM2/0, and NorESM2/MM) have been developed to show the future climate change depending on the precipitation data. They were designed along three periods, the reference period (1995–2015), the near-term (2020–2040), and the mid-term (2041–2060). Second, the prediction of the expected Rainfall-Depth (Q) for a return period (2–100 years) based on the rainfall data for 2000-2021 by applying the probability distribution function using the HEC-SSP software. Then, determined the expected Runoff-Depth depending on the results of the predicted probability of Rainfall-Depth for a specific return period and applied the Soil Conservation Service-Curve Number (SCS-CN) model to estimate the CN values of the catchment area from the soil classification according to maps of Land use/cover (LULC) and hydrologic soil grouping (HSGs) generated by the ArcGIS software from the FAO Soils Portal website using Harmonized World Soil Database (HWSD) and the HEC-HMS. The HEC-RAS program is used to create flood maps by simulating runoff depth for forecasting 100 years. The results of the (GCMs) models found the ensemble precipitation change tends to increase at Mosul and Tikrit sites, while Sammara and Baghdad sites noticed no significant changes for both the near and mid-term. The flood map reveals that the expected runoff has covered the urban areas.
SCS-CN, climate forecasting, Tigris River, flood hazard mapping, Iraq
There are two essential rivers in Iraq, the Tigris and Euphrates Rivers, which are presented as the primary sources of drinking water and irrigation [1, 2]. Over the past few years, Iraqi territories have experienced a lack of water resources to meet present and future demands. These shortages are primarily related to the southeastern Anatolia Project (GAP), Turkey's projects by building many dams on the Tigris and Euphrates Rivers, besides the diversion of many tributaries from the Iranian sides. The second is the effect of climatic change, which has impacted stream flow and the amount of runoff [3, 4]. Iraq has experienced drought periods in the last few years [5, 6].
Long-term analysis of rainfall data indicates that Iraq's annual precipitation has been decreasing over time [7]. The water levels of the Tigris River have rapidly decreased to less than a third of their normal capacity. Due to progressive desertification, upstream water use and damming, diminishing precipitation with rising temperatures, and other factors, water levels could decrease much further in the upcoming years [8]. These patterns indicate increased evaporation with an increase in drought periods. Prior to 1984, the Tigris River in Mosul City had an average annual flow of 701 m3/s; this flow decreased after 2002 to 596 m3/s [9, 10]. This point indicates a 55 percent drop in the discharge of the Tigris River [9]. The Tigris River basin in Iraq will suffer significantly as a consequence of this issue. A decrease in rainfall is associated with an increase in temperature may due to climate change [11, 12].
A precise assessment of water resources in a given area requires an exact definition of hydrologic conditions involving stream flows and climatic parameters. Climatic factors play an essential role in hydrologic studies that can be used to assess the essential components of the water balance [13]. One of the most significant problems has been the identification of a strong correlation between precipitation and runoff in any catchment area by climatologists, engineers, and agriculturists since its first documentation [14, 15]. The transformation process from precipitation to runoff is extremely difficult, dynamic, non-linear, and has time and space variation. Also, it is impacted by different parameters and interdependent-physical factors. Rainfall is an essential component of a hydrological cycle and a principal source of surface runoff [16]. The Soil Conservation Service-Curve Number (SCS-CN) method converts precipitation into surface runoff (or excess rainfall) using a CN produced from the characteristics of the soil basin depending on the land use land cover (LULC) and hydrological grouping of the soils (HSGs) maps [17]. Also, to analyze the potential change in rainfall, another approach is used in this study for a better vision of the impact prediction of climate change [18], utilizing specific GCMs (Global Climate Models), which are used to forecast weather, investigate climate, and predict climate change.
Hamdan et al. [19] applied the method of SCS-CN to the Al-Adhaim River catchment, which is located in the middle of Iraq. Al-Adhaim River, which joins the Tigris River in Al-Doluwyia city in the north part of Baghdad. Two years were used to calibrate the model, and one year was utilized for verifying the daily rainfall values. The results demonstrated a close association between the observed and simulated hydrographs. Based on the results, the model is suitable for hydrological simulations in the Adham River basin.
Saber et al. [20] were among the researchers that utilized the spatially distributed hydrological model and the SCS-CN approach to examine the runoff of watersheds in Arabic countries. The aim was to compare studies of a few significant basins (Wadi Al-Khoud in Oman) in order to look at the variations in runoff volumes over time and space. They concluded that the model can be used to estimate surface runoff in arid areas, depending on the SCS-CN approach. Al-Zubi et al. [21] carried out their investigation in the eastern region of Jordan's Wadi Muheriwir, a semi-arid region. Applying the SCS-CN approach with the rainfall data that was available for the years 1976 to 2006, they calculated the runoff. They came to the conclusion that the Wadi Muheriwir curve number is approximately 80, and the average runoff is approximately 63 mm.
Due to the sparse information on the correlation between the effects of climate change and water resources in Iraq, Abbas et al. [22], analyzed the projected precipitation along the region through ensembles of six general circulation models (GCMs). And based on the popular hydrological model of SWAT, which describes the availability of water resources as blue and green over the near and distant terms of the future. The main findings proposed that the region could be exposed to a precipitation reduction of 12.5% in 2049–2069 and 21% in 2080–2099 under RCP8.5.
Khalid et al. [23] analyzed the relationship between the climate variability factors and the yield values for 33 years (1985–2020) in Al-Qadissiya province in Iraq, using a regression model. Spearman’s rho and Sen’s slope methods were used to analyze climate change's magnitude and trend. The results indicated a trend of climate change, and yields indicate a mixed and significant increase in annual humidity.
In China, the Yangtze River's middle and lower reaches [24] explored the response of irrigation water requirements of three types of cultivated rice, temporally and spatially, to the impact of climate change by utilizing the specially developed rice growing period method with a water balance model, both of which consist of irrigation scheduling. And evaluate the impact over the historical period (1961–2012) and future period (2011–2100) through the input of projected data for GCMs under RCP4.5, RCP2.6, and RCP8.5. The results indicated a shortening of the rice growing season by up to 10 days in the 2080s under RCP8.5. And the irrigation water requirement decreased in the historical period by 1.85 and 2.10 mm/year and increased up to 100 mm/year under RCP4.5 and RCP8.5.
In order to calculate the necessary quantities of water storage in reservoirs and predict the probability of floods, it has become important to estimate the quantities of runoff by knowing the amount of rainfall. In general, it should be noted that relatively few researchers have taken a modeling approach and excluded the study region in Iraq. For this approach, large amounts of input data, such as DEM maps, land use and cover maps, soil type maps, curve number maps, and rainfall data, have been prepared for the model. With the help of this study, other researchers will be well-supported to carry out similar studies for catchments that are nearby in Iraq, thereby controlling the management of water resources in Iraq.
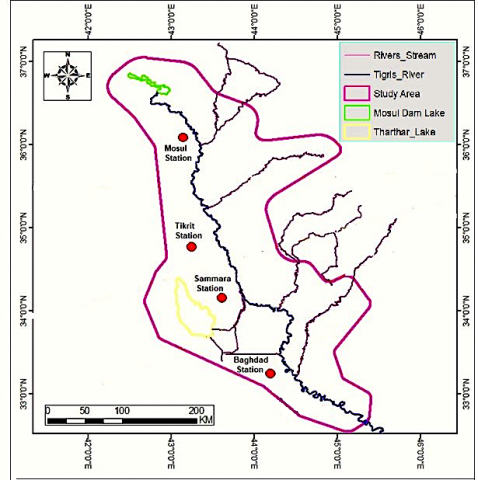
The path of the Tigris River in the study area is extended from Mosul city in the Ninawa district in the northern part of Iraq to Baghdad city in the center of Iraq (36o23′51.96″-32o54′09.99″ N and 42o59′53.42″-45o03′28.45″ E) (Figure 1).
Figure 1. The location and geological map of the Tigris River catchment area
The main stations include (Mosul, Tikrit, Sammara, and Baghdad). Climate may be regarded as an important environmental component of environmental assessments because it plays a major role in influencing other components of the discharge, such as natural processes such as weathering, erosion, transport, deposition, and the relationship between geochemical variables that inflect on living organisms [25]. Iraq is situated in a dry to semi-dry region where the continental climate dominates. It is typically a semiarid climate, with long, hot, dry summers and a short, cold winter characterized by limited precipitation, low humidity, a high rate of evaporation, and a shortage of water [12]. The maximum mean monthly of the temperature for the period (1990-2020) are (34.80, 31.2, 42.93, and 40.03) ℃ in July, and the minimum mean monthly of the temperature are (7.26, 7.55, 13.63, and 10.48) ℃ in January for Mosul, Tikrit, Sammara, and Baghdad sites respectively. The maximum average monthly values of the precipitation are (61.4, 33.3, 29.88, and 24.33) mm for Mosul, Tikrit, Sammara, and Baghdad sites respectively. The discharge of Tigris River water in the Mosul site varied between 265 to 866.36 m3/sec with a mean value of 530.38 m3/sec, and at Tikrit, varied between 610 to 1250 m3/sec with a mean value of 859.60 m3/sec, whereas, in Sammara varied between 399.58 to 657.92 m3/sec with the mean value of 508.79 m3/sec, and in Baghdad varied between 395 to 711.25 m3/sec with the mean value of 503.72 m3/sec. It should be noted that the Tigris River flows through the silt, clay, and occasionally sand-rich sediment of its floodplain on occasion as it moves along its course. The sediments are generally similar to those found on river terraces. In the city of Baghdad, the Tigris River runs into the Mesopotamian plain's sediments and goes on until the south [26].
This study aims to (1) examine the impacts of future climate change upon rainfall quantiles at the Tigris River basin from Mosul to Baghdad, to increase the degree of certainty of the predicted impact of climate change and strengthen water management; and (2) predict the rainfall-runoff depth in the Tigris River basin in order to define the flood inundation boundaries that occur in the research area and save water for drought conditions.
There are two approaches in this study (Figure 2):
Figure 2. The flow chart of methodology work
a. Climatic scenario data analysis
The climate scenarios are designed for several global climate models (GCMs) under the (SSP5--8.5) scenarios, which are supplied by RICCAR, it appears that have access to climate scenario data to simulate the potential impacts of climate change on the rainfall rates. The historical weather data includes the daily rainfall which was provided by the Iraqi Argo-metrological network. The data includes projected changes over three-time horizon includes: —reference period (1995–2015), near-term (2020–2040), and mid-term (2041–2060)—that established from the HCLIM-ALADIN, which is a regional climate model. The model covers the Mashreq Domain with a horizontal resolution of 10x10 km2 and is driven by data from CMIP6-GCM, it is based on the emission scenario for SSP5-8.5. According to the IPCC, to reduce the uncertain level of these projected data, necessary to adopt the ensemble method (E-RCM) by Calculating the average of multi-models’ outputs to explore the changes over the future.
b. Rainfall-Runoff modeling (SCS-CN) approach, morphological characteristics and flood model
The maximum daily rainfall data were used in this approach for the period (2000-2021) for the main sites includes: Mosul, Tikrit, Sammara, and Baghdad, as shown in Table 1. The data were obtained from the Iraqi meteorology organization depending on the historical records of the meteorological gauges in the study area as shown in Figure 3 and were statistically examined utilizing the proposed model by applying the statistical analysis including the probability distribution function (PDF) using the software (HEC-SSP and HEC-DSSVUE) to determine the predicted probability of rainfall depths (mm) for a specific return period (2-100 years).
Table 1. Maximum daily rainfall depth records (mm) for Mosul, Tikrit, Sammara, and Baghdad stations over the period (2000 to 2021) [27]
|
Years |
Mosul |
Tikrit |
Sammara |
Baghdad |
|
2000 |
30.5 |
22.2 |
24.3 |
18.3 |
|
2001 |
43.5 |
23 |
28.1 |
21.3 |
|
2002 |
48 |
25.6 |
28.2 |
23.9 |
|
2003 |
37.2 |
24.5 |
20.4 |
18.2 |
|
2004 |
67.9 |
5.2 |
20.3 |
22 |
|
2005 |
40.6 |
34 |
24 |
34.1 |
|
2006 |
66.8 |
65.2 |
29.4 |
23.6 |
|
2007 |
66.8 |
39 |
28.2 |
16.6 |
|
2008 |
35.6 |
34 |
40.6 |
13.51 |
|
2009 |
38.6 |
26 |
47.6 |
10 |
|
2010 |
32.3 |
24.6 |
33.4 |
12.2 |
|
2011 |
65.3 |
31.6 |
19.5 |
27.8 |
|
2012 |
42.8 |
44.6 |
34.7 |
67.5 |
|
2013 |
35.5 |
35.8 |
62 |
89.1 |
|
2014 |
42.9 |
137 |
23.4 |
12.7 |
|
2015 |
27.4 |
24.86 |
110 |
54.1 |
|
2016 |
26.8 |
20.13 |
51.8 |
29.6 |
|
2017 |
93 |
12.09 |
66.40 |
18.3 |
|
2018 |
61 |
70.1 |
44.8 |
39.2 |
|
2019 |
66.8 |
82.1 |
28 |
78.6 |
|
2020 |
40.2 |
35 |
77.6 |
40.5 |
|
2021 |
48.62 |
46.9 |
35.11 |
32.2 |
Common standard probability distributions for flood design estimating. The HEC-SSP software (version 2.2) enables broad frequency analysis of rainfall data to be performed by the user, as well as other data types.
Figure 4 illustrates a useful tool that may be used in conjunction with the General Frequency Analysis analytical techniques, also presents the input data window and selects the best-fitting distributions method for expected probability Rainfall-Depth.
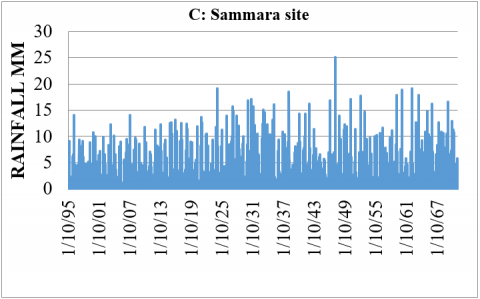
Figure 3. Meteorological gauges stations along the Tigris River catchment area
Figure 4. Selecting the best fit distributions method using HEC-SSP software program (Version 2.2)
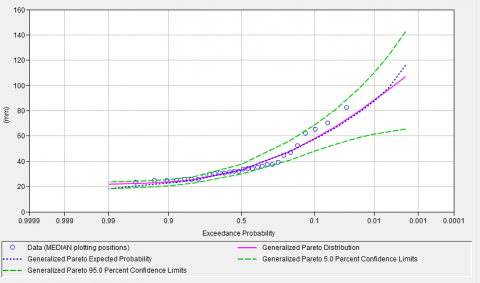
To find the expected Rainfall-Depth (mm) for the return period (2-100 years), must be select the Expected Probability Curve option by inputting the maximum daily rainfall for the study period. The expected probability curve is most often used in establishing design flood criteria. Next, by selecting the most fitting distribution method such as Weibull, GEV, and Gumball the default Confidence Limits of 0.05 (5 percent chance exceedance) and 0.95 (95% chance exceedance) for the plotting position method. For graphical analysis, once the appropriate data set has been selected, the desired options set and a compute is completed, the user selects the Graphical Tab to see results and build the graphical curve. Geographic information systems (GIS), Global Mapper, and Google Earth were used to determine the catchment area's boundaries and create a digital elevation map for the morphological characteristics.
To find the expected Runoff-Depth depending on the results of the predicted probability of rainfall data for 2-100 years return period through apply the Soil Conservation Service-Curve Number (SCS-CN) model and estimating the CN values of the catchment area from the soil classification according to maps of Land use/cover (LULC) and hydrologic soil grouping (HSGs) generated by the ArcGIS software from the FAO Soils Portal website using Harmonized World Soil Database (HWSD) and the HEC-HMS. Finally, apply the formula of the Soil Conservation Service to find the expected rainfall-runoff depth (Q) in mm, as mentioned below in Eqns. (1) and (2) [28].
According to reference [29], Runoff is calculated as follows:
$\mathbf{Q}=\frac{(P-0.2 * S) 2}{(P+0.8 * S)}$ (1)
where:
Q = Runoff Expected in (mm),
P = Expected-Rainfall (mm\year), and
S = which is the ‘potential maximum retention’ after beginning Run-Off. S: is related to the soil and soil conditions of the basin on the CN, and the connection between S and CN through [30]:
$\mathrm{S}=25.4 * \frac{1000}{C N}-10$ (2)
CN: (curve number), which is a unitless number, has a range from 0 to 100 that is based on the soil group, land use, and land cover, and determined from the SCS's given table [30]. Runoff CNs for arid and semi-arid rangelands and hydrologic conditions are poor, so the best CN for class B is 71 [31]. The final step was using the HEC-RAS model to draw the flood map by inputting the data of the expected rainfall-runoff depth for the 100-years return period.
3.1 Projected weather data
The prediction data in four locations were obtained from six global climate models (GCMs) driven by the scenario of shared socioeconomic pathways (fusil fuel scenarios) SSP5-8.5 provided by the Regional Initiative for the Assessment of Climate Change Impacts on Water Resources and Socio-Economic Vulnerability in the Arab Region (RICCAR). Three time horizons—reference period (1995–2015), near-term (2020–2040), and mid-term (2041–2060) were used in the creation of these data. The results of the projected precipitation rate show that experience variability over the time slices (2020–2040) and during the mid-term (2041–2060) during the growing season, including December, January, February, March, April, and May, and has a tendency to be lower in the mid-term compared to the near-term. According to results shown in Table 2, the ensemble precipitation change tends to increase at the Mosul site at 19.75 mm/year in the near term (2020–2040) and decrease in the mid-term (2041–2060) at 27.86 mm/year. In the Tikrit site, noticed an increase in the projected precipitation of the ensemble in the two horizons, and the increase in the first duration (2020–2040) is more significant than the second one (2041–2060). Mid-term, it could reach 7.71 mm above the reference, which represents a frequent trend over the period (1995–2060). For Sammara and the Baghdad site, noticed no significant changes for both the first and second durations (Figure 5).
Table 2. The outputs data of precipitation (mm\years) across the expected horizons (2020-2040) and (2041-2060)
|
Horizon |
Period |
Mosul |
Tikrit |
Sammara |
Baghdad |
|
CMCC\CM2-SR5 |
2020-2040 |
-33.85 |
-16.85 |
0.31 |
-0.04 |
|
2041-2060 |
5.7 |
0.2 |
0.37 |
-0.02 |
|
|
CNRM/ESM2-1 |
2020-2040 |
52.57 |
39.75 |
-0.57 |
-0.62 |
|
2041-2060 |
-25.4 |
0.79 |
-0.62 |
-0.51 |
|
|
EC-Earth3/Veg |
2020-2040 |
97.21 |
26.6 |
-0.54 |
-0.65 |
|
2041-2060 |
-12.2 |
10.72 |
-0.63 |
-0.55 |
|
|
MPI\ESM1/2-LR |
2020-2040 |
-75.14 |
-11.05 |
-0.53 |
-0.46 |
|
2041-2060 |
-35.7 |
-17 |
-0.46 |
-0.37 |
|
|
MRI-ESM2/0 |
2020-2040 |
103.35 |
6.55 |
-0.51 |
-0.6 |
|
2041-2060 |
-21.95 |
22.55 |
-0.6 |
-0.49 |
|
|
NorESM2/MM |
2020-2040 |
-25.67 |
1.3 |
-0.58 |
-0.59 |
|
2041-2060 |
-77.6 |
6.43 |
-0.6 |
-0.54 |
|
|
Average |
2020-2040 |
19.75 |
7.71 |
-0.55 |
-0.58 |
|
2041-2060 |
-27.86 |
3.9 |
-0.58 |
-0.5 |
Figure 5. Predicted precipitation ensemble (mm/year) during the growing seasons (1995- 2060) along the study area: a) Mosul; b) Tikrit; c) Sammara; d) Baghdad
3.2 Predication of the rainfall-runoff depth
3.2.1 Prediction of the rainfall-depth
The best fit of rainfall data is utilized for planning and design purposes for various hydrological projects [23]. The data that is readily available for the study area from 2000 to 2021 is used for this purpose, as shown in Table 1, were treated statistically for the return period (2–100) years to predict the expected rainfall depth. The results of the prediction for the rainfall data are shown in Table 3.
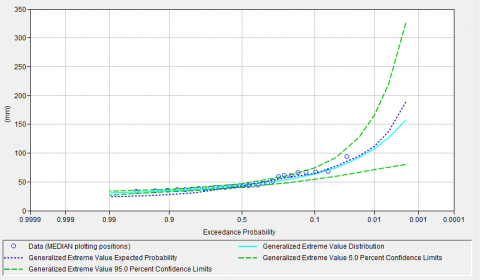
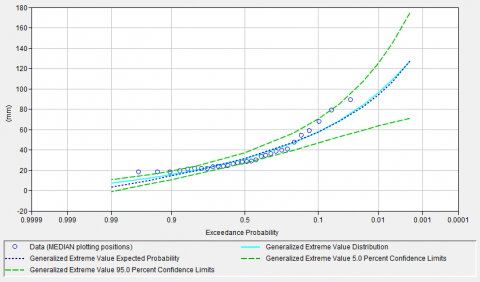
The result of statistical analysis of the best-fit distribution method created from HEC-SSP software of maximum daily rainfall records was a Generalized Extreme Value (GEV) distribution for the expected rainfall depth (mm) of the current study. The result values of the expected probability are closer to forecasted values in the GEV than in other distribution methods, Figure 6.
From the results that show the expected probability of the rainfall depth in Mosul site was higher than other sites may be due to the climate condition of this site because of their location in the northern part of Iraq, and these areas have an amount of rainfall that is higher than regions that are found in the middle and southern parts of Iraq.
3.2.2 Morphological study
The catchment area's physical characteristics, such as the mean slope and elevations, are crucial for hydrological research. Drawing the catchment's boundaries using GIS software and a DEM with 30 m precision from the global mapper for the research area (Figure 7).
Table 3. Amount of forecasted rainfall as a result of statistical analysis of maximum daily rainfall records of the catchment areas
|
Return period |
Percent chance exceedance |
Expected probability Rainfall-Depth mm |
Forecasted |
|
|
Confidence limits 0.05% |
Confidence limits 0.95% |
|||
|
Mosul station |
||||
|
2 |
50 |
43.13 |
47.12 |
40.61 |
|
5 |
20 |
59 |
61.13 |
48.92 |
|
10 |
10 |
64.48 |
74.29 |
54.7 |
|
20 |
5 |
77.81 |
92.33 |
59.98 |
|
50 |
2 |
94.66 |
127.25 |
66.48 |
|
100 |
1 |
111.92 |
165.88 |
71.01 |
|
Tikrit station |
||||
|
2 |
50 |
33.32 |
37.79 |
29.91 |
|
5 |
20 |
47.7 |
56.09 |
40.86 |
|
10 |
10 |
57.55 |
68.52 |
47.78 |
|
20 |
5 |
66.49 |
80.79 |
53.33 |
|
50 |
2 |
78.47 |
97.41 |
58.59 |
|
100 |
1 |
87.7 |
110.27 |
61.45 |
|
Sammara station |
||||
|
2 |
50 |
29.44 |
34.01 |
25.44 |
|
5 |
20 |
45.99 |
57.23 |
37.4 |
|
10 |
10 |
58.55 |
75.4 |
45.16 |
|
20 |
5 |
71.33 |
95.14 |
51.73 |
|
50 |
2 |
88.82 |
123.44 |
58.56 |
|
100 |
1 |
103.37 |
147.19 |
62.57 |
|
Baghdad station |
||||
|
2 |
50 |
31.7 |
37 |
26.99 |
|
5 |
20 |
47.33 |
56.14 |
39.5 |
|
10 |
10 |
57.65 |
70.38 |
46.67 |
|
20 |
5 |
68.1 |
85.35 |
52.69 |
|
50 |
2 |
82.27 |
106.95 |
59.31 |
|
100 |
1 |
94.2 |
125.29 |
63.49 |
Figure 6. Probability distribution curve using Generalized Extreme Value (GEV) distribution for: a. Mosul, b. Tikrit, c. Samarra, and d. Baghdad
Figure 7. Digital elevation model for the catchment area (used the Global mapper software, SRTM website on April 14, 2022)
3.2.3 SCS-CN model
In the absence of good hydrological data, the SCS-CN approach can be used to estimate the amount of surface runoff for a specific time period during a rainfall event. The hydrologists of the United States Department of Agriculture have created a template [32]. The following data is needed to apply the model: curve number, maximum daily rainfall depth (mm), and return period [31].
Determining runoff curve number. In the SCS hypothesis, which considers land use, soil type, geological structure, and vegetation, the surface runoff curve number (CN) is a significant element in determining the runoff [30].
A. Land Use-Land Cover Map (LULC)
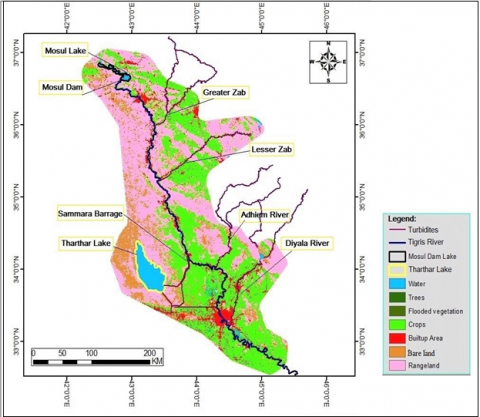
The terms "land use" and "land cover," which determine how a specific region is used, indicate that the use of LULC can take various forms, including built-up land, including aquatic bodies, barren land, agricultural land, and roads [33]. In recent years, many human activities have led to significant changes in agricultural land patterns. These changes in LULC have implications for water resources primarily through soil moisture, evapotranspiration, vegetation interception, surface infiltration, runoff, etc., thus impacting watershed hydrology processes and water resource cycles [34]. The LULC mapping along the studied area has been constructed using USGS ETM Landsat-8 (30 m resolution) satellite imagery. According to (Figure 8), findings indicate that grasslands, crops, and bare and built-up areas make up the majority of the categories of land use and coverage in the research area.
B. Hydrologic Soil Group Map (HSGs)
This term has been introduced through the National Resource Conservation Service (NRSC) [31], which has categorized soil types with similar physical and runoff characteristics into specific groups of HSGs. According to the infiltration ratio, HSGs A, B, C, and D were ordered in decreasing order (Table 4). Group D mentions soils with low seepage rates, whereas Group A mentions soils with high seepage rates (possibility for low runoff) and high potential runoff. Classes B and C are designated for soil types with moderate and low infiltration percentages, respectively.
Figure 8. Hydrologic land use in Tigris River catchment area classified using the GIS
Table 4. Groups of soil textures called Hydrologic Soils (HSGs) [35]
|
Classes |
The Texture of Soils |
|
A |
Sand, Loamy Sand & Sandy Loam |
|
B |
Silt Loam & Loam |
|
C |
Only Sandy Clay Loam |
|
D |
Silty Clay Loam, Clay Loam, Sandy Clay, Silty Clay & Clay |
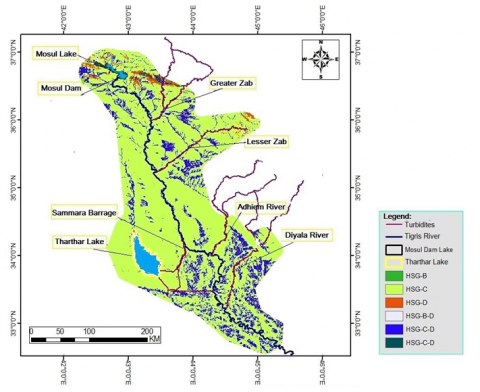
Figure 9. (HSGs) along the studied area (Harmonized World Soil Database – HWSD – 2021)
The HWSD viewer indicates that the catchment area's soil type is classified as HSG-C (90.81%), occupying most of the area from Mosul to Sammara, which means it was sandy clay loam, and in Baghdad, the soil is classified as HSGs-C-D, which means it was mostly mixed between sandy clay loam and clay loam, sandy clay, silty clay, and clay. The Harmonized World Soil Database (HWSD-2021) shows that the HSGs-C-D indicate that the SCS-CN approach implies that the soils in the region have a medium-to-thin structure with a weak water transfer speed and a low infiltration rate when wet (Figure 9).
C. Curve Number Estimation
According to Table 5 and the results of the LULC's and HSG's maps of the study region, the CN value is 76 for the site at Mosul and 85 from Tikrit to Baghdad. A high number of curves mean high runoff and low (urban areas) infiltration, while a low number of curves mean low runoff and high (dry soil) infiltration. The CN of the study area increased as a result of the growth of the city's population, a decline in the amount of vegetative cover, and a shift in the use of the land.
Table 5. Curve numbers for land use categories [35]
|
Land use/Soil type |
Hydrologic Soil Grouping |
|||
|
A |
B |
C |
D |
|
|
Forest’ |
30 |
55 |
70 |
77 |
|
Grassland |
43 |
65 |
76 |
82 |
|
Cropland’ |
67 |
77 |
83 |
87 |
|
Water bodies |
100 |
100 |
100 |
100 |
|
Built-up area’ |
77 |
85 |
90 |
92 |
|
Bare surface/rock |
39 |
61 |
74 |
80 |
|
Shrubs’ |
39 |
61 |
74 |
80 |
|
Wetland |
100 |
100 |
100 |
100 |
Table 6. Calculation of the expected Runoff-Depth (mm) for a return period (2-100) years based on the SCS-CN model
|
Site |
Return period |
Expected probability Rainfall-Depth mm |
Runoff Expected (mm) |
|
Mosul site |
2 |
43.13 |
1.59 |
|
5 |
59 |
0.63 |
|
|
10 |
64.48 |
101.20 |
|
|
20 |
77.81 |
2.20 |
|
|
50 |
94.66 |
43.67 |
|
|
100 |
111.92 |
102.61 |
|
|
Tikrit site |
2 |
33.32 |
15.69 |
|
5 |
47.7 |
47.70 |
|
|
10 |
57.55 |
1.78 |
|
|
20 |
66.49 |
30.99 |
|
|
50 |
78.47 |
2.45 |
|
|
100 |
87.7 |
43.69 |
|
|
Tikrit site |
2 |
29.44 |
2.21 |
|
5 |
45.99 |
7.96 |
|
|
10 |
58.55 |
44.40 |
|
|
20 |
71.33 |
0.68 |
|
|
50 |
88.82 |
45.22 |
|
|
100 |
103.37 |
49.35 |
|
|
Baghdad site |
2 |
31.7 |
17.94 |
|
5 |
47.33 |
47.32 |
|
|
10 |
57.65 |
1.81 |
|
|
20 |
68.1 |
32.44 |
|
|
50 |
82.27 |
3.85 |
|
|
100 |
94.2 |
48.19 |
Runoff-depth prediction using SCS-CN model. The extracted data of the expected rainfall depth from statistical analysis by applying the HEC-SSP software were taken and applied in the Eq. (1) to estimate the expected runoff Q (mm). Based on the Eqns. (1) and (2) as mentioned in the methodology, the soil moisture content (S) was equal to (324.21) for the Mosul site and (297.70) from Tikrit to the south of Baghdad. The results of estimation runoff (Q) for the 2-100 return period were 102.61 mm in Mosul, 43.69 mm for Tikrit, 49.35 mm for Sammara, and 48.19 mm for Baghdad (Table 6).
3.2.4 Flood model
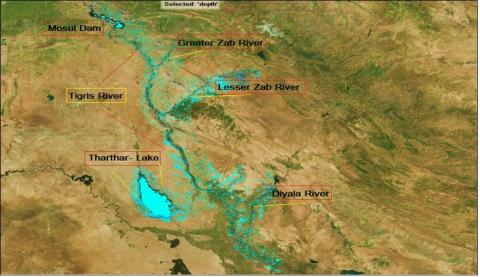
The major ways that climate change can affect the hydrological cycles are via altering evapotranspiration and precipitation. Changes in precipitation and evapotranspiration have the potential to produce severe droughts or big floods, which can have a considerable impact on a basin's water balance [36]. Based on the hydrologic modeling procedure explained in studies [37, 38], flood mapping was created by the ‘HEC-RAS’ with ‘ArcView GIS’ depending on the expected runoff depth over a return period of 100 years only, and the results show the expected runoff (mm) has covered the urban areas on both sides of the Tigris River, especially in the areas nearby Bejii, Tikrit, and in the north and south parts of Baghdad cities. These areas may be due to the absence of vegetation cover and the growth of the built-up areas (Figure 10). Table 7 shows the weighted rainfall as runoff depth (mm) for the four sites along the Tigris River catchment area in percentages.
Table 7. Areal rainfall using the Thiessen Polygon method
|
Name of Site |
Area (km2) |
Weight % |
Rainfall-Runoff Depth (mm)for 100 return period |
Weighted Rainfall (mm) |
|
Mosul |
21,398 |
29 |
102.61 |
35.09 |
|
Tikrit |
14,012 |
19 |
43.69 |
17.40 |
|
Sammara |
14,624 |
20 |
49.35 |
21.8 |
|
Baghdad |
12,902 |
17 |
48.19 |
16.52 |
According to Figure 10, the basin considerably contributed to the floods. This is because the value of the CN increased as a result of the growth of the urban area, the reduction of vegetative cover, and the shift in land uses. According to the study, data on water flow and volume can be stored in a small lake to provide water during dry spells, a canal connected within Tigris River boundaries to drain the water into the river, or a pipe to drain the water to reduce evaporation and pollution.
Figure 10. Expected Runoff-Depth for 100 years return period simulated by HEC-RAS model in Tigris River basin
The study of climatic parameters such as rainfall is thus very important to provide a perfect vision of the nature of the study area. The projected precipitation rate experienced variability over the time slices (2020–2040) and during the mid-term (2041–2060) during the growing season, and has a tendency to be lower in the mid-term compared to the near-term. One of the main challenges in applied hydrology is predicting runoff in ungauged or imperfectly gauged watersheds. Simple runoff estimation techniques are thus crucial for hydrologic applications like flood planning and water balance models. The most well-documented and simple conceptual method is probably the Soil Conservation Service Curve Number (SCS-CN) method, which forecasts runoff depth from rainfall depth by using these soil characteristics. The rainfall-runoff depth in the study area was 102.61 mm at Mosul station, 43.69 mm at Tikrit station, 49.35 mm at Sammara station, and 48.19 mm at Baghdad station. It is recommended to divert the run-off from flood areas to the river to be stored in reservoirs situated next to the river, or to use the run-off results to meet irrigation needs in surrounding agricultural areas. Recommend increased consideration of flood risk and adaptation into land use planning and infrastructure design to mitigate impacts, along with further studies using larger ensembles of climate models and a wider range of return periods. Simple, robust hydrological methods like the SCS-CN method remain valuable tools for flood risk assessment in data-scarce environments. In summary, integrating projections of climate and hydrological changes into adaptation strategies will be crucial to building resilience to future flood risk along the Tigris River.
The national center of water resources management and the Directorate of Iraqi Metrological Organization in Baghdad are both acknowledged by the authors for their assistance and contributions to rainfall data.
[1] Asaad, B.I., Abed, B. (2020). Hydraulic characteristics of Tigris River within Baghdad city during drought conditions. University of Baghdad, Journal of Engineering, 26(3): 77-92. https://doi.org/10.31026/j.eng.2020.03.07
[2] Al-Mousawey, H.J., Abed, B.S. (2023). Simulation and assessment of water supply network for specified districts at Najaf Governorate. Journal of the Mechanical Behavior of Materials, 32(1): 20220233. https://doi.org/10.1515/jmbm-2022-0233
[3] Al-Ansari, N., Jawad, S., Adamo, N., Sissakian, V. (2019). Water quality and its environmental implications within Tigris and Euphrates rivers. Journal of Earth Sciences and Geotechnical Engineering, 9(4): 57-108.
[4] Al-Sekar, H.M., Al-Dabbas, M. (2022). Hydrochemical evaluation of the Tigris river from Kut to Amara sites, Iraq. Iraqi Journal of Science, 63(11): 4833-4844. https://doi.org/10.24996/ijs.2022.63.11.21
[5] United Nations Development Program (UNDP). (2011). Drought Impact Assessment, Recovery and Mitigation Framework and Regional Project Design in Kurdistan Region (KR).
[6] Hameed, M., Ahmadalipour, A., Moradkhani, H. (2018). Apprehensive drought characteristics over Iraq: results of a multidecadal spatiotemporal assessment. Geosciences, 8(2): 58. https://doi.org/10.3390/geosciences8020058
[7] Al-Ansari, N.A., Abdellatif, M., Ezeelden, M., Ali, S.S., Knutsson, S. (2014). Climate change and future long term trends of rainfall at north-eastern part of Iraq. Journal of Civil Engineering and Architecture, 8(6): 790-805.
[8] Al-Ansari, N. (2013). Management of water resources in Iraq: Perspectives and prognoses. Engineering, 5(6): 667-684. https://doi.org/10.4236/eng.2013.58080
[9] Al-Ansari, N., Knutsson, S. (2011). Toward prudent management of water resources in Iraq. Journal of Advanced Science and Engineering Research, 2011(1): 53-67.
[10] Oleiwi, A.S., Al-Dabbas, M.A. (2021). Relationship of annual flow with hydrochemical analysis of the Tigris river and evaluation of water for drinking and irrigation uses. Ecology, Environment and Conservation Paper, 28: S461-S472. https://doi.org/10.53550/EEC.2022.v28i01s.063
[11] Al-Ansari, N., Ali, A., Knutsson, S. (2014). Present conditions and future challenges of water resources problems in Iraq. Journal of Water Resource and Protection, 6(12): 1066-1098. https://doi.org/10.4236/jwarp.2014.612102
[12] Oleiwi, A.S., Al-Dabbas, M. (2022). Assessment of contamination along the Tigris River from Tharthar-Tigris canal to Azizziyah, middle of Iraq. Water, 14(8): 1194. https://doi.org/10.3390/w14081194
[13] Farhan, A.A., Abed, B.S. (2021). Estimation of surface runoff to Bahr Al-Najaf. Journal of Engineering, 27(9): 51-63. https://doi.org/10.31026/j.eng.2021.09.05
[14] Mishra, S.K., Singh, V. (2003). Soil Conservation Service Curve Number (SCS-CN) Methodology (Vol. 42). Springer Science & Business Media. http://dx.doi.org/10.1007/978-94-017-0147-1
[15] Abed, B.S., Daham, M.H., Ismail, A.H. (2021). Water quality modelling and management of Diyala river and its impact on Tigris river. Journal of Engineering Science and Technology, 16(1): 122-135.
[16] Kumar Mishra, S., Gajbhiye, S., Pandey, A. (2013). Estimation of design runoff curve numbers for Narmada watersheds (India). Journal of Applied Water Engineering and Research, 1(1): 69-79. https://doi.org/10.1080/23249676.2013.831583
[17] USDA. (1972). National engineering handbook (Section 4), Hydrology, Chapter 21, Design Hydrographs, Washington DC, NEH Notice 4-102. https://directives.sc.egov.usda.gov/OpenNonWebContent.aspx?content=18393.wba.
[18] Rosenzweig, C., Jones, J.W., Hatfield, J.L., Ruane, A.C., Boote, K.J., Thorburn, P., Antle, J.M., Nelson, G.C., Porter, C., Janssen, S., Asseng, S., Basso, B., Ewert, F., Wallach, D., Baigorria, G., Winter, J.M. (2013). The Agricultural Model Intercomparison and Improvement Project (AgMIP): Protocols and pilot studies. Journal of Agricultural and Forest Meteorology, 170: 166-182. https://doi.org/10.1016/j.agrformet.2012.09.011
[19] Hamdan, A.N.A., Almuktar, S., Scholz, M. (2021). Rainfall-runoff modeling using the HEC-HMS model for the Al-Adhaim river catchment, northern Iraq. Hydrology, 8(2): 58. https://doi.org/10.3390/hydrology8020058
[20] Saber, M., Hamaguchi, T., Kojiri, T., Tanaka, K. (2009). Spatiotemporal runoff features of hydrological modeling in Arabian wadi basins through comparative studies. Annals of Disaster Prevention Research Institute, Kyoto University, 52(B): 813-830.
[21] Al-Zubi, J., Al-Zubi, Y., Abubaker, S. (2010). Hydrology and water harvesting techniques of wadimuheiwir catchment area-the case study of Jordan. Journal of Applied Science, 10(4): 298-304. https://doi.org/10.3923/jas.2010.298.304
[22] Abbas, N., Wasimi, S.A., Al-Ansari, N., Nasrin Baby, S. (2018). Recent trends and long-range forecasts of water resources of northeast Iraq and climate change adaptation measures. Water, 10(11): 1562. https://doi.org/10.3390/w10111562
[23] Khalid, K., Alib, M.F., Manc, N.F., Rahmanb, N.F.A., Yaccob, A.A., Noor, N.A.M., Rosli, S.H. (2016). Rainfall data analysis in Langat river basin using hyfran-plus. Journal of Engineering and Applied Sciences, 11(11): 2360-2365.
[24] Ding, Y., Wang, W., Song, R., Shao, Q., Jiao, X., Xing, W. (2017). Modeling spatial and temporal variability of the impact of climate change on rice irrigation water requirements in the middle and lower reaches of the Yangtze River, China. Agricultural Water Management, 193: 89-101. https://doi.org/10.1016/j.agwat.2017.08.008
[25] Mohy, H.M., Abed, B.S. (2020). Design of expert system for managing the system of Al-Tharthar Lake. Journal of Engineering, 26(1): 142-159. https://doi.org/10.31026/j.eng.2020.01.11
[26] Sissakian, V.K., Al-Jiburi, B.M. (2014). Stratigraphy of the high folded zone. Iraqi Bulletin of Geology and Mining, 6: 73-161.
[27] Iraqi Meteorological Organization, Ministry of Transport. (2022). Daily rainfall data 2000-2021 for Data for Mosul, Tikrit, Sammara and Baghdad Station, Department of Climate, Baghdad, Iraq
[28] FAO Soils Portal website: World Harmonized Soil Database (HWSD V.1.2) at website: https://www.fao.org/soils-portal/data-hub/soil-maps-and-databases/harmonized-world-soil-database-v12/en/.
[29] SCS. 1956. National engineering handbook, Supplement A, Section 4, Chapter 10, Washington, DC: Soil Conservation Service, USDA. https://directives.sc.egov.usda.gov/OpenNonWebContent.aspx?content=17752.wba.
[30] USDA-NRCS. (2004). Hydrology National Engineering Handbook, (Part 630), Estimation of Direct Runoff from Storm Rainfall, Chapter 10 National Engineering Handbook. https://directives.sc.egov.usda.gov/OpenNonWebContent.aspx?content=17752.wba.
[31] USDA. (1986). Urban Hydrology for Small Soil Conservation, Technical Release, TR-55, Second Ed. https://www.nrc.gov/docs/ML1421/ML14219A437.pdf.
[32] Shadeed, S., Almasri, M. (2010). Application of GIS-based SCS-CN method in West Bank catchments, Palestine. Water Science and Engineering, 3(1): 1-13. https://doi.org/10.3882/j.issn.1674-2370.2010.01.001
[33] Fisher, R.S., Mullican, III, W.F. (1997). Hydrochemical evolution of sodium-sulfate and sodium-chloride groundwater beneath the northern Chihuahuan Desert, Trans-Pecos, Texas, USA. Hydrogeology Journal, 5: 4-16. https://doi.org/10.1007/s100400050102
[34] Chen, J., Li, X. (2004). Simulation of hydrological response to land-cover changes. Ying Yong Sheng Tai Xue Bao, 15(5): 833-836.
[35] USDA-NRCS. (2009). Hydrology National Engineering Handbook, (Part 630), Hydrologic Soil Groups (Chapter 7). https://directives.sc.egov.usda.gov/OpenNonWebContent.aspx?content=22526.wba.
[36] Joseph, J., Ghosh, S., Pathak, A., Sahai, A.K. (2018). Hydrologic impacts of climate change: Comparisons between hydrological parameter uncertainty and climate model uncertainty. Journal of Hydrology, 566: 1-22. https://doi.org/10.1016/j.jhydrol.2018.08.080
[37] Tate, E., Maidment, D. (1999). Floodplain mapping using HEC-RAS and ArcView GIS. University of Texas at Austin Center for Research in Water Resources. http://dx.doi.org/10.26153/tsw/14666
[38] Ismael, M.H., Al-Tawash, B.S., Al-Saady, Y.I. (2019). Hydrochemical characteristics and environmental evaluation of surface and groundwater quality at Al-Tarmiyah Area, Baghdad, Iraq. Iraqi Journal of Science, 60(5): 1069-1084. https://doi.org/10.24996/ijs.2019.60.5.16