Arin Wildani*![]() | Sukir Maryanto
| Sukir Maryanto![]() | Didik R. Santoso
| Didik R. Santoso![]() | Hetty Triastuty
| Hetty Triastuty![]()
© 2023 IIETA. This article is published by IIETA and is licensed under the CC BY 4.0 license (http://creativecommons.org/licenses/by/4.0/).
OPEN ACCESS
A study of volcanic tremors at Ijen volcano declared critical with an alert status in 2012, has been investigated. This mountain is located on the border of Banyuwangi and Bondowoso Regencies, East Java, Indonesia. At that time, volcanic tremors were recorded in large numbers or not as usual, accompanied by changes in the conditions of the Ijen crater lake. For example, an increase in temperature and the appearance of gas bubbles on the crater lake's surface. This study aims to identify the source of the volcanic tremors of the Ijen volcano. The historical method is used, which begins with data collection and interpretation of the symptoms of events that occurred in the past. The data obtained critically describes the truth of events or facts to help know what to do in the future. Then these facts are analyzed using particle motion to determine the orientation of the earthquake source based on the epicenter's angle, the incidence angle, and the types of waves that dominate volcanic earthquakes. For this reason, an amplitude plot of 3 wave components from the seismic record is carried out. The results showed that the orientation of the epicenter of the volcanic tremor of the Ijen volcano was towards the Ijen crater area. Meanwhile, the orientation of the hypocenter is towards the area below the center of the Ijen crater, about 1 km. In addition, the dominating wave is the horizontal S wave (SH) or the Love wave, which indicates that the single volcanic tremor of Mount Ijen occurred in a shallow area. Based on the fractal dimension value of the volcanic tremor, it strengthens the notion that the fluid-filling crack resonance causes the mechanism of the source of the volcanic earthquake.
earthquake, volcano eruption, vibration
Indonesia is a country that has 127 active volcanoes spread across land and sea. One is Mount Ijen, characterized by phreatic eruptions known as bursts of steam, water, ash, rocks, or volcanic bombs [1]. Phreatic eruptions occur when magma heats groundwater or surface water. The extreme temperature of the magma (500 to 1170℃ (930-2100°F) causes the almost instantaneous evaporation of water to vapor, resulting in explosions of volcanic vapor, water, ash, rock, and volcanic bombs. Explosions can occur when the pressure below the drain plug exceeds the threshold and can damage the sewer cover so that material such as steam, water, or gas can escape or surface [2]. Many researchers have described the mechanism of volcanic plugging as a plugging channel analogously to the reeds of wind instruments such as the clarinet [3] or the intermittent valve that releases steam in a pressure cooker [4]. In addition, the authors [5-8] explain conceptual modeling that the frequency of volcanic vibrations is affected by the length of the gas column in the conduit pipe and the volume of gas in the pipe.
Almost all volcanoes will give precursors (signs) when they erupt. Magma rising to the earth's surface will cause volcanic tremors, which can usually be detected by seismographs (earthquake vibration recording devices). As is well known, volcanic tremor is one of the seismic activities that usually accompanies or appears before the eruption of a volcano [9]. The appearance of a volcanic tremor is usually used as a marker for an impending eruption at a volcano [10-12]. In addition, the movement of magma can also cause soil deformation in the body of the volcano. The appearance of gas and changes in temperature and chemical content in groundwater close to a volcano can also be used to benchmark that the mountain will experience an eruption. These indicators, coupled with an in-depth understanding of the historical characteristics of volcanic eruptions that have occurred, can improve predictions of eruptions that are better made by volcanologists.
Several studies of the phenomenon of volcanic tremors have been carried out in various cases of volcanic eruptions. The characteristics of volcanic tremors are widely described in the limited frequency range of 1-9 Hz, with various patterns that appear [13]. For example, the volcanic earthquake of the Semeru-Indonesia volcano is classified into spasmodic and harmonic tremors. Semeru-Indonesia volcano spasmodic tremor frequency ranges from 1.56-1.86 Hz, and the fundamental frequency of harmonic tremor ranges from 1.14 - 2.50 Hz. Meanwhile, a paper [14] reported volcanic tremors of the Raung-Indonesia volcano included in the spasmodic type with the frequency of volcanic tremors in the range of 2.81-3.21 Hz. In another case related to shallow fracture resonance, volcanic tremor with a period close to 15 s has also been observed at the Aso-Japan volcano [15-17]. It is also different from the volcanic tremor of the Kilaluea-Hawaii volcano, which shows spectra with a peaked structure. Interestingly, most high-frequency peaks are only present in the near field and cannot be transmitted to the far field. According to Fee et al. [18], hydraulic fracturing experiments carried out the frequently observed spectral features for volcanic vibrations and, in some cases, the associated seismic signals.
In addition to the frequency characteristics of volcanic tremors, several researchers have also observed volcanic phenomena based on the parameters of non-linear processes, such as fractal dimensions and the Lyapunov exponent. Maryanto and Mulyana [19] argue that the fractal dimension is practical for investigating volcanic seismic events. For example, the eruption activity at Semeru Volcano, East Java, Indonesia, where the explosive event and the successive harmonic vibrations were analyzed by spectral exponential and Lyapunov [20]. Here, the peak frequency of earthquake explosions ranges from 1.2 to 1.9 Hz, and harmonic vibrations have a peak frequency range of 1.5-2.2 Hz. Later [21] reported that the vibration source of Semeru volcano fluctuated between a quasi-periodic state with a few additional tone frequencies (2-3) and a small Maximal Lyapunov Exponent (MLE) (~0.013) and a chaotic state with more overtones (up to 8 ) as well as larger MLE (up to 0.039). In other cases, as in paper [16, 21], the volcanic tremor of Raung volcano has fractal dimensions ranging from 2.91 to 3.35 and the Lyapunov exponent ranging from 0.016 to 0.030. Based on the fractal dimensions and the Lyapunov exponent, the volcanic tremors of the Raung volcano are chaotic.
In this regard, a different phenomenon occurred in 2012, when the status of the Ijen volcano was declared on alert. Some experts have given this condition special attention because the volcano shows no phreatic eruptions. However, only appears continuously gas bubbles accompanied by an increase in the water temperature of the Ijen crater. Such surface conditions indicate a higher contribution of liquid, vapor/gas into the lake system but do not trigger phreatic eruptions [22]. Based on monitoring of Ijen volcano seismic activity, accompanied by upwelling bubbles in the crater lake with records of volcanic tremors in a more significant amount than usual. According to Caudron et al. [22], this higher contribution of liquid, steam/gas to the lake system might have triggered the recording of these large amounts of volcanic tremors at Ijen volcano. Thus, it is crucial to understand the volcanic tremor activity of the Ijen volcano, both in terms of the characteristics and the internal processes that trigger the emergence of the volcanic tremor.
Therefore, this paper aimed to conduct a post-critical case study of the Ijen volcano in 2012. This paper will analyze the volcanic tremor signals of the Ijen volcano to obtain dynamic characteristics and their variations. The analysis will be presented as Ijen volcano volcanic tremor waves and their spectral characteristics in the time-frequency domain. Then some data analysis will be described in the form of temporal variations of regularization dimension values and volcanic particle motion tremors to identify the type of wave and the direction of orientation of the source of the volcanic tremor of the Ijen volcano. Spectral, temporal values and variations, fractal dimensions, and particle motion are then studied and discussed to explain the possible triggering mechanisms for the volcanic tremors of the Ijen volcano.
The historical method is used in this study. Historical research is a study and other sources that contain information about the past and are carried out systematically. In other words, the research describes symptoms but not what happened when the research was conducted. In this study, data were examined between 2012-2014. Because the 2012 data had problems reading spatial data, historical data was taken for 2014. The reason is that the track record of seismic activity is similar to that of 2012. In addition, in 2014, the number of tectonic earthquakes was quite large, although not the same as in 2012. However, in 2014 there were many volcanic earthquakes compared to 2012, although they were not declared critical.
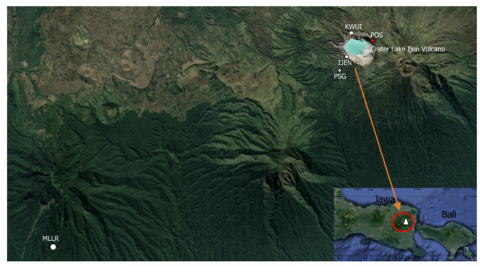
Figure 1. Distribution of seismic stations of Ijen volcano
In this regard, the data analyzed were obtained from digital seismic data of Mount Ijen from the Center for Volcanology and Geological Hazard Mitigation (CVGDM), Bandung-Indonesia, from January to April 2014. Seismic recorded data for Mount Ijen were monitored from 5 seismic stations spread across the whole area of the Ijen volcano. IJEN, KWUI, POS, TRWI, and MLLR stations are shown in Figure 1. Four stations are close to the Ijen crater, IJEN, KWUI, POS, and TRWI stations. IJEN Station is directly adjacent to Ijen Crater. In the south, there is a KWUI station; in the north, there are POS and KWUI stations. In contrast, the farthest is the MLLR station in the Southwest of Ijen Crater.
IJEN, KWUI, and POS stations use short-period sensors with only a vertical component, while MLLR and TRWI stations use sensors that record three components. Seismic data is transmitted to the Ijen Crater Observatory, which is located 15 km to the south of the crater. In addition, in this study, only three station data were used: IJEN, TRWI, and MLLR. That is because, in 2014, the equipment was damaged, so the data recording was unclear and did not show seismic recordings, even though the POS and KWUI stations were close to the IJEN crater.
Firstly, selecting volcanic earthquake data from all seismic stations. Secondly, analyze the spectral and spectrogram using the fast Fourier transform method. Then, particle movement was analyzed using seismic recorded data from 3 component stations. Finally, validate the three-component data by comparing them with data at the IJEN station. That was done because the position of the MLLR station is far away while the IJEN station is directly adjacent to the Ijen crater.
3.1 Characteristics of the volcanic tremor
Generally, conventional monitoring methods are used by researchers and monitoring agencies to detect and classify various types of seismic signals of active volcanoes. For example, visual inspection of the amplitude, dominant frequency, and duration of seismic signals and associated surface activity. Several conventional methods rely on noticeable and rapid changes in seismic amplitude and spectrum, such as the short-time average/long-time average (STA/LTA) method [23] and the seismic signal kurtosis and skewness method [24]. However, signal coherence is used at several stations in the seismic network for volcanic earthquakes with sudden onset, such as volcanic tremors, such as in the case of Ijen volcano. Figure 2 shows the volcanic tremors of the Ijen volcano, which are classified into two types, including single volcanic tremors and tremors related to the VT earthquake.
Figure 2. Seismogram of volcanic tremor Ijen volcano a) Single volcanic tremor b) Volcanic tremor associated with volcanic earthquakes
(a)
(b)
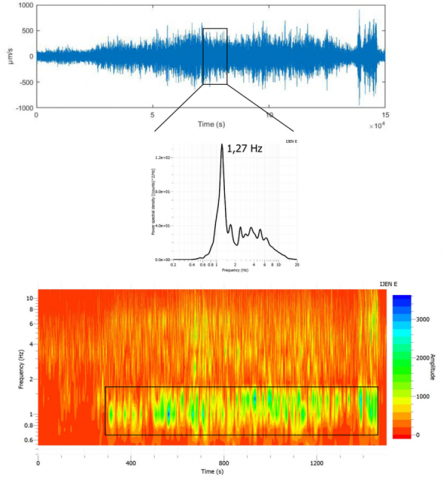
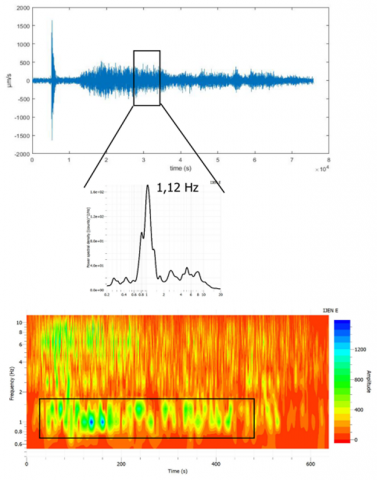
Figure 3. Seismogram, spectral dan spectrogram (a) single volcanic tremor; (b)volcanic tremor asosiasi dengan gempa vulcanic
The single volcanic tremor of the Ijen volcano is a volcanic tremor that occurs independently and is not accompanied by other types of earthquakes. Meanwhile, volcanic tremors associated with VT earthquakes are volcanic tremors that were recorded after or before the appearance of the VT earthquake. Figure 3a shows a single volcanic tremor on January 14, 2014, at 04.20-04.45 WIB. Based on the figure, it can be seen that the seismogram (top), spectral (middle), and spectrogram (bottom) with a dominant frequency peak of 1.27 Hz. Figure 3b is a volcanic tremor associated with the VT earthquake on January 24, 2014, at 3.00-3.40 WIB with a dominant peak frequency of 1.12 Hz. Based on the results of an investigation of 9 volcanic tremor events of the Ijen volcano, both single volcanic tremors and isolated from earthquakes, the average frequency was in the range of 1.12-1.35 Hz with the low-frequency category.
3.2 Identification of the orientation of the source of the volcanic tremor
In this paper, the movement of particles is used to identify the dominant type of wave and the orientation of volcanic earthquake sources. The type of wave that dominates is determined using a covariance matrix using 3 component data [25]. The direction of the orientation of the volcanic tremor epicenter was carried out by plotting the amplitude of the North-South and West-East (NS-EW) components of the seismic recording of the volcanic tremor of the Ijen volcano. The amplitude is selected, which has the maximum amplitude, then cut by 0.02 seconds (N=20) and plotted between AEW and ANS, and particle motion is obtained, as shown in Figure 4. Furthermore, the epicenter direction is determined from the back azimuth angle to the north-south direction indicated by arrows dashed blue in Figure 4a. Meanwhile, Figure 4b is marked with a dotted blue line showing the direction of orientation, and Figure 4c is a seismogram at the 3-component station. The back azimuth value is obtained based on Eq. (1).
$\theta=\tan ^{-1} \frac{A_{E W}}{A_{N S}}$ (1)
where:
AEW = amplitude of the west-east component
ANS = amplitude of the north-south component
Meanwhile, the orientation of the hypocenter is carried out by plotting the amplitude of the radial and vertical components. The radial component is obtained by rotating the component (NS-EW) using Eq. (2).
$\left[\begin{array}{l}R \\ T\end{array}\right]=\left[\begin{array}{l}E W \sin \theta+N S \cos \theta \\ E W \cos \theta-N S \sin \theta\end{array}\right]$ (2)
R is the radial component and T is the transverse component.
In general, the observation of volcanic tremor sources uses the classical method. However, this method cannot be used when a hypocentre with absolute travel time inversion is found. That is because we cannot identify the beginnings of body waves. An alternative, the correlation coefficient method, has been used, which has been applied to several volcanoes such as Kihaleua [26], Masaya [27], and Stromboli [28]). Some authors also apply the Semblance method as in Mt. Etna [29], Mt. Aso [30], and Mount Erebus [31]). Here, we only determine the orientation of the epicenter and hypocenter of the volcanic tremor of the Ijen volcano. That is due to the limitations of 3-component seismic stations and only using one, namely the MLLR station. In addition, this station also has the disadvantage of being far from Ijen crater. Therefore, data validation was carried out by comparing the recordings recorded at IJEN and KWUI stations. These two stations display better data because they are close to Ijen Crater. Table 1 shows an analysis of 9 volcanic tremor data for the Ijen volcano. Three of them are single volcanic tremors, and the other 6 are volcanic tremors associated with the VT earthquake.
Figure 4. Determination of the orientation of the volcanic tremor epicenter; (a) seismogram for 3 component stations; (b) particle motion; (c) orientation direction
In general, the observation of volcanic tremor sources uses the classical method. However, this method cannot be used when a hypocentre with absolute travel time inversion is found. That is because we cannot identify the beginnings of body waves. An alternative, the correlation coefficient method, has been used, which has been applied to several volcanoes such as Kihaleua [26], Masaya [27], and Stromboli [28]). Some authors also apply the Semblance method as in Mt. Etna [29], Mt. Aso [30], and Mount Erebus [31]). Here, we only determine the orientation of the epicenter and hypocenter of the volcanic tremor of the Ijen volcano. That is due to the limitations of 3-component seismic stations and only using one, namely the MLLR station. In addition, this station also has the disadvantage of being far from Ijen Crater. Therefore, data validation was carried out by comparing the recordings recorded at IJEN and KWUI stations. These two stations display better data because they are close to Ijen Crater. Table 1 shows an analysis of 9 volcanic tremor data for the Ijen volcano. Three of them are single volcanic tremors, and the other 6 are volcanic tremors associated with the VT earthquake.
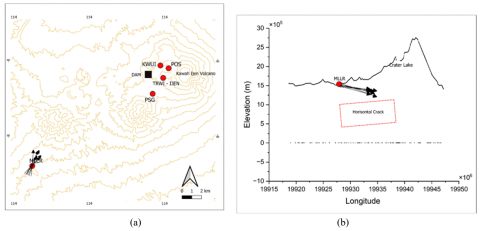
Figure 5 shows the orientation of the epicenter of the volcanic tremor of the Ijen volcano. Based on Figure 5a, it can be seen that the orientation of the volcanic tremor epicenter is towards the northwest of the Ijen crater (black arrow line). The epicenter angle is 130 – 430 to the north-south of the MLLR post. Meanwhile, based on the direction of the arrival angle (Figure 5b), the hypocenter of the volcanic tremor of the Ijen volcano ranges from a depth of 500-1000 meters below the center of the Ijen crater. Although in this paper, the determination of the epicenter and hypocenter is only in the direction of orientation, the results corroborate the results of previous studies. In paper [32] states that there is a horizontal crack at a depth of 0-2000 meters below the center of the crater (red dotted box), which is used as a place for fluid flow to the active crater of the Ijen volcano. Thus, the orientation of the volcanic tremor source's hypocenter is towards this crack's horizontal position.
Table 1. Data distribution of volcanic tremors
|
No |
Date |
Time |
Duration (menit) |
Projection direction |
Epicenter angle |
Arrival angle |
|
1 |
14 Jan. 2014 |
04.20 - 04.45 |
Single |
Ijen crater |
43.47 |
5.99 |
|
2 |
14 Jan. 2014 |
19.00 - 19.30 |
Single |
Ijen crater |
39.83 |
5.23 |
|
3 |
21 Jan. 2014 |
06.30 - 06.50 |
Single |
Ijen crater |
19.25 |
11.5 |
|
4 |
7 Jan. 2014 |
07.52-08.24 |
Assosiated with VT |
Ijen crater |
28.35 |
15.34 |
|
5 |
11 Feb. 2014 |
17.44-17.55 |
Associated with VT |
Ijen crater |
24.34 |
16.38 |
|
6 |
22 Jan. 2014 |
04.50-05.20 |
Associated with VT |
Ijen crater |
25.14 |
19.37 |
|
7 |
24 Jan. 2014 |
03.20-03.40 |
Associated with VT |
Ijen crater |
16.43 |
5.64 |
|
8 |
24 Jan. 2014 |
10.09-10.14 |
Assosiated with VT |
Ijen crater |
13.98 |
10.98 |
|
9 |
28 Jan. 2014 |
04.35-04.54 |
Assosiated with VT |
- |
5.52 |
4.66 |
Figure 5. (a) The direction of the epicenter angle (b) the direction of the inclination angle of volcanic tremor Ijen volcano
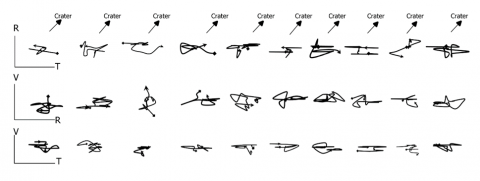
Figure 6. Particle motion of a single volcanic tremor at Ijen volcano (14 Jan. 2014, 4.20-4.35 WIB)
In addition, to determine the epicenter and incident angles, particle motion analysis is carried out to observe the predominant wave types in seismic events. Figure 6 shows the particle motion of a single volcanic tremor by plotting the amplitude of the volcanic tremor between the radial-vertical (T-R) components, the vertical-radial (R-V) components, and the transverse vertical (T-V) components. As seen in Figure 6, the wave that dominates the single volcanic tremor of the Ijen volcano is the S (SH) wave, where the particles' movement dominates the transverse component on the T-R and T-V graphs. Therefore, the direction of movement of these particles tends to predominate in the transverse component so that the S wave type is S horizontal (SH) natural.
3.3 Discussion
Volcanic tremors are one of the seismic activities of the Ijen volcano, which are usually recorded at the Ijen volcano, the same as at other volcanoes [33-36]. Volcanic tremors are often found before, during, and after the eruption of a volcano [37]. It is also found in the Ijen volcano. Under normal conditions, volcanic tremors are not much recorded in the seismic activity of the Ijen volcano. However, a large number of volcanic tremors will be recorded under certain conditions. In these conditions, the volcano's status will usually be increased from average to alert or even alert. In the case that occurred in 2012, the Ijen volcano was declared critical with an alert status due to increased seismic activity. One of them is volcanic tremors, recorded in large numbers or not the same as usual. For example, an increase in seismic activity is accompanied by changes in the temperature and volume of the crater lake. However, in 2012 this critical condition was not accompanied by a phreatic eruption. However, the appearance of an unusual volcanic tremor must be watched out for and understood for the Ijen volcano disaster mitigation process.
Several models have been widely used regarding volcanic tremors to explain the source mechanism of various volcanoes. The source model for tremor events is usually related to the movement of fluids in the conduit. For example, paper [38] describes the mechanism of the volcanic vibration source of Kilaluea volcano by using fluid recharge resonance. Meanwhile, Konstantinou et al. [21] describes the mechanism of the source of the volcanic tremor of Semeru volcano using a fluid flow-induced oscillation model of the magmatic fluid conduit. Then the proposed conceptual model [39] explains the mechanism of volcanic tremor sources for the Kusatsu-Shirane volcano (Japan), having the same hydrothermal area as the Ijen volcano. The model explains that the Low frequency (LF) event, in the context of the Ijen volcano, is a low-frequency volcanic tremor caused by resonance due to the collapse of the fluid-fill crack in the conduit system. This model involves boiling groundwater by raising magmatic gases, generating steam, and increasing the overall pressure of the hydrothermal fluid in the fracture network distribution. The sudden release of vapors (or, more commonly, liquids) and the collapse of these hydrothermal fractures give rise to impulsive excitation and resonance. On the other hand, Jufriadi et al. [40] also discussed the triggering mechanism for LF seismicity. Here the thermodynamic changes are studied mainly in pressurized hydrothermal fractures heated by magmatic sources. They proposed that more energetic phase changes could result in LF events.
However, in visual observation, when it is declared critical, it shows that the activity on the surface of the crater lake of the Ijen volcano shows a continuous increase in bubbles. At the same time, the seismometer recorded many volcanic tremors, and the temperature gauge showed a sharp increase in temperature in the Ijen crater lake. This condition makes the model proposed by Metoza and Chouet [39] unsuitable for the Ijen volcano. Continuous rising of the bubbles indicates the contribution of higher levels of liquid, vapor, and gas into the lake system, which can trigger resonances within the fluid-filled fissures or underlying rift networks. In this case, the most likely model is resonance in the fluid fill crack.
Another finding is the orientation of the source of the volcanic tremor under the center of the Ijen crater. In other words, it is in a horizontal crack position below the center of the Ijen crater. Figure 5b shows the horizontal crack resulting from the expansion in 2012, which is located about 500 meters below the horizontal crack [32, 41, 42]. These results strengthen the hypothesis that the source mechanism of the volcanic tremor is caused by resonance in the fluid fill crack. In addition, the value of the fractal dimension of volcanic tremor also strengthens the suspicion that the mechanism of volcanic tremor is caused by fluid fill crack resonance.
Furthermore, the fractal dimension of volcanic tremors at the Ijen volcano has a value of more than 2 for all types of volcanic tremors at the Ijen volcano (Figure 7). In paper of Aminzadeh et al. [43], fractal dimension values close to 1 are associated with clustered fractures in denser areas. When seismic waves pass through a dense medium, they increase their speed. As a result, it reduces the energy during the propagation process in the medium, thereby reducing the value of its fractal dimension. In contrast, faults will dominate the rock when the fractal dimension value exceeds 2. That makes it easier for fluids to enter. Thus, fluids tend to have less densely spaced particles. These conditions require a longer time to transfer energy so that it can move further during the wave propagation process. According to paper of Di Lieto et al. [44], if the speed is slow, then the value of the fractal dimension becomes larger. Figure 7 shows the temporal changes in the frequency and fractal dimension values for volcanic tremors recorded in 2014. The figure shows no significant changes. That is, there is no significant change in pressure and geometry at the source. When a change occurs temporally in the fractal dimension value, the event is related to a change in pressure at the source in the conduit pipe. This case is the same as that at Etna volcano.
Figure 7. The temporal changes in the values of the frequency and dimensions of the fractal tremor of the Ijen volcano
1. The volcanic tremor at Ijen volcano declared critical and on alert in 2012, is a rare phenomenon and is not found in other volcanoes.
2. The investigation results prove a discrepancy between the concept of the Ijen volcano LF model and other volcanoes.
3. Low-frequency volcanic tremors are caused by resonance due to the collapse of fluid-fill cracks in the conduit system.
4. Continuous rising of the bubbles indicates the contribution of higher levels of liquid, vapor, and gas into the lake system, which can trigger resonances within the fluid-filled fissures or underlying rift networks.
5. The most probable model and mechanism for the source of volcanic tremor in the Ijen volcano is caused by resonance in the fluid filling the crack. This is obtained based on data analysis from two different stations. The IJEN station uses a short-period sensor which only has a vertical component, while the MLLR and TRWI stations use a sensor that records three components.
6. Based on particle motion analysis of seismic data from 3 component stations, it can be seen that the orientation of the single volcanic epicenter of Mount Ijen is towards the area under the crater Mount Ijen. In contrast, the direction of the orientation of the hypocenter was found to be under Ijen Crater.
7. In addition, this study only determines the orientation of the epicenter and hypocenter of the volcanic tremor of the Ijen volcano due to the limitations of the 3-component seismic station. The MLLR station is located far from the crater, so data validation from 2 different stations is required.
We thank the Center for Volcanology and Geological Hazard Mitigation (CVGHM) for allowing the use of seismic data recorded on Ijen volcano.
|
CVGDM |
center for volcanology and geological hazard mitigation |
|
SH |
horizontal S wave |
|
MLE |
maximal lyapunov exponent |
|
STA |
short-time average |
|
LTA |
long-time average |
|
ANS |
amplitude of the north-south |
|
AEW |
amplitude of west-east |
[1] Caudron, C., Syahbana, D.K., Lecocq, T., Van Hinsberg, V., McCausland, W., Triantafyllou, A., Camelbeeck, T., Bernard, A., Surono. (2015). Kawah Ijen volcanic activity: A review. Bulletin of Volcanology, 77: 1-39. https://doi.org/10.1007/s00445-014-0885-8
[2] Zobin, V.M. (2011). Introduction to Volcanic Seismology (Vol. 6). Elsevier.
[3] Lesage, G., Bussey, H. (2006). Cell wall assembly in Saccharomyces cerevisiae. Microbiology and Molecular Biology Reviews, 70(2): 317-343. https://doi.org/10.1128/MMBR.00038-05
[4] Johnson, J.B., Lees, J.M. (2000). Plugs and chugs—seismic and acoustic observations of degassing explosions at Karymsky, Russia and Sangay, Ecuador. Journal of Volcanology and Geothermal Research, 101(1-2): 67-82. https://doi.org/10.1016/S0377-0273(00)00164-5
[5] Schlindwein, V., Wassermann, J., Scherbaum, F. (1995). Spectral analysis of harmonic tremor signals at Mt. Semeru volcano, Indonesia. Geophysical Research Letters, 22(13): 1685-1688. https://doi.org/10.1029/95GL01433
[6] Andinisari, R., Maryanto, S., Nadhir, A. (2013). Preliminary study on the determination of volcanic tremor epicenter using semblance method (Case study of Sakurajima Volcano). Natural B, Journal of Health and Environmental Sciences, 2(2): 172-177. http://dx.doi.org/10.21776/ub.natural-b.2013.002.02.12
[7] Maryanto, S., Santosa, D.R., Mulyana, I., Hendrasto, M. (2011). Fractal and chaos properties of explosion earthquakes followed by harmonic tremor at Semeru Volcano, East Java, Indonesia. International Journal of Scientific & Engineering Research, 2(7): 1-7.
[8] Wildani, A., Maryanto, S., Susilo, A. (2015). Seismic signal analysis of harmonic tremor and spasmodic tremor of Semeru volcano, East Java–Indonesia. Wacana Didaktika, 3(2): 140-150. (In Indonesia).
[9] Konstantinou, K.I., Schlindwein, V. (2003). Nature, wavefield properties and source mechanism of volcanic tremor: A review. Journal of Volcanology and Geothermal Research, 119(1-4): 161-187. https://doi.org/10.1016/S0377-0273(02)00311-6
[10] McNutt, S.R. (2002). Volcanic tremor and its use in estimating eruption parameters. In AGU Fall Meeting Abstracts, 2002: V22C-05.
[11] Gestrich, J.E., Fee, D., Tsai, V.C., Haney, M.M., Van Eaton, A.R. (2020). A physical model for volcanic eruption tremor. Journal of Geophysical Research: Solid Earth, 125(10): e2019JB018980. https://doi.org/10.1029/2019JB018980
[12] Tárraga, M., Martí, J., Abella, R., Carniel, R., López, C. (2014). Volcanic tremors: Good indicators of change in plumbing systems during volcanic eruptions. Journal of Volcanology and Geothermal Research, 273: 33-40. https://doi.org/10.1016/j.jvolgeores.2014.01.003
[13] McNutt, S.R., Nishimura, T. (2008). Volcanic tremor during eruptions: temporal characteristics, scaling and constraints on conduit size and processes. Journal of Volcanology and Geothermal Research, 178(1): 10-18. https://doi.org/10.1016/j.jvolgeores.2008.03.010
[14] Wildani, A., Umamah, C., Budiyono, A. (2018). Identification of the dynamics of the volcanic tremor source of Raung volcano based on fractal analysis. Jurnal Pendidikan Fisika dan Keilmuan (JPFK), 4(1): 23-29. (In Indonesia).
[15] Kawakatsu, H., Kaneshima, S., Matsubayashi, H., Ohminato, T., Sudo, Y., Tsutsui, T., Uhira, K., Yamasato, H., Ito, H., Legrand, D. (2000). Aso94: Aso seismic observation with broadband instruments. Journal of Volcanology and Geothermal Research, 101(1-2): 129-154. https://doi.org/10.1016/S0377-0273(00)00166-9
[16] Takagi, N., Kaneshima, S., Kawakatsu, H., Yamamoto, M., Sudo, Y., Ohkura, T., Yoshikawa, S., Mori, T. (2006). Apparent migration of tremor source synchronized with the change in the tremor amplitude observed at Aso volcano, Japan. Journal of Volcanology and Geothermal Research, 154(3-4): 181-200. https://doi.org/10.1016/j.jvolgeores.2006.02.001
[17] Ichimura, M., Yokoo, A., Kagiyama, T., Yoshikawa, S., Inoue, H. (2018). Temporal variation in source location of continuous tremors before ash–gas emissions in January 2014 at Aso volcano, Japan. Earth, Planets and Space, 70: 1-15. https://doi.org/10.1186/s40623-018-0895-4
[18] Fee, D., Garcés, M., Patrick, M., Chouet, B., Dawson, P., Swanson, D. (2010). Infrasonic harmonic tremor and degassing bursts from Halema'uma'u Crater, Kilauea Volcano, Hawaii. Journal of Geophysical Research: Solid Earth, 115(B11). https://doi.org/10.1029/2010JB007642
[19] Maryanto, S., Mulyana, I. (2008). Temporal change of fractal dimension of explosion earthquakes and harmonic tremors at Semeru Volcano, East Java, Indonesia, using critical exponent method. International Journal of Geological and Environmental Engineering, 2(6): 47-51.
[20] Maryanto, S., Santosa, D.R., Mulyana, I., Hendrasto, M. (2010). Preliminary chaos analyses of explosion earthquakes followed by harmonic tremors at Semeru volcano, East Java, Indonesia. International Journal of Geological and Environmental Engineering, 4(11): 612-617. https://doi.org/10.5281/zenodo.1072475
[21] Konstantinou, K.I., Perwita, C.A., Maryanto, S., Budianto, A., Hendrasto, M. (2013). Maximal Lyapunov exponent variations of volcanic tremor recorded during explosive and effusive activity at Mt Semeru volcano, Indonesia. Nonlinear Processes in Geophysics, 20(6): 1137-1145. https://doi.org/10.5194/npg-20-1137-2013
[22] Caudron, C., Lecocq, T., Syahbana, D.K., McCausland, W., Watlet, A., Camelbeeck, T., Bernard, A. (2015). Stress and mass changes at a “wet” volcano: Example during the 2011–2012 volcanic unrest at Kawah Ijen volcano (Indonesia). Journal of Geophysical Research: Solid Earth, 120(7): 5117-5134. https://doi.org/10.1002/2014JB011590
[23] Allen, R.V. (1978). Automatic earthquake recognition and timing from single traces. Bulletin of the Seismological Society of America, 68(5): 1521-1532. https://doi.org/10.1785/BSSA0680051521
[24] Saragiotis, C.D., Hadjileontiadis, L.J., Panas, S.M. (2002). PAI-S/K: A robust automatic seismic P phase arrival identification scheme. IEEE Transactions on Geoscience and Remote Sensing, 40(6): 1395-1404. https://doi.org/10.1109/TGRS.2002.800438
[25] Montalbetti, J.F., Kanasewich, E.R. (1970). Enhancement of teleseismic body phases with a polarization filter. Geophysical Journal International, 21(2): 119-129. https://doi.org/10.1111/j.1365-246X.1970.tb01771.x
[26] Métaxian, J.P., Lesage, P., Dorel, J. (1997). Permanent tremor of Masaya Volcano, Nicaragua: Wave field analysis and source location. Journal of Geophysical Research: Solid Earth, 102(B10): 22529-22545. https://doi.org/10.1029/97JB01141
[27] Chouet, B. (1988). Resonance of a fluid‐driven crack: Radiation properties and implications for the source of long‐period events and harmonic tremor. Journal of Geophysical Research: Solid Earth, 93(B5): 4375-4400. https://doi.org/10.1029/JB093iB05p04375
[28] Seidl, D., Schick, R., Riuscetti, M. (1981). Volcanic tremors at Etna: A model for hydraulic origin. Bulletin volcanologique, 44(1): 43-56. https://doi.org/10.1007/BF02598188
[29] Kawakatsu, H., Ohminato, T., Ito, H. (1994). 10s‐period volcanic tremors observed over a wide area in southwestern Japan. Geophysical Research Letters, 21(18): 1963-1966. https://doi.org/10.1029/94GL01683
[30] Rowe, C., Aster, R., Kyle, P., Dibble, R., Schlue, J. (2000). Seismic and acoustic observations at Mount Erebus volcano, Ross Island, Antarctica, 1994–1998. Journal of Volcanology and Geothermal Research, 101(1-2): 105-128. https://doi.org/10.1016/S0377-0273(00)00170-0
[31] Syahra, V., Maryanto, S., Triastuty, H. (2015). Spatial and temporal changes in characteristics of volcanic A and volcanic B earthquakes of Ijen volcano, East Java. Brawijaya University. (In Indonesia).
[32] Fehler, M. (1983). Observations of volcanic tremor at Mount St. Helens volcano. Journal of Geophysical Research: Solid Earth, 88(B4): 3476-3484. https://doi.org/10.1029/JB088iB04p03476
[33] Fee, D., Haney, M.M., Matoza, R.S., Van Eaton, A.R., Cervelli, P., Schneider, D.J., Iezzi, A.M. (2017). Volcanic tremor and plume height hysteresis from Pavlof Volcano, Alaska. Science, 355(6320): 45-48. https://doi.org/10.1126/science.aah6108
[34] Thompson, G., McNutt, S.R., Tytgat, G. (2002). Three distinct regimes of volcanic tremor associated with the eruption of Shishaldin Volcano, Alaska 1999. Bulletin of Volcanology, 64(8): 535-547. https://doi.org/10.1007/s00445-002-0228-z
[35] Chardot, L., Jolly, A.D., Kennedy, B.M., Fournier, N., Sherburn, S. (2015). Using volcanic tremor for eruption forecasting at White Island volcano (Whakaari), New Zealand. Journal of Volcanology and Geothermal Research, 302: 11-23. https://doi.org/10.1016/j.jvolgeores.2015.06.001
[36] Salerno, G.G., Burton, M., Di Grazia, G., Caltabiano, T., Oppenheimer, C. (2018). Coupling between magmatic degassing and volcanic tremor in basaltic volcanism. Frontiers in Earth Science, 6: 157. https://doi.org/10.3389/feart.2018.00157
[37] Ferrazzini, V., Aki, K., Chouet, B. (1991). Characteristics of seismic waves composing Hawaiian volcanic tremor and gas‐piston events observed by a near‐source array. Journal of Geophysical Research: Solid Earth, 96(B4): 6199-6209. https://doi.org/10.1029/90JB02781
[38] Nakano, M., Kumagai, H., Chouet, B.A. (2003). Source mechanism of long-period events at Kusatsu–Shirane Volcano, Japan, inferred from waveform inversion of the effective excitation functions. Journal of Volcanology and Geothermal Research, 122(3-4): 149-164. https://doi.org/10.1016/S0377-0273(02)00499-7
[39] Metoza, R.S., Chouet, B.A. (2010). Subevents of long-period seismicity: Implications for hydrothermal dynamics during the 2004-2008 eruption of Mount St. Helens. Journal of Geophysical Research, 115(B12). https://doi.org/10.1029/2010JB007839
[40] Jufriadi, A., Maryanto, M., Susilo, A., Purwanto, B.H., Hendrasto, M. (2013). Analysis of seismic signals to know the internal processes of Mount Ijen, East Java. Jurnal Neutrino: Jurnal Fisika dan Aplikasinya, 22-30. (In Indonesia).
[41] Ayu, H.D., Jufriadi, A. (2014). The Eruption mechanism and model of the Ijen volcano magma Pocket. Jurnal Neutrino: Jurnal Fisika dan Aplikasinya. (In Indonesia).
[42] Watanabe, K., Takahashi, H. (1995). Fractal geometry characterization of geothermal reservoir fracture networks. Journal of Geophysical Research: Solid Earth, 100(B1): 521-528. https://doi.org/10.1029/94JB02167
[43] Aminzadeh, F., Sammis, C. Sahimi, M., Okaya, D. (2015). Characterizing fractures in Geysers geothermal field by micro-seismic data, using soft computing, fractals, and shear wave anisotropy. Univ. of Southern California, Los Angeles, CA (United States). https://doi.org/10.2172/1185274
[44] Di Lieto, B., Saccorotti, G., Zuccarello, L., Rocca, M.L., Scarpa, R. (2007). Continuous tracking of volcanic tremor at Mount Etna, Italy. Geophysical Journal International, 169(2): 699-705. https://doi.org/10.1111/j.1365-246X.2007.03316.x