Wahyu Haryadi Piarah | Zuryati Djafar* | Ahmad Salman Rosali | Abdul Halim | Mustofa | Bagus Hayatul Jihad
© 2022 IIETA. This article is published by IIETA and is licensed under the CC BY 4.0 license (http://creativecommons.org/licenses/by/4.0/).
OPEN ACCESS
Increasing the ability to harvest thermal energy on the hot-side of the thermoelectric generator (TEG) module is a challenge for researchers to increase the electrical conductivity of the module. This study aims to increase the absorption of solar heat on the TEG module by adding carbon and copper layers with the electroforming method. The ultimate goal is to increase the electrical energy generated by TEG. The process of adding carbon by painting, while the copper layer by dyeing. The voltage during immersion varied from 2.5, 3, and 3.5 Volt with copper plating durations of 30, 45, and 60 minutes. The results show an increasing trend of solar thermal absorption during testing under the hot sun. The longer it is immersed in the copper layer, the greater the output power of the TEG module. The safe immersion of the module for 45 minutes in Cu solution brought the best positive effect. As a comparison, the output power produced by the TEG module without copper coating is only about 0.000025 Watt for a light intensity of 881.67 Watt/m2. After coating, the power generated was increased by 25.1 times at the same intensity. Measurements of temperature and power generated are measured by applying the LabVIEW software application from National Instrument.
hot-side, TEG, copper coating, electroforming
The demand for energy around the world is increasing rapidly due to the growth of industrialization and urbanization. Due to this increase in energy demand, economic policy must change from conventional mechanisms to energy-saving machines or in the form of energy recovery or using green energy technology [1-4]. For energy recovery, example, the smoke or flue gas coming out of the chimney can be used for heat energy by a thermoelectric generator (TEG) to produce electrical energy, thereby increasing system efficiency. TEG is a simple module that has 2 different sides, a hot-side and a cold side. The hot-side that gets heat or thermal energy from the outside causes a temperature difference on both sides, resulting in an electric voltage at the positive and negative poles of the semiconductor module circuit. This voltage difference indicates that there is an electric current (Seebeck effect) flowing. The regulation of heat energy for the needs of TEG and photons for PV has been well simulated in research [5] using a light spectrum separator called a hot mirror and research [6] which compares hot and cold mirrors with the help of the LabVIEW simulator. Unfortunately, the simulation results show that the temperature difference on both sides of the TEG is very small, so the output power of the module is still low. The same was done in experiments [7, 8] which placed the TEG modules in series and stacked which received heat radiation from sunlight or light bulbs. The output power is also still low even though a copper plate absorber is installed above the hot-side of the TEG. One of the reasons is because the copper plate with the hot surface of the TEG does not blend perfectly, so there is a heat loss between the TEG and the plate. As a result, the thermal absorber power of TEG is still low. Another interesting research is the placing of TEG modules in series and parallel on the lower surface of the PV [9]. The heat received by TEG relies on conduction heat transfer from the top surface of the PV, without modification of the hot side of the module.
So in TEG research, the problem lies in the temperature difference between the two sides of the TEG which is still low, so the figure of merit (ZT) is also relatively small. The dimensionless figure of merit (ZT) is used to express the performance of TE materials, and is expressed as where and are the Seebeck coefficient, electrical conductivity, the absolute temperature, and total thermal conductivity, respectively [10, 11]. To improve the performance of TEG materials either the power factor of the material has to be increased or the thermal conductivity has to be decreased using various methods. The method that can be done is using TEG material from oxide perovskites (ATiO3), carbon nanotubes, graphene [12, 13]. Unfortunately, oxide perovskites have high thermal conductivity and low electrical conductivity, so they need to be doped or hybridized with other elements such as alkaline earth metals, Sr, and become SrTiO3 [14] specifically carried out simulations aimed at lowering the thermal conductivity value of TEG with the so-called phonon technique on semiconductor nanostructures. Another technique to increase the temperature difference between the cold side and the hot-side of the TEG is to maintain the temperature of the cold side of the TEG using a heat pipe [15], so that the temperature difference between the two sides increases with the thermal reception on the hot-side [16].
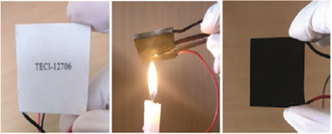
Several studies aimed at increasing the absorption of TEG thermal energy by treating the electrical conductivity improvement on p and n type TEG materials were carried out [17-20]. This means that it is necessary to modify the TEG module material to produce a better TEG module electrical conductivity [21]. Another method that also aims to improve the ZT TEG module is by using certain treatments on the top surface of the module which is more practical. This aims to increase heat absorption on the hot-side of TEG [22]. This method is better known as electroplating or electroforming. Utaminingrat and Eskani [23] conducted a quite unique study by adding a carbon layer (coated carbon) to the TEG module by exposure to the heat of a candle flame until it turned black (Figure 1). This was carried out on several modules with variations in carbon layer thickness from 3, 3.5, 4.5 and 6 μm which were pressed using a special camera. After that just tested under the hot sun. In the test, the exposure to sunlight is set in such a way as to focus the light using a Fresnel lens. To maintain the temperature difference in the TEG module, a circulating water block is used in the aluminum block. The test results show that there is an increase in TEG output power six times greater than without wax heat treatment. From this test, it is not reported what the surface temperature of TEG is at each thickness of the carbon after heating the candle flame.
Figure 1. Candle-soot Method Coating system [22]
In a slightly similar way to studies [22, 23], in this study, the hot-side of the TEG module was painted with conductive carbon graphite. After that, the electroforming process was continued by adding a layer of copper to the immersion process in copper solution.
2.1 Electroforming process on the TEG module
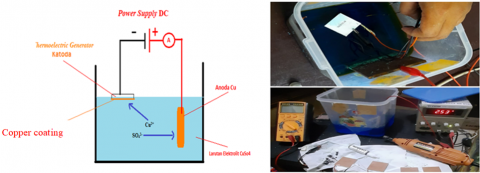
The electroforming method adopted in this study was inspired by research conducted by Utamaningrat and Eskani [23] using copper coatings on metal ceramic items. The stages begin with sample preparation and pretreatment of the TEG module. The module is cleaned of impurities, such as dust and oil. Then it is marked for further weighing which aims to determine the initial mass (W1) of the module. The second stage, the module is coated with a conductive paint made of graphite (carbon) and re-weighed to measure the change in the mass of the sample (W2), The obtained weight gain is used to calculate the obtained layer thickness. As a final step, the module is again coated with copper metal using the electroforming method. The test parameters are three variations of input voltage and three variations of copper plating duration. The voltage variations given are 2.5V, 3.0V, and 3.5V with variations in the duration of the immersion process for 1800 seconds (30 minutes), 2700 seconds (45 minutes), and 3600 seconds (60 minutes). The process of dyeing the module with a copper layer is shown in Figure 2.
Figure 2. Electroforming process on the TEG modules
The module that has been removed from the electroforming container is rinsed using distilled water to clean the sample from the electrolyte solution. The weighing of the module is carried out again to determine the mass of the copper layer formed. After being coated with copper, the thermal resistance of TEG was measured using a digital multimeter and then tested under the hot sun, with a module tilt of 10° to the horizontal plane.
2.2 Data collection process
After the electroforming process, nine (9) variations of the types of TEG modules were obtained that received the electroforming coating, and each type contained four TEG modules. As a comparison, one type of TEG module was also prepared which was not given an electroforming (No Coating/NC) coating. So the test samples can be described as follows: code numbers 1, 2 and 3 are electroforming for 2.5V input voltage with three variations of immersion duration 1800 seconds/30 minutes, 2700 seconds/45 minutes, 3600 seconds/60 minutes; for code numbers 4, 5 and 6 are electroforming for 3.0V input voltage with three variations of immersion duration 1800 seconds/30 minutes, 2700 seconds/45 minutes, 3600 seconds/60 minutes; and for code numbers 7, 8 and 9 are electroforming for 3.5V input voltage with three variations of immersion duration 1800 seconds/30 minutes, 2700 seconds/45 minutes, 3600 seconds/60 minutes. For the test sample No Coating (NC) where NC1 as a comparison against the module which is electroformed the input voltage is 2.5V; NC2 for 3.0V; and NC3 for 3.5V.
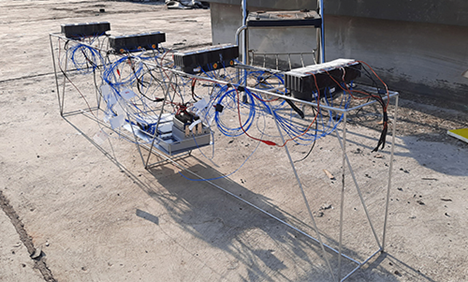
Figure 3. Observation of the TEG module in the sun with the measuring tool LabVIEW application
Figure 4. The electrical connection diagram of TEG modules for data acquisition experiment
In data collection, the four modules are assembled in series and placed on the base surface of the heatsinks as shown in Figure 3. Schematically, the series circuit of the thermoelectric generator module can be seen in Figure 4.
All test parameters to be measured such as temperature, current and voltage of the module are connected to a laptop using the LabVIEW software application from National Instrument.
In analyzing the performance of the TEG module, the Seebeck coefficient which describes the voltage (electromotive force) arising due to the temperature difference becomes very important. Seebeck coefficient can be expressed by the following equation [24].
$\propto$$=\frac{\Delta V}{\left(T_h-T_c\right)}$ (1)
where, ∆V is Voltage Difference; is the Seebeck Coefficient between two Semiconductor Materials; Th is Module Hot-side Temperature (℃); Tc is Module Cold Side Temperature (℃). And the resulting electric current uses the following equation:
$I=\frac{\propto \Delta T}{R_i+R_L}=\frac{\propto\left(T_h-T_c\right)}{R_i+R_L}$ (2)
where, I is the Electric Current in the Circuit (Amperes); Ri is the Internal Resistance of the Thermoelectric Generator Module (Ω); RL is External Resistance (Ω); and Temperature Difference ∆T=Th-Tc.
The rate of heat transfer (Qh) from the heat source on the hot-side surface (Th) to the cold side surface (Tc) is:
$Q_h=\left(\propto I T_h\right)+k\left(T_h-T_c\right) \times A$ (3)
where, k is the thermal conductivity of the module which is 0.9977 (W/m℃). The cross-sectional area (A) is the surface area of the TEG module which is directly exposed to the sun's heat, which is the area of the hot-side multiplied by 4, because in this study the TEG modules are connected in series.
2.3 Output power (P) generated and efficiency ($\eta$) TEG modules
$P=I V$ (4)
$\eta=\frac{P}{Q_h} \times 100 \%$ (5)
3.1 Intensity of solar (I) and output Voltage (V) for 2.5V electroforming immersion
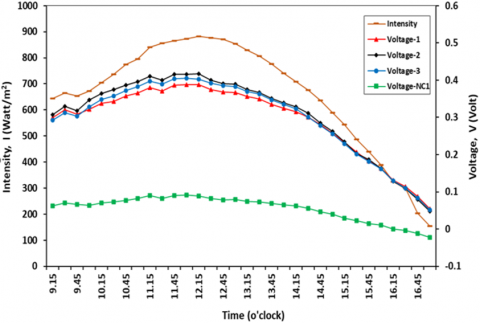
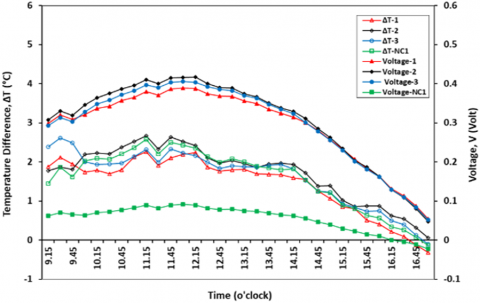
Figure 5 shows the effect of the immersion duration of the TEG module on the electroforming voltage of 2.5 Volt. The focus of observation is the change in module voltage as the intensity of solar light increases. The intensity of light reaches a peak at 898.67 Watt/m the average temperature at 12.00-12.15 is 898.67 Watt/m2 and produces the highest voltage of 0.428 Volt for variations of immersion for 45 minutes (2700 seconds) while for immersion for 30 minutes the voltage is obtained at 0.35 Volt, for 60 minutes of immersion a voltage of 0.412 Volt is obtained and for variations no coating it produces a voltage of 0.0966 Volt.
Figure 5. History of I & V for 2.5V electroforming immersion to Time observation
3.2 Temperature difference (ΔT) of two sides and output voltage (V) of the TEG modules
Figure 6 shows the difference in temperature on the hot-side and cold side of TEG which increases with the increase in the intensity of the sun and decreases again towards the afternoon. Similarly, what happened to the module's ability to absorb heat in Figure 7. Air velocity also affects changes in module temperature.
Figure 6. History of ΔT & V for 2.5V electroforming to time observation
3.3 Hot-side Temperature (Th) and heat absorption (Qh) of the TEG modules
Figure 7. History of Th & Qh to Time observation
3.4 Power (P) and efficiency (ƞ) of the TEG module
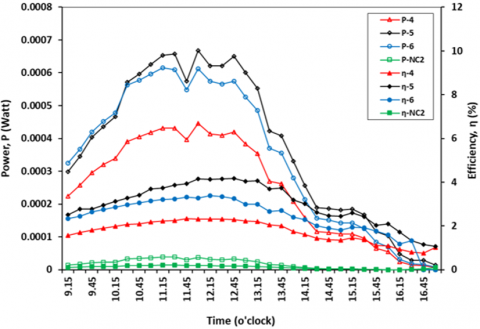
Figure 8 shows a comparison of the power of each variation. The data was taken based on the intensity of the sun of 881.67 Watt/m2. Coating has a significant impact on the increase in power generated. Power-1 produces 18.76 times greater power than the variation without coating, while power-2 produces 21.58 times greater power than the variation without coating. The power-3 produces 20.05 times greater power than the variation without coating. Based on the overall results, the largest power was produced by power-2 in immersion for 45 minutes, then variation 3 (60 minutes) and variation 1 (30 minutes). Therefore, at the same coating thickness, the immersion time has a significant effect on the electrical energy produced.
Figure 8. History of P & ƞ to time observation
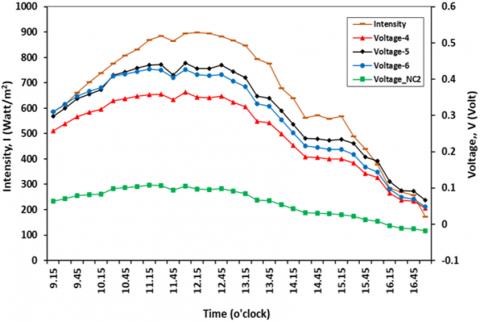
3.5 Intensity of solar (I) and output voltage (V) for electroforming 3.0v immersion voltage
The thermoelectric generator (TEG) module was coated with the electroforming method with an immersion voltage of 3 Volt for 30, 45 and 60 minutes. The results will be compared with the uncoated TEG module (NC) (Figure 9). It can be seen that the maximum voltage of 0.417 Volt module is obtained at a time of immersion for 45 minutes with a solar intensity of 898.67 Watt/m2 in the hours of observation between 12.00 to 12.15. The module voltage is very low without immersion (plain voltage) of the module in the copper (Cu) layer.
Figure 9. History of I & V for 3.0V electroforming to time
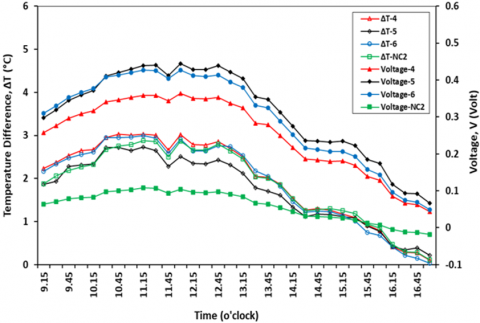
3.6 Temperature difference (ΔT) and output voltage (V) of two sides of TEG module
Figure 10 shows T and voltage VS Time. Based on the figure, it is found that the temperature difference is fluctuating. This is caused by natural factors, namely the wind speed that hits the thermoelectric module and the thermocouple which is not fixed, causing the temperature reading to be less than optimal. But overall, the temperature difference increases when the sun is hot and decreases as the sun goes down. This has an impact on the average voltage that arises. The higher and hotter the position of the sun, the greater the voltage that arises. Vice versa.
Figure 10. History ΔT & V to time
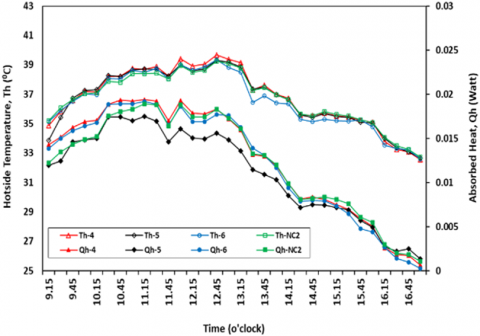
3.7 Hot-side Temperature (Th) and heat absorption (Qh) of the TEG modules
Meanwhile, Figure 11 shows the temperature on the hot-side and the heat absorbed by the TEG module. It can be seen that the higher the position of the sun, the overall temperature of the hot-side increases. Meanwhile, the heat absorbed by the object is fluctuating from 09.00 to 17.00 hours. This is due to unavoidable natural factors such as wind hitting the TEG module and the temperature sensor on the hot-side of the TEG which causes fluctuations. But overall still follow the intensity of the sun where if the sun is getting hotter, the heat absorbed is getting bigger. And vice versa, as the sun goes down, the heat absorbed decreases.
Figure 11. History of Th & Qh to time
3.8 Power (P) and efficiency (ƞ) of the TEG module
In Figure 12 is a comparison between the power and efficiency of the thermoelectric generator module. From the figure, it can be seen that the power generated is also directly proportional to the voltage generated by the thermoelectric module. So the power depends on the intensity of sunlight on the TEG module. Meanwhile, efficiency also still depends on the power generated, so that the efficiency is proportional to the power of the TEG module.
Figure 12. P & ƞ to time
3.9 Intensity of solar (I) and output voltage (V) for 3.5V electroforming immersion
The Figure 13 shows the characteristics of the TEG module which was coated with the electroforming method at 3.5 volt immersion with the same variation of immersion time with 2.5 and 3.0 volt of immersion voltage and without Cu coating.
Data collection starts at 09.00-17.00 local time. It can be seen based on the picture above that the intensity of light greatly determines the stress that arises because the higher the intensity of sunlight, the higher the surface temperature that hits the hot-side of the TEG, so that the voltage rises. The intensity of light reaches its peak at the average temperature at 11.00-11.15. which is 935 Watt/m2 and the highest voltage is 0.464 Volt for variations of immersion for 45 minutes (2700 seconds) while for 30 minutes of immersion a voltage of 0.35 Volt arises, for 60 minutes of immersion there is a voltage of 0.412 Volt and for variations without coating it produces voltage of 0.0966 Volt. Based on the graph below, it can be seen that the coating is very influential on the stress that arises.
Figure 13. History of I & V for 3.0V electroforming to time
3.10 Temperature difference (ΔT) and output Voltage (V) of two sides of TEG module
Figure 14. ΔT & V to time
The Figure 14 shows a fluctuating temperature difference. This is caused by natural factors, namely the wind speed that hits the TEG module is not fixed so that it hits the hot-side of the TEG and also the thermocouple so that the temperature measurement readings on the hot-side are less than optimal. But overall, the temperature difference increases when the sun is hot and decreases as the sun goes down. This has an impact on the magnitude of the voltage that occurs.
3.11 Hot-side temperature (Th) and heat absorption (Qh) of the TEG modules
The Figure 15 shows the temperature on the hot-side and the heat absorbed by the TEG module. It can be seen that the higher the position of the sun, the overall temperature of the hot-side increases. Meanwhile, the heat absorbed by the object is fluctuating from 09.00 to 17.00 hours. This is due to unavoidable natural factors such as wind hitting the TEG module and temperature sensor readings on the hot-side of the TEG which cause fluctuations. But overall, still follow the intensity of the sun where if the sun is getting hotter, the heat absorbed is getting bigger. Vice versa, as the sun goes down, the heat absorbed decreases.
Figure 15. History of Th & Qh to time
3.12 The power (P) and efficiency (ƞ) of the TEG module
The Figure 16 shows the power and efficiency of the TEG. Based on the graph, the resulting power still follows the resulting voltage. So that the power generated is also proportional to the intensity of the sun hitting the TEG. It is also proportional to the efficiency of the module because the efficiency depends on the power generated by the TEG module.
Figure 16. History of P & ƞ to time
3.13 Output voltage of copper-coated TEG module for any variation of immersion voltage
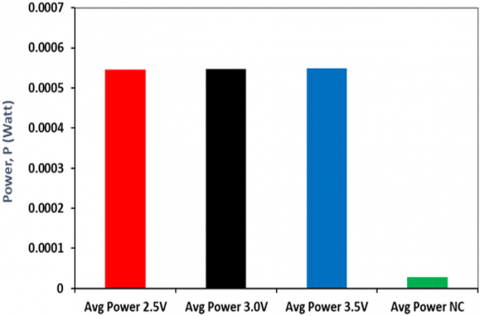
Figure 17. The ratio of the output power of the TEG module to the variation of the Cu solution immersion voltage
Figure 17 illustrates the output power of the TEG module which is immersed in voltages of 2.5V, 3.0V and 3.5V and without copper plating. The result is almost the same output power at various immersion voltages, whose values are 19.16, 19.22 and 19.27 times greater than without Cu coating and immersion at 2.5, 3.0 and 3.5 Volt immersion voltages, respectively. This figure indicates that the difference in immersion voltage does not have much effect on the energy generated by the TEG module, except when compared to the module without coating and immersion, the energy produced is very significant.
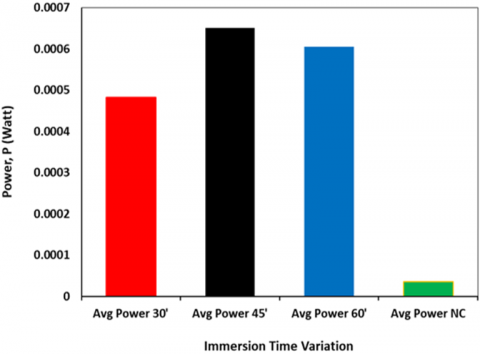
The duration of immersion in Cu solution gives a quite different effect of increasing the output power of the TEG module. In the Figure 18, this can be seen between the immersion time of 30, 45 and 60 minutes, where the immersion time of 45 minutes resulted in an 18.16 times greater percentage increase in the power output of the TEG module when compared to the module without coating. That is, immersion for 45 minutes shows the best TEG electrical energy output symptoms. The results of this study are in line with the objectives of the studies conducted in research [17, 25] which added a layer on the hot-side of the TEG module as a thermal energy absorber.
Figure 18. Comparison of the average power of each time variation
Coating on the TEG module gives a significant increase in voltage effect and has an impact on increasing the power and efficiency of the TEG module. This is because the copper coating can be a good heat collector of solar radiation. Coating on immersion with a voltage of 3.0 Volt is able to increase the largest output power compared to the voltage of 2.5 Volt and 3.5 Volt. This indicates that at a certain immersion voltage with a copper layer, it will provide the best solar energy harvesting capability. The duration of immersion in Cu solution at a certain time has a significant impact on increasing the electrical energy output of the TEG module. The best immersion duration is 45 minutes.
The authors would like to thank the Chancellor of Hasanuddin University who has funded this research through the Unhas Basic Research scheme.
|
I |
Electric Current, A |
|
P |
Output power of TEG, W |
|
Ri RL |
Internal resistance of TEG, Ω External resistance of TEG, Ω |
|
ΔT |
Temperature Difference, Celsius degree |
|
ΔV |
Voltage difference, Volt |
|
V |
Output Voltage, Volt |
|
Qh |
Rate of heat transfer, W |
|
Greek symbols |
|
|
a |
Seebeck Coefficient |
|
ƞ |
TEG efficiency, % |
|
k |
Thermal Conductivity, W. m-1. K-1 |
|
Subscripts |
|
|
TEG |
Thermoelectric Generator |
|
W1 |
Initial mass |
|
W2 |
Mass of sample |
|
Is |
Solar Intensity |
|
Cu |
Copper |
|
NC |
No Coating |
|
NC1 |
No Coating for Voltage immersion 2.5 Volt |
|
NC2 |
No Coating for Voltage immersion 3.0 Volt |
|
NC3 |
No Coating for Voltage immersion 3.5 Volt |
|
Number-1 |
Immersion duration 30 minutes of the 2.5 Volt |
|
Number-2 |
Immersion duration 45 minutes of the 2.5 Volt |
|
Number-3 |
Immersion duration 60 minutes of the 2.5 Volt |
|
Number-4 |
Immersion duration 30 minutes of the 3.0 Volt |
|
Number-5 |
Immersion duration 45 minutes of the 3.0 Volt |
|
Number-6 |
Immersion duration 60 minutes of the 3.0 Volt |
|
Number-7 |
Immersion duration 30 minutes of the 3.5 Volt |
|
Number-8 |
Immersion duration 45 minutes of the 3.5 Volt |
|
Number-9 |
Immersion duration 60 minutes of the 3.5 Volt |
[1] Kilci, E.N. (2022). Incentives for sustainability: Relationship between renewable energy use and carbon emissions for Germany and Finland. Opportunities and Challenges in Sustainability, 1(1): 29-37. https://doi.org/10.56578/ocs010104
[2] Yuan, T.Z., Li, H., Jia, D. (2022). Modeling and control strategy of wind-solar hydrogen storage coupled power generation system. Journal of Intelligent Systems and Control, 1(1): 18-34. https://doi.org/10.56578/jisc010103
[3] Lorenzini, G., Kamarposhti, M.A., Solyman, A.A.A. (2021). A voltage stability-based approach to determining the maximum size of wind farms in power systems. International Journal of Design & Nature and Ecodynamics, 16(3): 245-250. https://doi.org/10.18280/ijdne.160301
[4] Taha, M.A., Ali, O.M., Weis, M.M. (2021). Implementation of fusel oil as an octane enhancer with commercial gasoline to operate gasoline engine. International Journal of Design & Nature and Ecodynamics, 16(5): 593-599. https://doi.org/10.18280/ijdne.160514
[5] Piarah, W.H., Djafar, Z. (2019). The characterization of a spectrum splitter of Techspec AOI 50.0 mm square hot and cold mirrors using a halogen light for a photovoltaic-thermoelectric generator hybrid. Energies, 12(3): 353. https://doi.org/10.3390/en12030353
[6] Djafar Z., Salsabila A.Z, Piarah W.H. (2021). Performance comparison between hot mirror and cold mirror as a beam splitter on photovoltaic-thermoelectric generator hybrid using labview simulator. International Journal of Heat and Technology, 39(5): 1609-1617. https://doi.org/10.18280/ijht.390524
[7] Djafar, Z., Piarah, W.H. (2019). Potential energy of photon passes through cold mirror on photovoltaic-thermoelectric generator with artificial lights radiation. Journal of Physics: Conference Series, 1242: 012055. https://doi.org/10.1088/1742-6596/1242/1/012055
[8] Kamaludin, T.M., Syahrani, S.A., Syamsu, W.D. (2020). Experimental study of cascaded thermoelectric generators with differences in focal length using LED lights energy radiation. IOP Conference Series: Materials Science and Engineering, 909: 012023. https://doi.org/10.1088/1757-899X/909/1/012023
[9] Ruzaimi, A., Shafie, S., Hassan, W.Z.W., Azis, N., Effendy Ya'acob, M., Elianddy, E. (2020). Temperature distribution analysis of monocrystalline photovoltaic-thermoelectric generator (PVTEG) hybrid application. Indonesian Journal of Electrical Engineering and Computer Science, 17(2): 858-876. https://doi.org/10.11591/ijeecs.v17.i2.pp858-867
[10] Min, G. (2013). Thermoelectric module design under a given thermal input: Theory and example. Journal of electronic materials, 42(7): 2239-2242. https://doi.org/10.1007/s11664-013-2591-2
[11] Chatterjee, K., Ghosh, T.K. (2021). Thermoelectric materials for textile applications. Molecules, 26(11): 3154. https://doi.org/10.3390/molecules 26113154
[12] Wu, T., Gao, P. (2018). Development of perovskite-type materials for thermoelectric application. Materials, 11(6): 999. https://doi.org/10.3390/ma11060999
[13] Yun, J.S., Choi, S., Im, S.H. (2021). Advances in carbon-based thermoelectric materials for high-performance, flexible thermoelectric devices. Carbon Energy, 3(5): 667-708. https://doi.org/10.1002/ cey2.121
[14] Liu, Z., Mao, J., Liu, T.H., Chen, G., Ren, Z. (2018). Nano-microstructural control of phonon engineering for thermoelectric energy harvesting. MRS Bulletin, 43(3): 181-186. https://doi.org/10.1557/mrs.2018.7
[15] Djafar, Z., Putra, N., Koestoer, R.A. (2013). The utilization of heat pipe on cold surface of thermoelectric with low-temperature waste heat. Applied Mechanics and Materials, 302: 410-415. https://doi.org/10.4028/www.scientific.net/AMM.302.410
[16] Khoo, Y.S., Nobre, A., Malhotra, R., Yang, D., Rüther, R., Reindl, T., Aberle, A.G. (2013). Optimal orientation and tilt angle for maximizing in-plane solar irradiation for PV applications in Singapore. IEEE Journal of Photovoltaics, 4(2): 647-653. https://doi.org/10.1109/JPHOTOV.2013.2292743
[17] Roth, R., Rostek, R., Lenk, G., Kratschmer, M., Cobry, K., Woias, P. (2013). Two-layer process for a micro thermoelectric cross-plane generator with electroplating and reflow soldering. 2013 Transducers & Eurosensors XXVII: The 17th International Conference on Solid-State Sensors, Actuators and Microsystems, Barcelona, Spain, pp. 486-489. https://doi.org/10.1109/Transducers.2013.6626809
[18] Roth, R., Rostek, R., Cobry, K., Köhler, C., Groh, M., Woias, P. (2014). Design and characterization of micro thermoelectric cross-plane generators with electroplated Bi2Te3, sbxtey, and reflow soldering. Journal of microelectromechanical systems, 23(4): 961-971. https://doi.org/10.1109/JMEMS.2014.2303198
[19] Sargolzaeiaval, Y., Ramesh, V.P., Neumann, T.V., Misra, V., Vashaee, D., Dickey, M.D., Öztürk, M.C. (2020). Flexible thermoelectric generators for body heat harvesting–Enhanced device performance using high thermal conductivity elastomer encapsulation on liquid metal interconnects. Applied Energy, 262: 114370. https://doi.org/10.1016/j.apenergy.2019.114370
[20] Soleimani, Z., Zoras, S., Ceranic, B., Cui, Y., Shahzad, S. (2021). A comprehensive review on the output voltage/power of wearable thermoelectric generators concerning their geometry and thermoelectric materials. Nano Energy, 89: 106325. https://doi.org/10.1016/j.nanoen.2021.106325
[21] Lee, W.L., Shih, P.J., Hsu, C.C., Dai, C.L. (2019). Fabrication and characterization of flexible thermoelectric generators using micromachining and electroplating techniques. Micromachines, 10(10): 660. https://doi.org/10.3390/mi10100660
[22] Yadav, D., Azad, P., Vaish, R. (2020). Solar energy harvesting using candle-soot-coated thermoelectric materials. Global Challenges, 4(8): 1900080. https://doi.org/10.1002/gch2.201900080
[23] Utamaningrat, I.M.A., Eskani, I.N. (2018). Studi pelapisan tembaga pada bahan non-logam untuk aplikasi produk kerajinan dengan metode electroforming. Dinamika Kerajinan Dan Batik, 35(1): 45-52. https://dx.doi.org/10.22322/dkb.v35i1.994
[24] Goldsmid, H.J. (2016). Minimising the thermal conductivity. Introduction to Thermoelectricity, 67-84. https://doi.org/10.1007/978-3-642-00716-3
[25] Ogbonnaya, E., Gunasekaran, A., Weiss, L. (2013). Micro solar energy harvesting using thin film selective absorber coating and thermoelectric generators. Microsystem Technologies, 19(7): 995-1004. https://doi.org/10.1007/s00542-012-1687-6