Kamel Hachemi* | Florina Grecu | Gabriela Ioana-Toroimac | Ştefania Grigorie-Omrani | André Ozer | Catherine Kuzucuoglu
© 2021 IIETA. This article is published by IIETA and is licensed under the CC BY 4.0 license (http://creativecommons.org/licenses/by/4.0/).
OPEN ACCESS
The Danube islands system is continuously undergoing real degradations caused by natural and anthropogenic processes, thus causing a weakening of the biological potential and generating ecological and socio-economic imbalances. The lack of frequent data on the morphometric parameters of the islands in this region constitutes a major gap for monitoring, understanding and diagnosing the state of their evolution. The aim of this work is to show the importance of morphometric parameters extracted from SAR radar amplitude images in the monitoring of the dynamics of the Danube island system, along the Giurgiu-Călăraşi sector, at the frontier of Romania – Bulgaria. This study conducted by extraction of islands allowed us to detect and monitor the evolution of each island and sub-island, between 1995 and 2009, with great precision. The results obtained showed a displacement of the island system in the South-East direction with an average annual velocity of about 1 m/year and sediment accumulations with an average radius velocity estimated at 1.34 m/year during this period of 14 years. The increase of sediment accumulation during the studied period is due to river bank erosion and to the major floods produced in 2005 on the tributary rivers and especially those of 2006 on the Danube River.
morphometric, SAR radar, Danube, islands, Giurgiu-Călăraşi sector, Romania
SAR imagery (Synthetic Aperture Radar) has the ability to determine, locate, inventory and map islands. It also allows not only to study a single island but the whole island system of the Danube River along the Giurgiu-Călăraşi sector, thus gaining a good understanding of the evolution of the entire river system. Radar amplitude images perfectly delimit the islands due to their sensitivity to roughness. This work is considered as an extension and continuity of a project on the same sector of the Danube (Giurgiu-Călăraşi), showing the contribution of SAR radar imagery in the monitoring of the dynamics of an island system. The results can be summarized by: (1) the production of amplitude images, with a resolution of 12.5 m, calibrated, filtered, georeferenced and orthorectified, showing the morphology of the islands at different dates and also constituting a database of several periods (i.e. 1995, 1996, 1997, 1999, 2000, 2002, 2004, 2005, 2007, 2008 and 2009) of this sector of the Danube; (2) the inventory, cartography and map production at different dates of this system of islands; (3) the performing of the colored compositions, thereby showing possible changes occurring at different intervals; (4) the evaluation of the dynamics of the island system between 1995 and 2009, showing small surface areas thus sedimentary accumulations in this period of 14 years.
The extraction of morphometric parameters from SAR radar images gave excellent results in the study of a Barkhane field in Mauritania. It made it possible to list more than 900 barchans, to calculate their displacement under the effect of the wind and to classify them in three categories according to their speed by contribution to their size: small surfaces 38 m/year, medium 27 m/year and large 23 m/year [1]. The SAR imagery was also used to monitor river channel planform changes [2].
The aim of this work is to show the interest of the morphometric parameters extracted from the SAR radar images in the monitoring of the dynamics of the island system of the Giurgiu-Călăraşi sector of the Danube in Romania. To achieve this goal, we extract the morphometric parameters of each island and sub-island at different dates, using the amplitude images produced, compare, analyze, and interpret the results obtained.
2.1 Localization of the study area
The southwest sector of the Danube region is located south of Bucharest, between the cities Giurgiu and Călăraşi. It is delimited by latitudes: 43.61° to 44.36° North and longitudes: 25.57° to 26.91° East, as shown in Figure 1.
Figure 1. Geographic map of the region and the localization of the study area (red frame) on the Danube River (Giurgiu-Călăraşi sector, Romania). Source: emmaus-europe.org
2.2 Geological, geomorphologic and climatic characteristics of the study area
The geological and geomorphological features of the islands are similar to the Danube floodplain and the Romanian plain. They are genetically related and tectonically influenced [3]. The relative altitude of the islands does not exceed or rarely exceed 4 or 5 m compared to the average level of the Danube. Small islands, with short altitudes, are often flooded. Alluvial deposits on their surfaces belong to the Upper Quaternary (Upper and Present Holocene). They are formed of pebbles, sand, loess deposits with varied grain size according to their positions, near the major tributaries of the Danube or the banks. The natural vegetation on the islands is partially replaced. Chernozem soils are found on the terraces and in the plain and alluvial soil are found in the major river bed [4].
This study area is characterized by a very contrasting climate between summer and winter. Its relatively flat topography promotes rapid movement of air masses, very high wind speeds, snowstorms and excessive increases in summer temperatures [5].
As major driver of island dynamics, the sediment load of the Lower Danube River is dominated by coarse sediment in suspension. The sediment load is decreasing along the Lower Danube River especially since the construction of the dams of Iron Gates I and II in 1972 and 1984 [6].
3.1 Methodology
The methodology chosen in this study is based on: (1) the delineation and extraction of the parameters of each island and sub-island (perimeter (P), area (S) and UTM coordinates of the center (X, Y)), using the amplitude images produced; (2) the calculation of the variations, ΔP, ΔS, ΔX and ΔY, of the parameters extracted for each island and sub-island at different dates; (3) study and analysis of these results.
3.2 SAR radar data used
For this study, we used the data of PRI (Precision Image) types of ERS-2 satellite (Table 1). The acquisition of these images is ascending (night shift), from an azimuthal direction upwards. The scene is illuminated to the right in a side view with an angle of incidence of 23°, in the band "C" wavelength (5.65 cm), and a vertical polarization (VV).
The choice of two dates in the same year, July and December 1995, is justified by the fact of discriminating and eliminating seasonal changes from those of morphological origins. Regarding the dates 1995 and 2009, this selection is based on the availability and on the largest possible interval of the same platform, as here satellite ERS-2 to avoid any instrumental errors.
Table 1. Data used from the ERS-2 satellite
|
Date |
Hour |
Orbit |
Track |
Frame |
Centre Lat°/Lon° |
Incidence Angle |
|
06/07/1995 |
20:26:40 |
01099 |
243 |
873 |
43.98/26.26 |
23.247° |
|
28/12/1995 |
20:26:39 |
03604 |
243 |
873 |
43.99/26.25 |
23.247° |
|
28/05/2009 |
20:27:40 |
73744 |
243 |
873 |
43.98/26.24 |
22.921° |
3.3 Data processing
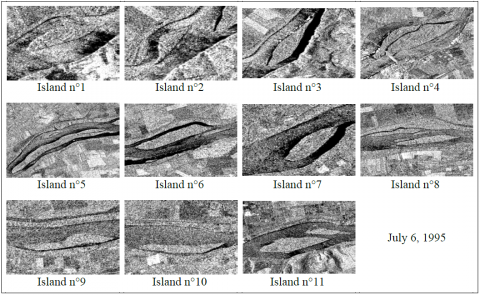
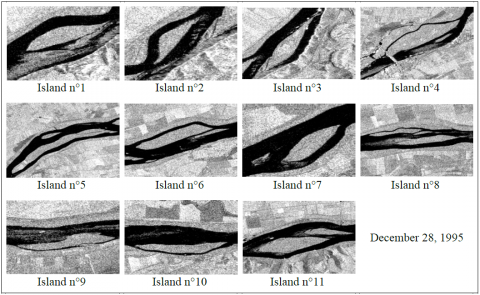
We delimited each island and sub-island with great precision from the three amplitude images of different dates, as shown in Figures 2, 3 and 4. We then extracted their morphometric parameters, such as the perimeter (P), the surface (S) and also their coordinates from the center (X; Y) to UTM. Subsequently, we also calculated the average of the variations ΔP, ΔS, ΔX and ΔY, by subtraction of each parameter between 1995 and 2009.
Figure 2. Amplitude images of each island of the Danube River along the Giurgiu-Călăraşi, dated on the 6th of July 1995
Figure 3. Amplitude images of each island of the Danube River along the Giurgiu-Călăraşi sector, dated on the 28th of December 1995
Figure 4. Amplitude images of each island of the Danube River along the Giurgiu-Călăraşi sector, dated on the 28th of May 2009
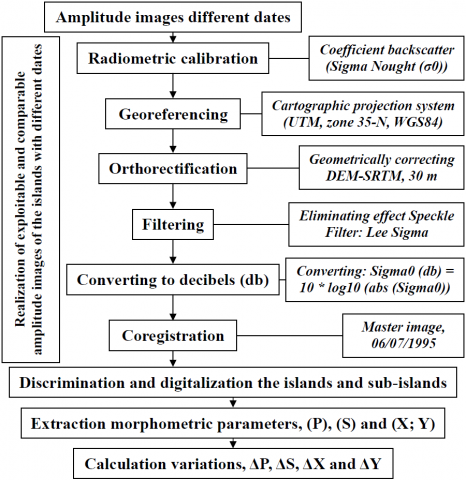
Figure 5. Flowchart showing the different steps of the performed treatments
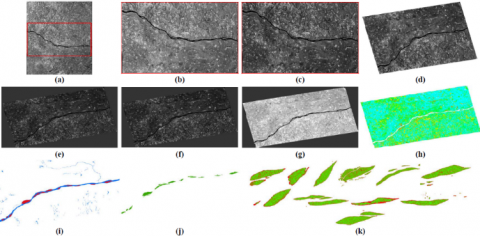
Figure 6. Different steps of treatments; (a) Original image; (b) Amplitude image of the study area; (c) Calibration (Sigma0); (d) Georeferencing; (e) Orthorectification; (f) Filtering; (g) Converting to decibel image (db); (h) Island discrimination; (i) Extracted islands with the river; (j) Extracted islands; (k) Detail of the extracted islands
The different stages of the carried out treatments can be summarized according to the following flowchart (Figure 5). Figure 6 shows the results of island extraction.
4.1 Morphometric parameters of the islands from 1995 and 2009
Using amplitude radar images, we were able to extract the morphometric parameters such as perimeters (P), areas (S) and UTM coordinates from the center (X, Y) of each island and sub-island at different dates, July and December 1995 and May 2009 (Tables 2, 3 and 4). The sub-islands marked with (*) are not in one of the two dates. The abbreviations Bg and Ro denote Bulgaria and Romania respectively.
Table 2. Morphometric parameters of the islands and sub-islands from the Giurgiu-Călărași sector, of July 6, 1995
|
N° |
Name |
N° Island |
Centre |
P |
S |
|
|
X (m) |
Y (m) |
(km) |
(km2) |
|||
|
1 |
Cama Dinu 1 (Vedea) (Ro) |
Island n°1-1 |
406734.00 |
4846022.40 |
6.07 |
1.33 |
|
Island n°1-2* |
0 |
0 |
0 |
0 |
||
|
2 |
Cama Dinu 2 (Malu) (Ro) |
Island n°2 |
409148.00 |
4847928.01 |
5.07 |
0.76 |
|
3 |
Liuliak (Prista) (Bg) |
Island n°3 |
411586.00 |
4849702.26 |
8.30 |
1.99 |
|
4 |
Mocanu (Ro) |
Island n°4-1 |
422304.00 |
4862006.93 |
13.91 |
6.68 |
|
Island n°4-2 |
423864.00 |
4861799.63 |
2.52 |
0.19 |
||
|
Island n°4-3* |
420406.00 |
4861818.26 |
11.08 |
2.69 |
||
|
5 |
Aleko (Bg) |
Island n°5-1 |
430307.00 |
4868673.92 |
20.61 |
5.50 |
|
Island n°5-2 |
429707.00 |
4869763.80 |
3.59 |
0.35 |
||
|
6 |
Lungu (Ro) |
Island n°6-1 |
436857.00 |
4871865.96 |
9.99 |
2.92 |
|
Island n°6-2 |
439152.00 |
4872232.91 |
3.08 |
0.26 |
||
|
7 |
Miska (Bg) |
Island n°7-1 |
443643.00 |
4873735.35 |
5.34 |
1.23 |
|
Island n°7-2 |
442122.00 |
4873132.71 |
1.23 |
0.04 |
||
|
8 |
Goliam (Bg); (Ro); (Ro) |
Island n°8-1 |
450757.00 |
4875927.92 |
7.84 |
1.44 |
|
Island n°8-2 |
448900.00 |
4876591.58 |
7.09 |
0.88 |
||
|
Island n°8-3 |
450414.00 |
4876515.26 |
2.18 |
0.14 |
||
|
Island n°8-4* |
449103.00 |
4875921.64 |
2.20 |
0.14 |
||
|
Island n°8-5* |
0 |
0 |
0 |
0 |
||
|
9 |
Kalimok (Bg) |
Island n°9 |
455538.00 |
4875797.81 |
7.93 |
1.34 |
|
10 |
Tutrakan (Bg) |
Island n°10 |
465997.00 |
4877246.69 |
7.42 |
1.18 |
|
11 |
Kosui (Pozharevo) (Bg); (Bg); (Bg) |
Island n°11-1 |
475472.00 |
4879228.18 |
9.18 |
2.98 |
|
Island n°11-2 |
477359.00 |
4880219.50 |
5.93 |
0.85 |
||
|
Island n°11-3 |
477911.00 |
4879821.35 |
0.37 |
0.01 |
||
Table 3. Morphometric parameters of the islands and sub-islands from the Giurgiu-Călărași sector, of December 28, 1995
|
N° |
Name |
N° Island |
Centre |
P |
S |
|
|
X (m) |
Y (m) |
(km) |
(km2) |
|||
|
1 |
Cama Dinu 1 (Vedea) (Ro) |
Island n°1-1 |
406967.84 |
4846000.04 |
9.04 |
1.75 |
|
Island n°1-2 |
406129.56 |
4844964.89 |
6.74 |
1.26 |
||
|
2 |
Cama Dinu 2 (Malu) (Ro) |
Island n°2 |
409257.38 |
4848069.11 |
5.96 |
0.939 |
|
3 |
Liuliak (Prista) (Bg) |
Island n°3 |
411461.53 |
4849549.65 |
10.34 |
2.47 |
|
4 |
Mocanu (Ro) |
Island n°4-1 |
422342.25 |
4862016.67 |
13.93 |
6,65 |
|
Island n°4-2 |
423918.31 |
4861871.20 |
3.51 |
0.32 |
||
|
Island n°4-3* |
0 |
0 |
0 |
0 |
||
|
5 |
Aleko (Bg) |
Island n°5-1 |
430318.15 |
4868687.20 |
20.71 |
5.53 |
|
Island n°5-2 |
429746.92 |
4869820.97 |
3.62 |
0.45 |
||
|
6 |
Lungu (Ro) |
Island n°6-1 |
436898.03 |
4871890.12 |
9.94 |
3.04 |
|
Island n°6-2 |
438835.92 |
4872129.70 |
5.16 |
0.43 |
||
|
7 |
Miska (Bg) |
Island n°7-1 |
443628.41 |
4873718.29 |
5.86 |
1.34 |
|
Island n°7-2 |
441976.15 |
4873021.00 |
2.26 |
0.182 |
||
|
8 |
Goliam (Bg); (Ro); (Ro) |
Island n°8-1 |
449870.22 |
4875892.25 |
12.68 |
2.59 |
|
Island n°8-2 |
448891.93 |
4876600.40 |
6.65 |
0.84 |
||
|
Island n°8-3 |
450454.97 |
4876537.88 |
2.55 |
0.17 |
||
|
Island n°8-4* |
0 |
0 |
0 |
0 |
||
|
Island n°8-5* |
0 |
0 |
0 |
0 |
||
|
9 |
Kalimok (Bg) |
Island n°9 |
455625.71 |
4875827.79 |
8.34 |
1.42 |
|
10 |
Tutrakan (Bg) |
Island n°10 |
466035.57 |
4877282.62 |
8.06 |
1.35 |
|
11 |
Kosui (Pozharevo) (Bg); (Bg); (Bg) |
Island n°11-1 |
475268.53 |
4879188.40 |
9.98 |
3.55 |
|
Island n°11-2 |
477375.06 |
4880210.68 |
5.98 |
0.94 |
||
|
Island n°11-3 |
477690.19 |
4879803.03 |
1.28 |
0.05 |
||
Table 4. Morphometric parameters of the islands and sub-islands from the Giurgiu-Călărași sector, of May 28, 2009
|
N° |
Name |
N° Island |
Centre |
P |
S |
|
|
X (m) |
Y (m) |
(km) |
(km2) |
|||
|
1 |
Cama Dinu 1 (Vedea) (Ro) |
Island n°1-1 |
406858.71 |
4846015.76 |
6.29 |
1.28 |
|
Island n°1-2 |
406217.54 |
4845157.82 |
2.98 |
0.37 |
||
|
2 |
Cama Dinu 2 (Malu) (Ro) |
Island n°2 |
409335.96 |
4848175.24 |
4.01 |
0.72 |
|
3 |
Liuliak (Prista) (Bg) |
Island n°3 |
411554.40 |
4849597.36 |
9.32 |
2.35 |
|
4 |
Mocanu (Ro) |
Island n°4-1 |
422363.41 |
4862070.77 |
13.89 |
6.83 |
|
Island n°4-2 |
424269.54 |
4862203.27 |
4.58 |
0.44 |
||
|
Island n°4-3* |
0 |
0 |
0 |
0 |
||
|
5 |
Aleko (Bg) |
Island n°5-1 |
430194.87 |
4868622.61 |
20.58 |
5.69 |
|
Island n°5-2 |
429765.95 |
4869857.28 |
3.76 |
0.47 |
||
|
6 |
Lungu (Ro) |
Island n°6-1 |
436936.04 |
4871915.29 |
9.94 |
3.02 |
|
Island n°6-2 |
438326.45 |
4871928.85 |
6.41 |
0.72 |
||
|
7 |
Miska (Bg) |
Island n°7-1 |
443653.16 |
4873757.58 |
5.44 |
1.25 |
|
Island n°7-2 |
441919.20 |
4873078.21 |
2.13 |
0.17 |
||
|
8 |
Goliam (Bg); (Ro); (Ro) |
Island n°8-1 |
450609.57 |
4875973.96 |
8.15 |
1.64 |
|
Island n°8-2 |
448925.10 |
4876623.37 |
6.42 |
0.78 |
||
|
Island n°8-3 |
450485.91 |
4876556.67 |
2.50 |
0.19 |
||
|
Island n°8-4* |
0 |
0 |
0 |
0 |
||
|
Island n°8-5* |
449354.04 |
4876488.60 |
1.42 |
0.04 |
||
|
9 |
Kalimok (Bg) |
Island n°9 |
455659.60 |
4875817.76 |
8.09 |
1.41 |
|
10 |
Tutrakan (Bg) |
Island n°10 |
466017.13 |
4877304.71 |
7.90 |
1.41 |
|
11 |
Kosui (Pozharevo) (Bg); (Bg); (Bg) |
Island n°11-1 |
475328.20 |
4879210.71 |
9.39 |
3.40 |
|
Island n°11-2 |
477397.62 |
4880218.25 |
5.83 |
0.96 |
||
|
Island n°11-3 |
477730.35 |
4879817.35 |
1.48 |
0.06 |
||
4.2 Comparison of the islands system between 1995 and 2009
To observe the evolution of the island system between 1995 and 2009, we made a comparison of the previously extracted parameters by dates. The results obtained are summarized in Table 5. For each island and sub-island, the procedure consists in calculating the average of the subtraction between the same parameter measured at different dates using the following formulas:
$\Delta X=\frac{\sum\limits_{1}^{n}{\left( {{X}_{f}}-{{X}_{i}} \right)}}{n}$ (1)
$\Delta Y=\frac{\sum_{l}^{n}\left(Y_{f}-Y_{i}\right)}{n}$ (2)
$\Delta P=\frac{\sum_{l}^{n}\left(P_{f}-P_{i}\right)}{n}$ (3)
$\Delta S=\frac{\sum_{l}^{n}\left(S_{f}-S_{i}\right)}{n}$ (4)
where, X and Y: UTM coordinates of the center of the island; P: Perimeter of the island; S: Area of the island; n: number of dates used; f: final date; i: initial date.
Table 5. Shows the names and averages of the parameters variations, ΔP, ΔS, ΔX and ΔY of each island and sub-island
|
N° |
Name |
N° Island |
∆X (km) |
∆Y (km) |
∆P (km) |
∆S (km2) |
|
1 |
Cama Dinu 1 (Vedea) (Ro) |
Island n°1-1 |
0.08 |
-0.004 |
0.15 |
-0.03 |
|
2 |
Island n°1-2* |
270.81 |
3230.11 |
1.99 |
0.25 |
|
|
3 |
Cama Dinu 2 (Malu) (Ro) |
Island n°2 |
0.13 |
0.16 |
-0.71 |
-0.03 |
|
4 |
Liuliak (Prista) (Bg) |
Island n°3 |
-0.02 |
-0.07 |
0.68 |
0.24 |
|
5 |
Mocanu (Ro) |
Island n°4-1 |
0.04 |
0.04 |
-0.01 |
0.10 |
|
6 |
Island n°4-2 |
0.27 |
0.27 |
1.37 |
0.17 |
|
|
7 |
Island n°4-3* |
-280.3 |
-3241.2 |
-7.39 |
-1.79 |
|
|
8 |
Aleko (Bg) |
Island n°5-1 |
-0.07 |
-0.03 |
-0.02 |
0.13 |
|
9 |
Island n°5-2 |
0.04 |
0.06 |
0.11 |
0.08 |
|
|
10 |
Lungu (Ro) |
Island n°6-1 |
0.05 |
0.03 |
-0.03 |
0.07 |
|
11 |
Island n°6-2 |
-0.55 |
-0.20 |
2.22 |
0.31 |
|
|
12 |
Miska (Bg) |
Island n°7-1 |
0.01 |
0.01 |
0.07 |
0.01 |
|
13 |
Island n°7-2 |
-0.14 |
-0.04 |
0.60 |
0.09 |
|
|
14 |
Goliam (Bg); (Ro); (Ro) |
Island n°8-1 |
-0.10 |
0.03 |
0.21 |
0.13 |
|
15 |
Island n°8-2 |
0.02 |
0.02 |
-0.45 |
-0.07 |
|
|
16 |
Island n°8-3 |
0.05 |
0.03 |
0.21 |
0.03 |
|
|
17 |
Island n°8-4* |
-299.40 |
-3250.6 |
-1.47 |
-0.09 |
|
|
18 |
Island n°8-5* |
299.57 |
3250.99 |
0.95 |
0.03 |
|
|
19 |
Kalimok (Bg) |
Island n°9 |
0.08 |
0.01 |
0.11 |
0.05 |
|
20 |
Tutrakan (Bg) |
Island n°10 |
0.01 |
0.04 |
0.32 |
0.15 |
|
21 |
Kosui (Pozharevo) (Bg); (Bg); (Bg) |
Island n°11-1 |
-0.10 |
-0.01 |
0.14 |
0.28 |
|
22 |
Island n°11-2 |
0.03 |
-0.001 |
-0.07 |
0.07 |
|
|
23 |
Island n°11-3 |
-0.12 |
-0.003 |
0.74 |
0.03 |
4.3 Evolution of the islands system between 1995 and 2009
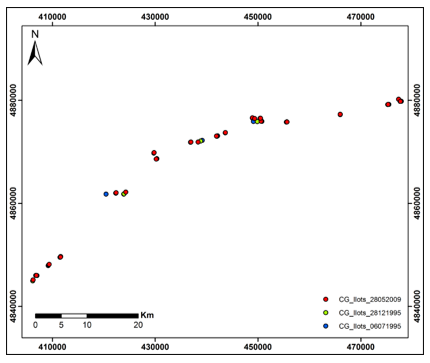
Analysis of the parameters extracted from the SAR radar images made it possible to detect and follow the evolution of the Danube island system, sector Giurgiu-Călăraşi, with great precision. The positive values of the calculated averages, the UTM coordinates of the center (ΔX, ΔY), show the very important role of the wind factor or other major phenomena in the displacements of the sediments of the islands and sub-islands, as shown in Figure 7. We estimated an average island system speed of about 1 m/year in the Southeast direction. This displacement is accompanied by the elongation of the islands [7].
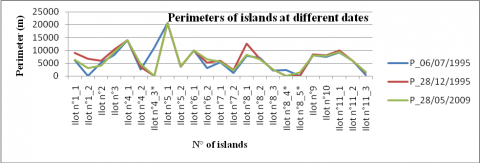
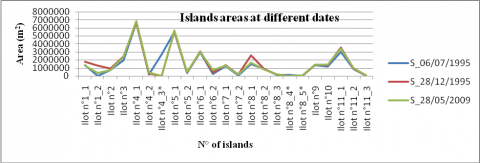
The evaluation of the sedimentary accumulations was determined from Figures 8 and 9, showing the morphometric parameter variations according to their measurement dates, and the results of the perimeters and area means (ΔP and ΔS), obtained using formulas (3) and (4).
The speed of the accumulations of the surfaces is given by the mean growth speeds of the islands and sub-islands perimeters and areas. For perimeters, we estimated an average speed of about 18 m/year and for areas of about 5621 m2/year. These results must be distributed over the number of islands and sub-islands listed, which gives average speeds respectively of 0.78 m/year and 244.39 m2/year.
Figure 7. Map of displacement of the centre of the islands between 1995 and 2009
Figure 8. Evolution of the perimeter of the islands and sub-islands between 1995 and 2009
Figure 9. Evolution of the area of the islands and sub-islands between 1995 and 2009
Positive values show an increase in sediment during the 14-year period (1995 and 2009) with an estimated average accumulation of approximately 2972.5 m2/year, a radius of 30.77 m each year. This gives an estimate of an accumulation of 129.24 m2/year and radius 1.34 m/year for each island and sub-island.
On the other hand, the few minimal negative values can be explained by errors due to the treatments carried out and the phenomena of compensations.
Figures 8 and 9 show the evolution of the perimeters and the surfaces of the islands and sub-islands between 1995 and 2009. The higher values in December 1995 when compared to July 1995 are probably due to low water levels of the river in winter.
During floods, rivers in the region carry large quantities of solid materials, causing changes in the transverse and vertical profiles of the canals [8]. As example, if the average annual suspended sediment load of the Vedea River – a tributary of the Danube upstream of the study area – at Alexandria is only 12.6 kg/s, during major floods (1972, 1975, 1995 and 2005) it exceeded 5000 kg/s. Its maximum value was reached during the flood of July 2005, with 5838 kg/s [9]. The flooding of the Danube River on 24 April 2006 resulted in volumes of sediments corresponding to a maximum liquid flow ranging from 16100 to 16500 m3/s between Giurgiu and Călăraşi [10-12].
This evolution corresponds to the general dynamics of the Danube River islands along the studied sector: slight area increase since 1980 [13]. Along the Lower Danube, lateral (side) erosion is still common as many of the banks and islands are unprotected, which determines the formation of sand bars [14]. The process is probably more intense post- flood events.
This study of extraction of morphometric parameters from SAR radar images allowed us to detect, monitor and analyze changes in the islands and sub-islands of the Danube, sector Giurgiu-Călăraşi, with great precision. The results reveal a slight displacement of the island system in the Southeast direction and a small increase in sediment accumulation. This increase during this 14-year period is due to the major floods produced in 2005 on the tributary rivers and especially those of 2006 on the Danube River.
This study allowed to better understand the recent dynamics of the Lower Danube River islands and could further help decision makers to conduct a proper river management with a special regard on islands that are hydraulically and ecologically important [14, 15].
We thank the European Space Agency (ESA) for providing us with the SAR images from the ERS satellites in the framework of a research project on the survey and monitoring of the Danube islands in the Giurgiu-Călăraşi sector, Romania.
[1] Hachemi, K., Thomas, Y.F. (2013). Analyse de la mobilité d'un champ de Barkhanes (Mauritanie) à partir des images SAR. Conférence Internationale of Spatial Analysis and GEOmatics (SAGEO), IUEM, Brest, pp. 273-286.
[2] Mitidieri, F., Papa, M.N., Amitrano, D., Ruello, G. (2016). River morphology monitoring using multitemporal SAR data: preliminary results. European Journal of Remote Sensing, 49(1): 889-898. https://doi.org/10.5721/EuJRS20164946
[3] Bandrabur, T. (1966). Harta geologica, 1:200 000, 44. Bucuresti, Nota explicative. Comitetul de Stat al Geologiei, Bucuresti, pp. 1-26.
[4] Grecu, F., Ioana-Toroimac, G., Grigorie (Omrani), Ş., Ghiţă, C.(2017). The dynamics of the Danube channel over the last 150 years. Proceedings of Romanian Geomorphology Symposium, Ed. Universităţii Alexandru Ioan Cuza din Iaşi, pp. 56-59. https://doi.org/10.15551/prgs.2017.56
[5] Grecu, F. (2010). Geografia campiilor României. Editura Universității din Bucuresti, Bucuresti, 1-260.
[6] Bondar, C., Iordache, G. (2016). Sediment transport on the Romanian section of the Danube River. Geo-Eco-Marina, 22, 29-49.
[7] Marin, A.F., Armaș, I. (2016). Shape characteristics of fluvial islets based on GIS techniques. A case study: the Danube’s islets between Giurgiu and Olteniţa. Forum geografic, XV, 2: 133-139. https://doi.org/10.5775/fg.2067-4635.2016.047.d
[8] Grecu, F., Zaharia, L, Ioana-Toroimac, G., Armaș, I. (2017). Floods and flash-floods related to river channel dynamics. In: vol. Radoane M., Vespremeanu Stroe F. (eds), Landform Dynamics and Evolution in Romania. Springer Geography: Switzerland, pp. 821-844. https://doi.org/10.1007/978-3-319-32589-7_33
[9] Grecu, F., Zaharia, L., Ghita, C., Vacaru, L. (2010). The dynamic factors of hydrogeomorphic vulnerability in the central sector of the romanian plain. Metalurgia International, Special Issue, 15(9): 139-148.
[10] Grecu, F., Zaharia, L., Ioana-Toroimac, G., Dobre, R. (2007). Risque météo-hydrologique dans la vallée du Danube roumain. Le cas des inondations d’avril – mai 2006. Climat, Tourisme, Environnement, Actes du XXème Colloque de l’Association Internationale de Climatologie, 3-8 septembre 2007, Carthage, Tunis, pp. 277-282.
[11] Grigorie, Ș. (2013). Valea Dunăriiîn sectorul Oltenița-Călăraşi, Studiu hidrogeomorfologic. Thèse de doctorat, Université de Bucarest, pp. 1-236.
[12] Grecu, F. (2016). Hazarde si riscuri naturale. Editura Universitara, Bucuresti, 1-354. https://doi.org/10.5682/9786062803926
[13] Constantinescu, S., Achim, D., Rus, I., Giosan, L. (2015). Embanking the Lower Danube: From natural to engineered floodplains and back. In: Hudson, P.F., Middelkoop, H. (Eds.), Geomorphic approaches to integrate floodplain management of lowland fluvial systems in North America and Europe. Springer, pp. 265-288. https://doi.org/10.1007/978-1-4939-2380-9_11
[14] Habersack, H., Hein, T., Stanica, A., Liska, I., Mair, R., Jäger, E., Hauer, C., Bradley, C. (2016). Challenges of river basin management: Current status of, and prospects for, the River Danube from a river engineering perspective. Science of the Total Environment, 543(Part A): 828-845. https://doi.org/10.1016/j.scitotenv.2015.10.123
[15] Wyrick, J.R., Klingeman, P.C. (2011). Proposed fluvial island classification scheme and its use for river restoration. River Research and Applications, 27(7): 814-825. https://doi.org/10.1002/rra.1395