Tingting Shi | Zhihua Chen | Qing Wang | Wei Zhang | Mingming Luo | Ningtao Wang*
© 2020 IIETA. This article is published by IIETA and is licensed under the CC BY 4.0 license (http://creativecommons.org/licenses/by/4.0/).
OPEN ACCESS
Targeting the carbonate-dominated catchment of Xiangxi River, the first tributary of Three Gorges Reservoir, this paper explores the spatiotemporal distribution of stable isotopes in the stream water, and distinguishes the water sources and recharge processes in the river basin. Multiple water samples were collected from the catchments of the main tributaries of Xiangxi River, namely, Nanyang River and Gaolan River. The results show that the two tributary catchments had obvious spatial and seasonable variability in δ18O and δD. This is attributable to the seasonal changes in meteoric precipitation recharge, which depends on ambient temperature, precipitation, evaporation, and secondary evaporation of raindrops. Besides, there is a strong elevation effect on stable isotopes in stream water. In the samples from Gaolan River, the mean elevation effect on the δ18O and δD was -0.35‰, and -1.57‰ per 100m change in elevation in summer, and -0.12‰, and -1.19‰ per 100m change in elevation in winter, respectively. In the samples from Nanyang River, the mean elevation effect on the δ18O and δD was -0.14‰ and -0.89‰ per 100m change in elevation in summer, and -0.08‰ and -0.66‰ per 100m change in elevation in winter, respectively. The δD, δ18O, and deuterium excess (d-value) are not only affected by the elevation effect, but also by the seasonal effect in the study area. The seasonal variations and spatial changes in the tributary catchments reveal the difference between the two catchments in control factors like latitude effect, evaporation, and the mixing of different water sources.
environmental isotopes, karst mountains, hydrologic cycle, spatiotemporal variation, Xiangxi River Basin
The isotope techniques provide an economic and valuable tool for geochemical and hydrogeological investigations [1-4]. Facing serious and widespread water shortage, hydrologists have attempted to develop and manage water resources based on the spatiotemporal variation of stable isotopes in precipitation and surface water [1, 2, 5-8].
The content variations of environmental isotopes of oxygen (δ18O) and hydrogen (δD) are natural markings that facilitate the understanding of the entire change process of oxygen and hydrogen isotopes: evaporation, condensation, raindrop formation, and aquifer infiltration. These two isotopes have been widely employed to study hydrogeological processes within the hydrologic cycle [9-12], such as precipitation, groundwater recharge, groundwater-surface water interaction, and basin hydrology [9, 13, 14], distinguish the source and pathways of streams and groundwater recharge [2, 15], and evaluate the dynamics of surface water and groundwater, evaporation of water bodies, and the mixing between various water sources [7, 16-18].
Central China’s Hubei province has a warm and humid climate, which is controlled by subtropical monsoon. The annual mean precipitation of the province is as high as 1,400-1,500mm. Most areas of Hubei are dominated by mountains and deep valleys formed with carbonate rocks. From the mountainous areas, the groundwater flows into rivers, and mixes with surface water, which often has no clear source or end [19]. In the well-developed karst mountains, groundwater and surface water transform mutually at a rapid pace. Therefore, the karst water resembles surface water in many hydrological and hydraulic features. It is possible to rely on environmental isotopes to explore the karst transformation between surface water and groundwater, and the hydrologic cycle in the karst mountains.
This paper investigates the transformation relationship between surface water and groundwater, and the geochemical and hydrologic cycle in karst mountains, Xiangxi River Basin, Hubei Province, based on the spatiotemporal distribution of δD and δ18O in relevant streams and springs. In addition, the authors summarized the spatiotemporal distribution of water resources in the study area, as well as the pattern of sustainable development for such resources.
2.1 Study area
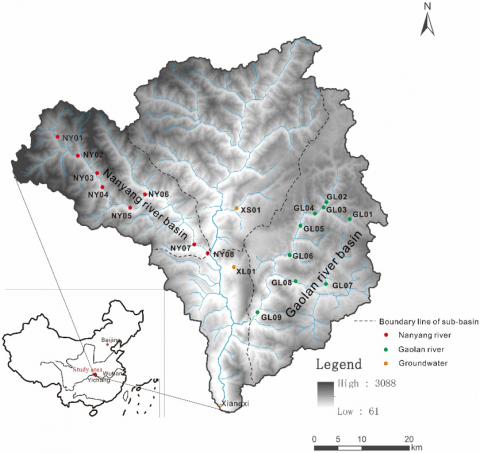
Originating in the Shennongjia National Forest Park (SNFP), Xiangxi River is the first tributary of the Yangtze River in the Three Gorges Reservoir (Figure 1). The 94km-long river and its tributaries drain an area of 3,099km2 (N: 30º96’- 31º67’; E: 110º47’-111º13’).
With an elevation range of 154m-3,000m, the Xiangxi River Basin has a typical northern subtropic mountainous landscape, and experiences a humid climate. From 1961 to 2004, the annual precipitation fluctuated considerably between from 670mm and 1,700mm, averaging at 1,100mm. In the same period, the annual temperature ranged between 12℃ and 20℃, averaging at 15.6℃. The rainy season (summer) lasts from May to September, including a flood season from July to August, while the dry season (winter) spans from December to the next February. The annual mean depth of runoff stands at 688mm.
About 70.9% of the river basin is covered by evergreen broadleaved forests, and mixed evergreen and deciduous forests. These forests mainly grow on hillsides and slopes [20]. The outcrop area of carbonate rocks in the river basin amounts to 2,135.11km2, 66.62% of the total area. In particular, the outcrops are distributed continuously in the midstream and upstream of three tributaries: Nanyang River, Gufu River, and Gaolan River.
Figure 1. The study area and sampling points
2.2 Sampling
The samples of surface water and groundwater were collected from upstream to downstream in the catchments of the three tributaries in the study area. Two sampling campaigns were conducted. A total of 19 samples were collected in the first campaign during the rainy season in August, 2011, and 14 were collected in the second campaign during the dry season in December 2011. As shown in Figure 1, the sampling points of surface water are located along two streams: Nanyang river and Gaolan river; those of groundwater are located in two springs within two caves: Xiangshui Cave and Xianglong Cave. Before use, each sample bottle was cleaned with distilled water in lab, and rinsed with groundwater at least three times.
Each sample was divided into two parts. One part was reserved for chemical analysis, and the other for isotopic analysis. Once collected, the samples for chemical analysis were pumped by a handheld vacuum pump through a cellulose nitrate membrane filter with pore size of 0.45µm. The samples for isotopic analysis were acidified to pH<2.0 by adding a few drops of HNO3.
Every sample was transferred to the lab in high-density 50mL polypropylene bottles. The bottles were sealed tightly, such that no trapped air contacts with the sample. After arriving at the lab, the bottles were stored 4℃ in a refrigerator, waiting for chemical and isotopic analyses.
The bicarbonate and carbonate of the water were measured in situ through standard titration. With a portable device (Eureka Instruments, Manta2), the physical parameters of the samples were also measured in situ, including pH, redox potential (Eh; mV), temperature (T; ℃), and electrical conductivity (EC; µS/cm), after being calibrated by standard solutions. The results of the field measurements are listed in Table 1.
Table 1. Elevation, hydrochemistry data and isotopic composition (δ18O and δD) of water samples in Xiangxi river basin
|
Sub-basins |
Sample No. |
Sampling site |
Elevation |
Sampling season |
δD(‰) |
δ18O(‰) |
d-excess |
T |
pH |
EC |
|
(m) |
V-SMOW |
℃ |
μS/cm) |
|||||||
|
Nanyang river basin |
NY01 |
Muyu |
1310 |
summer |
-68.13 |
-10.07 |
12.43 |
11.10 |
8.2 |
172.8 |
|
winter |
-70.22 |
-10.29 |
12.06 |
7.89 |
8.45 |
172.8 |
||||
|
NY02 |
Dangyang |
1090 |
summer |
-62.75 |
-9.47 |
13.01 |
14.50 |
8.37 |
173.8 |
|
|
winter |
-65.44 |
-9.76 |
12.61 |
8.77 |
8.55 |
199.2 |
||||
|
NY03 |
Honghua |
855 |
summer |
-64.99 |
-9.88 |
14.05 |
14.00 |
8.07 |
144.3 |
|
|
winter |
-67.05 |
-9.98 |
12.77 |
8.53 |
8.46 |
195.8 |
||||
|
NY04 |
Chaoshui |
815 |
summer |
-61.10 |
-9.04 |
11.22 |
17.80 |
8.25 |
161.5 |
|
|
winter |
|
|
|
|
|
|
||||
|
NY05 |
Sandui |
645 |
summer |
-62.35 |
-9.31 |
12.13 |
17.40 |
7.90 |
168.2 |
|
|
winter |
-66.92 |
-9.94 |
12.61 |
8.92 |
8.24 |
196.6 |
||||
|
NY06 |
Cangping |
485 |
summer |
-63.00 |
-9.16 |
10.28 |
15.80 |
8.12 |
159.6 |
|
|
winter |
-65.69 |
-9.94 |
13.80 |
9.20 |
8.36 |
211.8 |
||||
|
NY07 |
Baisha |
205 |
summer |
-60.12 |
-8.89 |
11.00 |
18.00 |
8.12 |
175.5 |
|
|
winter |
-64.30 |
-9.66 |
12.98 |
9.93 |
8.63 |
252.0 |
||||
|
NY08 |
Hekou |
295 |
summer |
-62.44 |
-9.17 |
10.92 |
22.10 |
8.45 |
236.0 |
|
|
winter |
|
|
|
|
|
|
||||
|
Gaolan river basin |
GL01 |
Anqiaol |
970 |
summer |
-59.29 |
-8.91 |
11.99 |
21.50 |
8.58 |
239.9 |
|
|
|
winter |
|
|
|
|
|
|
||
|
GL02 |
Anqiaor |
740 |
summer |
-61.08 |
-8.95 |
10.52 |
20.10 |
8.40 |
333.7 |
|
|
winter |
-63.34 |
-9.25 |
10.63 |
7.82 |
8.59 |
336.6 |
||||
|
GL03 |
Menjia |
740 |
summer |
-61.29 |
-9.22 |
12.47 |
19.70 |
8.27 |
342.5 |
|
|
winter |
-60.53 |
-8.93 |
10.95 |
7.82 |
8.44 |
342.1 |
||||
|
GL04 |
Taoyuan |
650 |
summer |
-59.26 |
-8.88 |
11.78 |
24.30 |
8.48 |
330.2 |
|
|
winter |
|
|
|
|
|
|
||||
|
GL05 |
Baiji |
585 |
summer |
-58.16 |
-8.61 |
10.72 |
26.90 |
8.56 |
324.3 |
|
|
winter |
|
|
|
|
|
|
||||
|
GL06 |
Kongzi |
665 |
summer |
-59.12 |
-8.74 |
10.80 |
21.50 |
8.33 |
353.3 |
|
|
winter |
-60.55 |
-8.95 |
11.05 |
8.36 |
8.52 |
350.1 |
||||
|
GL07 |
Shuiyue |
595 |
summer |
-55.84 |
-8.31 |
10.64 |
27.50 |
8.53 |
256.2 |
|
|
winter |
-59.09 |
-8.78 |
11.15 |
9.62 |
8.92 |
212.3 |
||||
|
GL08 |
Xuetang |
475 |
summer |
-54.81 |
-8.05 |
9.59 |
24.10 |
7.91 |
246.0 |
|
|
winter |
-57.96 |
-8.91 |
13.29 |
6.92 |
8.36 |
209.6 |
||||
|
GL09 |
Shijia |
190 |
summer |
-56.11 |
-8.37 |
10.85 |
24.80 |
8.17 |
348.2 |
|
|
winter |
-58.90 |
-8.71 |
10.79 |
12.70 |
8.64 |
334.9 |
||||
|
Underground streams |
XS01 |
Xiangshui Cave |
355 |
summer |
-62.83 |
-8.91 |
8.45 |
24.20 |
7.50 |
334.4 |
|
winter |
-54.87 |
-8.07 |
9.69 |
14.25 |
7.72 |
370.0 |
||||
|
XL01 |
Xianglong Cave |
390 |
summer |
-61.18 |
-9.05 |
11.22 |
14.30 |
7.37 |
326.1 |
|
|
winter |
-63.38 |
-9.52 |
12.76 |
14.10 |
7.86 |
347.8 |
||||
|
Sub-basins |
Sample No. |
Sampling site |
Elevation |
Sampling season |
hydrochemical type |
K+ |
Na+ |
Ca2+ |
Mg2+ |
HCO3- |
SO42- |
Cl- |
NO3- |
|
(m) |
|
mg/L |
|
|
|
|
|
|
|
||||
|
Nanyang river basin |
NY01 |
Muyu |
1310 |
summer |
HCO3-Ca·Mg |
0.49 |
n.a. |
21.99 |
10.75 |
122.04 |
8.03 |
4.86 |
0.61 |
|
winter |
HCO3-Ca·Mg |
0.38 |
0.11 |
24.81 |
16.06 |
152.55 |
7.16 |
4.47 |
0.46 |
||||
|
NY02 |
Dangyang |
1090 |
summer |
HCO3-Ca·Mg |
0.47 |
n.a. |
23.51 |
9.41 |
122.04 |
10.69 |
5.25 |
n.a. |
|
|
winter |
HCO3-Ca·Mg |
0.59 |
0.26 |
28.99 |
17.70 |
134.24 |
9.45 |
5.24 |
0.58 |
||||
|
NY03 |
Honghua |
855 |
summer |
HCO3-Ca·Mg |
0.60 |
0.04 |
24.99 |
10.19 |
128.14 |
10.20 |
4.85 |
0.81 |
|
|
winter |
HCO3-Ca·Mg |
0.57 |
0.36 |
28.69 |
16.15 |
122.04 |
10.59 |
6.00 |
0.69 |
||||
|
NY04 |
Chaoshui |
815 |
summer |
HCO3-Ca·Mg |
0.74 |
0.42 |
29.50 |
8.81 |
201.37 |
17.22 |
4.90 |
0.75 |
|
|
winter |
|
|
|
|
|
|
|
|
|
||||
|
NY05 |
Sandui |
645 |
summer |
HCO3-Ca·Mg |
0.65 |
n.a. |
30.23 |
10.61 |
140.35 |
13.84 |
4.86 |
n.a. |
|
|
winter |
HCO3-Ca·Mg |
0.43 |
0.21 |
29.12 |
16.19 |
128.14 |
10.35 |
5.65 |
0.64 |
||||
|
NY06 |
Cangping |
485 |
summer |
HCO3-Ca·Mg |
0.52 |
n.a. |
28.46 |
10.8 |
140.35 |
12.18 |
4.87 |
0.84 |
|
|
winter |
HCO3-Ca·Mg |
0.49 |
0.32 |
31.82 |
16.47 |
146.45 |
14.25 |
6.97 |
0.91 |
||||
|
NY07 |
Baisha |
205 |
summer |
HCO3-Ca·Mg |
0.70 |
0.41 |
31.49 |
10.95 |
143.40 |
16.62 |
5.35 |
1.04 |
|
|
winter |
CaMgHCO3SO4 |
0.52 |
0.60 |
35.97 |
19.57 |
158.65 |
39.96 |
19.88 |
1.59 |
||||
|
NY08 |
Hekou |
295 |
summer |
HCO3-Ca·Mg |
0.67 |
0.57 |
33.23 |
13.03 |
152.55 |
15.35 |
5.81 |
1.00 |
|
|
winter |
|
|
|
|
|
|
|
|
|
||||
|
Gaolan river basin |
GL01 |
Anqiaol |
970 |
summer |
HCO3-Ca·Mg |
1.03 |
1.09 |
30.15 |
14.90 |
164.75 |
13.59 |
6.17 |
0.65 |
|
|
|
winter |
|
|
|
|
|
|
|
|
|
||
|
GL02 |
Anqiaor |
740 |
summer |
HCO3-Ca·Mg |
1.14 |
0.46 |
44.49 |
22.67 |
219.67 |
27.52 |
5.16 |
1.30 |
|
|
winter |
HCO3-Ca·Mg |
0.84 |
0.35 |
75.10 |
28.51 |
213.57 |
19.51 |
5.42 |
0.91 |
||||
|
GL03 |
Menjia |
740 |
summer |
HCO3-Ca·Mg |
0.92 |
0.01 |
43.17 |
22.03 |
225.77 |
19.66 |
5.32 |
1.83 |
|
|
winter |
HCO3-Ca·Mg |
0.79 |
0.45 |
42.52 |
30.38 |
195.26 |
22.76 |
11.11 |
0.94 |
||||
|
GL04 |
Taoyuan |
650 |
summer |
HCO3-Ca·Mg |
1.04 |
1.01 |
41.01 |
22.17 |
201.37 |
33.65 |
5.23 |
1.01 |
|
|
winter |
|
|
|
|
|
|
|
|
|
||||
|
GL05 |
Baiji |
585 |
summer |
HCO3-Ca·Mg |
1.01 |
n.a. |
40.56 |
22.83 |
213.57 |
23.34 |
5.14 |
1.06 |
|
|
winter |
|
|
|
|
|
|
|
|
|
||||
|
GL06 |
Kongzi |
665 |
summer |
HCO3-Ca·Mg |
0.91 |
0.02 |
44.08 |
24.28 |
219.67 |
29.13 |
5.09 |
1.18 |
|
|
winter |
HCO3-Ca·Mg |
0.86 |
0.61 |
41.45 |
29.52 |
158.65 |
24.66 |
4.96 |
0.99 |
||||
|
GL07 |
Shuiyue |
595 |
summer |
HCO3·SO4-Ca·Mg |
2.99 |
1.39 |
31.61 |
12.03 |
128.14 |
39.25 |
9.04 |
1.27 |
|
|
winter |
HCO3·SO4-Ca·Mg |
1.97 |
1.757 |
30.63 |
14.22 |
115.94 |
30.79 |
5.75 |
1.28 |
||||
|
GL08 |
Xuetang |
475 |
summer |
HCO3·SO4-Ca·Mg |
1.96 |
2.23 |
30.27 |
9.20 |
91.53 |
49.82 |
5.91 |
n.a. |
|
|
winter |
HCO3·SO4-Ca·Mg |
1.41 |
2.05 |
30.41 |
10.83 |
85.43 |
51.56 |
5.20 |
1.23 |
||||
|
GL09 |
Shijia |
190 |
summer |
HCO3-Ca·Mg |
1.23 |
1.01 |
42.08 |
22.18 |
201.37 |
30.57 |
6.23 |
1.71 |
|
|
winter |
HCO3-Ca·Mg |
1.22 |
1.54 |
41.45 |
28.02 |
164.75 |
22.59 |
5.98 |
1.56 |
||||
|
Underground streams |
XS01 |
Xiangshui Cave |
355 |
summer |
HCO3-Ca·Mg |
0.90 |
0.50 |
45.19 |
18.27 |
213.57 |
18.45 |
6.97 |
n.a. |
|
winter |
HCO3-Ca·Mg |
0.99 |
0.87 |
86.31 |
30.56 |
244.08 |
39.29 |
5.35 |
1.06 |
||||
|
XL01 |
Xianglong Cave |
390 |
summer |
HCO3-Ca |
0.61 |
0.90 |
62.31 |
6.10 |
225.77 |
23.81 |
5.63 |
2.03 |
|
|
winter |
HCO3-Ca |
0.62 |
0.57 |
98.38 |
10.34 |
225.77 |
22.59 |
6.26 |
1.37 |
2.3 Isotopic and chemical analyses
The isotopic and chemical analyses were carried out in the State Key Laboratory of Biological and Environmental Geology, China University of Geosciences, Wuhan. The cations were measured by an inductively coupled plasma-atomic emission spectrometer (ICP-OES; Thermo Fisher iCAP6300), and the anions were measured by an ion chromatographer (IC; Dionex 120).
The stable isotope composition of water was reported with reference to the Vienna Standard Mean Ocean Water (V-SMOW). Specifically, the δ18O and δD in the samples were measured at the MLR Key Laboratory of Karst Dynamics, Guilin, using a liquid water isotope analyzer (LWIA-24d, Los Gatos) with a precision of 0.2‰ for δ18O and of 0.6‰ for δD.
The ratios of the stable isotopes were reported in ‰ using the conventional notations:
${{\delta }^{18}}{{O}_{V-SMOW}}(\%_{0})\text{=}\left( \frac{{}^{18}O/{}^{16}{{O}_{sample}}}{{}^{18}O/{}^{16}{{O}_{s\tan dard}}}-1 \right)\times 1000$
${{\delta }^{2}}{{H}_{V-SMOW}}(\%_{0})\text{=}\left( \frac{{}^{2}H/{}^{1}{{H}_{sample}}}{{}^{2}H/{}^{1}{{H}_{s\tan dard}}}-1 \right)\times 1000$
3.1 Geochemical features
Table 1 presents the stable isotopes and chemical compositions of the collected samples. It can be seen that, all samples were weakly alkaline (pH=7.37-8.92) with pH varying from 7.37 to 8.58 in summer, and from 7.72 to 8.92 in winter, respectively; the temperature ranged between 11.1℃ and 27.5℃ in summer, and between 6.9℃ and 14.25℃ in winter; the EC value varied from 144.3μs/cm to 479.7μs/cm in summer, and from 172.8 μs/cm to 370.0 μs/cm in winter, which is positively correlated with main-ions gross (r2=0.69). The EC values of samples from Gaolan River were generally higher than those of the samples from Nanyang River.
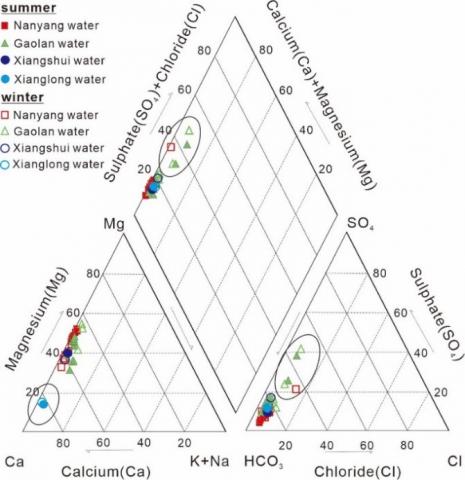
As shown in Table 1 and Figure 2, the more than 90% of the cations in the samples from Xiangxi River Basin are Ca2+and Mg2+; the Na+ and K+ contents are relatively low. HCO3- is the most abundant anion, followed by SO42- and Cl-; NO3- is the least abundant anion.
Overall, the collected samples are simple in hydrochemistry: most samples belong to the HCO3-Ca·Mg type, and some belong to HCO3-Ca type and HCO3·SO4-Ca·Mg type. These ions originate from the weathering of the calcite and dolomite bedrock.
In addition, the samples from the two streams differed sharply in hydrochemistry with those from the two caves. The difference is clearly illustrated with a piper plot (Figure 2), a single four-sided diagram presenting the main ions of water chemistry [21].
Judging by the composition of main ions, most samples from the two streams belong to HCO3-Ca·Mg type; only one sample from Nanyang River and four from Gaolan River belong to HCO3·SO4-Ca·Mg type. This means some of these samples are affected by human activities.
As for groundwater samples, the samples from Xiangshui Cave and Xianglong Cave belong to HCO3-Ca·Mg type and HCO3-Ca type, respectively, indicating that the groundwater from Xianglong Cave was controlled by the weathering of calcite bedrock.
Figure 2. The piper plot on hydrochemistry data
Note: The cation and anion contents are plotted on the two trilinear diagrams, and the points on the piper diamond are obtained by extrapolation.
3.2 Hydrogen and oxygen isotope compositions
The results of isotopic analysis (Table 1) show greatly fluctuations in δ18O and δD in the collected samples. For the samples from Nanyang River, the δ18O and δD varied within [-68.13‰, -60.12‰] and [-10.07‰, -8.89‰] in summer, and within [-70.22‰, -64.30‰] and [-10.29‰, -9.66‰] in winter, respectively.
For the samples from Gaolan River, the δ18O and δD varied within [-61.29‰, -54.81‰] and [-9.22‰, -8.05‰] in summer, and within [-63.34‰, -57.96‰] and [-9.25‰, -8.71‰] in winter, respectively.
For the samples from the two caves, the δ18O and δD varied within [-8.91‰, -62.83‰] and [-9.05‰, -61.18‰] in summer, and within [-8.07‰, -54.87‰] and [-9.52‰, -63.38‰] in winter, respectively.
These variations are the result of the hydrological features of the tributary catchments: The water level is affected by the seasonal variation of meteoric recharge. The seasonal variations of δ18O (δD) in Xiangxi River Basin obey different laws in dry and wet seasons.
4.1 δ18O and δD variations in streams and springs
The δD content has a linear relationship with the δ18O content. In 1961, Harmon Craig discovered the global correlation between δD and δ18O in fresh water, and defined the δD-δ18O relationship in fresh surface water with the global meteoric water line (GMWL): δD=8δ18O+10 [22]. Rozanski et al. [23] evaluated the massive data collected by the International Atomic Energy Agency (IAEA) over the last three decades, and thus complemented the GMWL as δD=(8.17±0.06)δ18O+(10.56±0.65)%D.
The GMWL is essentially the global average of many local meteoric water lines (LMWLs), each controlled by local climatic factors like the origin of the vapor mass, secondary evaporation during precipitation, and the seasonality of precipitation. These local factors affect both the deuterium excess and the slope. In this paper, the meteoric water line of Yichang area [24] is chosen as the LMWL (δD=8.4δ18O+15).
Figure 3. The δD -δ18O relationships of the collected samples, the GMWL [22], and the LMWL of Yichang area [24]
As shown in Figure 3, the δ18O and δD distributions in the samples from Nanyang River and Gaolan River were similar to the LMWL, suggesting that the stream waters are of meteoric origin. According to the variations in δ18O and δD, the surface water samples come from different precipitation or recharge events. The δD-δ18O relationship in the samples of the two streams can be defined by the following least squares (LS) regression equations: δD=9.13δ18O+24.08 (Ganlan River, winter, r2=0.94, n=6); δD=5.66δ18O-9.44 (Ganlan River, summer, r2=0.88, n=9); δD=8.23δ18O+13.38 (Nanyang River, winter, r2=0.80, n=6); δD=5.66δ18O-10.02 (Nanyang River, summer, r2=0.89, n=8). In general, evaporation causes the differential increase in the δ18O and δD of the remaining water, causing the slope of the linear δD-δ18O relationship to be slower than that of the LMWL [10].
The δ18O and δD of the samples from the two streams had obvious differences in spatial distribution. Gaolan River had much higher δ18O and δD than Nanyang River. Generally, the δ18O and δD contents of stream water are mainly affected by the sources of recharge and evaporation [25]. Most samples from Nanyang River are clustered to the left of the LMWL, while most samples from Gaolan River are clustered to the lower right of the LMWL. The samples above and below the LMWL are mostly influenced by the enhanced moisture recycling and enhanced moisture loss, respectively [26]. In particular, the greater the distance from the GMWL, the greater the evapotranspiration. Therefore, the isotopic differences of the tributary catchments mainly stem from hydrological conditions.
The seasonal variations of δ18O and δD in stream water are also depicted in Figure 3. In summer, the regression lines of the two tributary catchments had smaller slope and higher intercept than the LMWL, and their slopes were both 5.66. Hence, the two streams bear resemblances in the effect of evaporation and/or different sources of moisture, as well as the degree of evaporation. Besides, some evaporation must have taken place in the two catchments before or after the stream water is recharged. In winter, the regression line of Gaolan River had slightly higher slope (9.13) and lower intercept than the LMWL, indicating that the river is more affected by precipitation than evaporation in winter; the regression line of Nanyang River had similar slope as the MLWL, revealing that this river does not undergo evaporation in winter.
Overall, the regression lines of the samples from the two rivers in winter were steeper than those in summer. This might be attributed to the low ambient temperature, limited precipitation, and negligible evaporation in winter, and the high ambient temperature, abundant precipitation, and intense evaporation, and/or secondary evaporation of raindrops beneath the cloud base in summer [27]. The secondary evaporation in summer is also supported by deuterium excess (d-excess) discussed in the next subsection.
4.2 d-excess features
Dansgaard [27] was the first to use d-value to characterize the d-excess in global precipitation. The d-excess is defined for a slope of 8, and calculated from any precipitation sample by: d=δD-8δ18O. As a comprehensive indicator of meteoric precipitation [28], d-excess has been widely used to measure how much the water vapor from different sources contribute to the atmosphere at a specific location [29]. It provides a better yardstick of the secondary evaporation effect than δ18O [2]. If the source region has a low humidity, the enhanced kinetic evapotranspiration will reduce the slope of the δD-δ18O regression line (<8) and increase the d-excess in the resulting precipitation (Clark and Fritz, 1997). If the source region has a high humidity, the precipitation will make the δD-δ18O regression line closer to the GMWL [22] (slope of 8) and push d-excess close to 10.
From the data on the collected samples (Table 1), the d-excess ranged from 8.45‰ to 14.05‰ in summer, and from 9.64‰ to 13.80‰ in winter. In particular, the d-excess of most samples varied from 10‰ to 13‰. The d-excess in the upstream samples of Nanyang River was above 12‰ in summer, significantly higher than that in the samples from any other part of the study area, and also departed from the LMWL. This is because the heavy evaporation in summer tilted the balance between the isotopes, suppressing the δD and δ18O. In addition, the strong convection in summer, coupled with the drastic change of elevation between mountains, amplifies precipitation and greatly reduces and δD and δ18O [30]. The d-excess in the upstream samples of Nanyang River was also greater than 12‰ in winter, higher than that in any other sample, and deviated from the LMWL. Unlike in summer, the regional d-excess difference was small, due to the limited precipitation in winter.
The surface water samples from different reaches and the groundwater samples carried different regional features: (1) The upstream of Xiangxi River Basin is mainly controlled by the meteoric precipitation in SNFP, as well as the mountainous terrain and low temperature in the upstream of Nanyang River. During the sampling period, the water samples were affected by the relatively small humidity and non-equilibrium evaporation in the process of precipitation. (2) In summer, the d-excess of the upstream samples from Gaolan River was higher than 10.5‰, a sign of intense evaporation in the upstream during the sampling period. (3) In general, the d-excess of groundwaters remained low, and showed a high degree of exchange [28], which could result from the water-rock interaction that makes oxygen isotope exchange easier in karst area than in non-karst area.
Xiangshui Cave, an outlet of underground river, is the discharge point of groundwater with a low d-excess (8.45‰), owing to the water-rock interaction and intense exchange of oxygen isotope in karst area. From recharge area to discharge area, a low d-value means a long runoff channel, a long detention time, and a high similarity in geological conditions. Moreover, the d-excess of Xianglong Cave, the other outlet of underground river, was 11.22‰. This is close to the d-excess of the same area. A possible reason is that the short runoff channel and fast velocity of groundwater keep the d-excess immune to the changes in factors like season and latitude. However, the d-excess of Xiangshui Cave (9.69‰) and Xianglong Cave (12.76‰) in winter was close to that in summer, indicating that the karst water-rock interaction in underground rivers is independent of seasonal changes.
In summary, the upstream samples from Nanyang River and Gaolan River had marked differences in d-excess. Regional d-excess difference originates from different factors in upstream, midstream, and downstream. In the upstream, the water is mainly affected by the difference in moisture source; in the midstream and downstream, the water is recharged by surface water and groundwater from different sources through runoff channels.
In middle stream and downstream, it is recharged with surface and underground water from different sources through runoff way, recharge water sources of several periods in upstream of Xiangxi River Basin, and evaporation.
4.3 Elevation effect
The large elevation change in the study area might affect the distribution of hydrogen and oxygen isotopes [2, 9, 27, 31]. In high-elevation areas, the average temperature tends to be low, and precipitation will deplete isotopically [32].
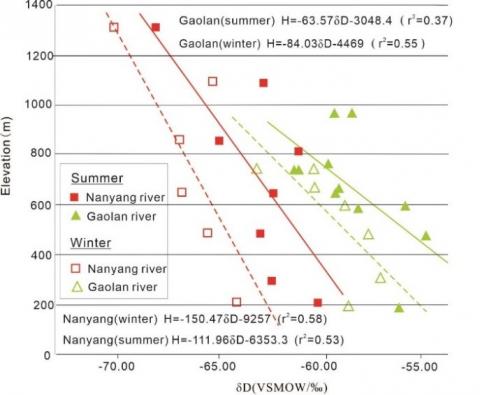
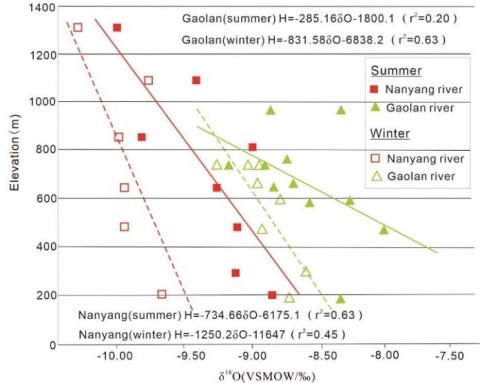
From the isotopic compositions of the collected samples, the mean elevation effect on the δ18O and δD in the samples from Gaolan River was -0.35‰, and -1.57‰ per 100m change in elevation in summer, and -0.12‰, and -1.19‰ per 100m change in elevation in winter, respectively; the mean elevation effect on the δ18O and δD in the samples from Nanyang River was -0.14‰ and -0.89‰ per 100m change in elevation in summer, and -0.08‰ and -0.66‰ per 100m change in elevation in winter, respectively. The regression lines of all the collected samples displayed a relatively good correlation, indicating that the isotopic gradient is not only affected by the common precipitation source, but also by the geographic location of sampling points.
As shown in Figure 4, the δD and δ18O of the samples from Nanyang River and Gaolan River demonstrate an obvious elevation effect. The two river catchments differ greatly in elevation change: the elevation difference of Gaolan River is 1,100m, and that of Nanyang River is 2,300m. The vegetation cover of the two catchments is also different. These differences lead to the disparity in local climates, and magnify the elevation effect on δD and δ18O of meteoric precipitation, surface water, and groundwater.
Because of the elevation effect, the δD and δ18O of the samples from the two tributary catchments differed in the decrement with the growing elevation in the same season. Thus, the two catchments have different hydrological processes. In the same catchment, the variation ranges of δD and δ18O varied from season to season. It can be seen that the δD and δ18O in the study area are impacted by both elevation effect and seasonal effect.
Figure 4. The elevation effect on δD and δ18O in the surface water samples
4.4 Downstream changes in δD, δ18O, and d-excess, and seasonal effects
4.4.1 Catchment of Nanyang River
The upstream of the Nanyang River is located in the SNFP, which features thick vegetation and large elevation change. As shown in Figure 5, the isotope values of the samples from Nanyang River gradually increased from upstream to downstream.
(1) δ18O and δD
In summer, the δ18O of some upstream samples ranged widely, especially from the measuring points of Muyu (-10.07‰) to Chaoshui (-9.04‰). Considering the lack of large estuaries, it is learned that the variation in δ18O is not merely affected by latitude and evaporation. Moreover, the water source of Honghua and Muyu is apparently different from that of Dangyang and Chaoshui. Hence, the water source of Honghua include precipitation or groundwater recharged by the water at high elevation. In the midstream and downstream, the river flow gradually increases, and the groundwater in the catchment flows into the river. Then, the water from difference sources mix well. This, plus a certain amount of evaporation, stabilizes the variation of δ18O in the midstream and downstream.
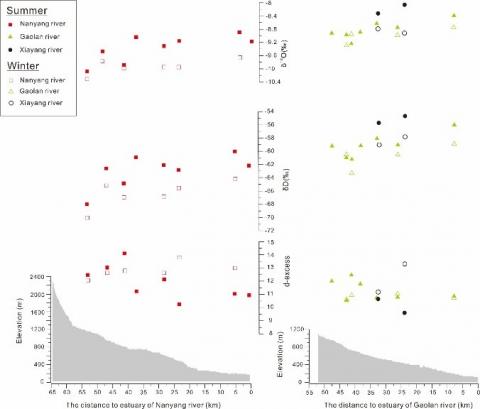
Figure 5. The variations in δD, δ18O, and d-excess of downstream samples from Nanyang River and Gaolan River
In winter, the δ18O of some upstream samples are lower than that in summer. In the upstream of Nanyang River, that is, the river segment fo Muyu (-10.29‰) –Dangyang (-9.76‰) – Honghua (-9.98‰), the trend and range of δ18O variation were consistent with those in summer. In the midstream and downstream, the δ18O was always lower than that at Dangyang, and the variation range of δ18O was narrower than that in summer. This means groundwater is a larger recharge source of the downstream than any other source in winter.
On the whole, the δD of the samples from Nanyang River increased from upstream to downstream. The trend and range of δD variations were more stable than those of δ18O. In addition, a strong seasonal effect can be observed from the fact that the δD of samples in winter was generally lower than that in summer.
(2) d-excess
In summer, the d-excess of all samples from Nanyang River fell between 10.28‰ and 14.05‰. The d-excess in the upstream surpassed 12‰ and continued to increase. By contrast, the d-excess in the midstream and downstream fell short of 12.13‰, and minimized at 10.28‰. Moreover, the d-excess in the midstream and downstream decreased with the distance to estuary: d-excess was 11.22% at Chaoshui, grew to 12.13‰ at Sandui, then plunged to 10.28%, and gradually rebounded in the estuary area.
In winter, the d-excess of all samples from Nanyang River ranged from 12.06‰ to 13.80‰, exhibiting a growing trend from upstream to downstream. This trend is not consistent with that in summer. Therefore, the δD and δ18O in winter are affected by few simple factors, due to the limited precipitation in the dry season.
4.4.2 Catchment of Gaolan River
(1) δ18O and δD
Gaolan River has two main tributaries: Kongzi River and Xiayang River. In summer, the δ18O of the upstream samples from Kongzi River fluctuated more violently than that in those from the other tributary (Figure 5). Thus, the small tributaries have different water sources. Located at the confluence of the upstream tributaries, Menjia sampling point recorded a δ18O of -9.22‰. In the midstream and downstream, the δ18O steadily increased except at Kongzi sampling point. Hence, the river in this segment is mainly controlled by latitude effect and evaporation. As for the sample from Kongzi River, δ18O decreased abruptly on account of groundwater recharge. The δ18O of the samples from Xiayang River were -8.31 ‰ and -8.05 ‰, respectively, way higher than that in Kongzi River. It is obvious that the two small tributaries have different impact factors like topography, landform, and regional climate, apart from latitude effect and evaporation.
In winter, the δ18O of the samples increased from the upstream to downstream. Due to the limited precipitation in winter, the δ18O in some samples from Gaolan River manifests that the water is recharged mainly by groundwater. The δ18O of winter samples were generally smaller than that of summer samples, which is clearly the result of seasonal effect.
On the whole, the δD of the samples from Gaolan River followed the same trend as the δ18O.
(2) d-excess
The d-excess of all samples from Gaolan River ranged from 9.59 ‰ to 12.47 ‰ in summer and from 10.63 ‰ to 13.29 ‰ in winter.
In summer, the d-excess of upstream samples from Kongzi River had a wide variation with no obvious distribution, reflecting that the upstream water sources are diverse, especially in hydrologic cycle. In the midstream and downstream, the d-excess of the samples varied in a small range, which signifies a small difference in recharge source. The convergence of d-excess comes from the mixing between surface water and the recharging groundwater. The other tributary, Xiayang River, had a consideration difference from Kongzi River, in d-excess. Besides hydrochemistry type and geological background, the main reason for the difference lies in the catchment feature that induce the differences between the two river basins in hydrologic cycle and hydrological process. These two factors directly bear on the d-excess of water.
In winter, the d-excess of the samples from Kongzi River did not change obviously along the river direction, suggesting that the δD in winter is affected by few simple factors, due to the limited precipitation in the dry season. For Xiayang River, the d-excess trend and distribution were sharply different from those of Kongzi River. Therefore, geological background and catchment feature can directly influence the d-value of water.
The stable isotope values in stream water in the Xiangxi River Basin varied significantly, for the water is affected by the seasonable variation in meteoric precipitation induced by the hydrological features. The δ18O (δD) in the study area fluctuated distinctive between summer and winter, which may be the low ambient temperature, limited precipitation, and negligible evaporation in winter, and the high ambient temperature, abundant precipitation, and intense evaporation, and/or secondary evaporation of raindrops beneath the cloud base in summer.
Because of the elevation effect, the δD and δ18O of the samples from the two tributary catchments differed in the decrement with the growing elevation in the same season. Thus, the two catchments have different hydrological processes. In the same catchment, the variation ranges of δD and δ18O varied from season to season. It can be seen that the δD and δ18O in the study area are impacted by both elevation effect and seasonal effect.
In the downstream of Nanyang River and Gaolan River, there were seasonal differences in δ18O, δD, and d-value, indicating the difference between the two catchments in control factors like latitude effect, evaporation, and the mixing of different water sources. The two catchments have different hydrologic cycles and hydrological processes in different seasons, as evidenced by the factors of evaporation, precipitation, and groundwater recharge.
The research work was funded by National Natural Science Foundation of China (Grant No.: 41301548), China Postdoctoral Science Foundation funded project (Grant No.: 2013M531760), the Fundamental Research Funds for the Central Universities, China University of Geosciences (Wuhan) (Grant No.: CUG120819) and Investigation and Evaluation of Resource Environmental Bear Capacity in Yichang (DD20190315). The authors would like to thank Liu Shipeng and Wang Zhenhua for water sampling and Wu Xia for technical assistance and analysing the samples for δ18O and δD in the Karst Dynamics Laboratory, MLR and GZAR., respectively.
[1] International Atomic Energy Agency. (1980). Arid zone hydrology: Investigations with isotope techniques. Proceeding of an Advisory Group Meeting.
[2] Jeelani, G.H., Bhat, N.A., Shivanna, K. (2010). Use of δ18O tracer to identify stream and spring origins of a mountainous catchment: A case study from Liddar watershed, Western Himalaya, India. Journal of Hydrology, 393(3-4): 257-264. https://doi.org/10.1016/j.jhydrol.2010.08.021
[3] Han, G., Lv, P., Tang, Y., Song, Z. (2018). Spatial and temporal variation of H and O isotopic compositions of the Xijiang River system, Southwest China. Isotopes in Environmental and Health Studies, 54(2): 137-146. https://doi.org/10.1080/10256016.2017.1368507
[4] England, N., James, A.L., Chutko, K.J., Pyrce, R.S., Yao, H. (2019). Hydrologic and water isotope characterization of a regulated Canadian Shield river basin. Hydrological Processes, 33(6): 905-919. https://doi.org/10.1002/hyp.13371
[5] Deng, K., Yang, S., Lian, E., Li, C., Yang, C., Wei, H. (2016). Three Gorges Dam alters the Changjiang (Yangtze) river water cycle in the dry seasons: Evidence from HO isotopes. Science of the Total Environment, 562: 89-97. https://doi.org/10.1016/j.scitotenv.2016.03.213
[6] Fröehlich, K., Gibson, J.J., Aggarwal, P. (2002). Study of environmental change using isotope techniques. In Proc. Int. Conf, 54-66.
[7] Dehaspe, J., Birkel, C., Tetzlaff, D., Sánchez-Murillo, R., Durán-Quesada, A.M., Soulsby, C. (2018). Spatially distributed tracer-aided modelling to explore water and isotope transport, storage and mixing in a pristine, humid tropical catchment. Hydrological Processes, 32(21): 3206-3224. https://doi.org/10.1002/hyp.13258
[8] Yang, K., Han, G., Liu, M., Li, X., Liu, J., Zhang, Q. (2018). Spatial and seasonal variation of O and H isotopes in the Jiulong River, Southeast China. Water, 10(11): 1677. https://doi.org/10.3390/w10111677
[9] Clark, I.D., Fritz, P. (1997). Environmental Isotopes in Hydrogeology. CRC press.
[10] International Atomic Energy Agency. (2001). Environmental isotopes in the hydrological cycle, principles and applications, Volume III: Surface water. In: Mook W (ed.). International Hydrological Programme, Technical Documents in Hydrology 39. Vienna: IAEA.
[11] Kumar, A., Sanyal, P., Agrawal, S. (2019). Spatial distribution of δ18O values of water in the Ganga river basin: Insight into the hydrological processes. Journal of Hydrology, 571: 225-234. https://doi.org/10.1016/j.jhydrol.2019.01.044
[12] Scheihing, K.W., Moya, C.E., Struck, U., Lictevout, E., Tröger, U. (2018). Reassessing hydrological processes that control stable isotope tracers in groundwater of the Atacama Desert (Northern Chile). Hydrology, 5(1): 3. https://doi.org/10.3390/hydrology5010003
[13] Uribe, J., Muñoz, J.F., Gironás, J., Oyarzún, R., Aguirre, E., Aravena, R. (2016). Erratum: Assessing groundwater recharge in an Andean closed basin using isotopic characterization and a rainfall-runoff model: Salar del Huasco basin, Chile. Hydrogeology Journal, 24(4): 1067-1068. https://doi.org/10.1007/s10040-016-1383-1
[14] Brunner, P., Therrien, R., Renard, P., Simmons, C.T., Franssen, H.J.H. (2017). Advances in understanding river-groundwater interactions. Reviews of Geophysics, 55(3): 818-854. https://doi.org/10.1002/2017rg000556
[15] Hao, S., Li, F., Li, Y., Gu, C., Zhang, Q., Qiao, Y., Zhu, N. (2019). Stable isotope evidence for identifying the recharge mechanisms of precipitation, surface water, and groundwater in the Ebinur Lake basin. Science of the Total Environment, 657: 1041-1050. https://doi.org/10.1016/j.scitotenv.2018.12.102
[16] Gibson, J.J., Edwards, T.W.D., Birks, S.J., St Amour, N.A., Buhay, W.M., McEachern, P., Peters, D.L. (2005). Progress in isotope tracer hydrology in Canada. Hydrological Processes: An International Journal, 19(1): 303-327. https://doi.org/10.1002/hyp.5766
[17] Beal, L.K., Wong, C.I., Bautista, K.K., Jenson, J.W., Banner, J.L., Lander, M.A., van Oort, N.H. (2019). Isotopic and geochemical assessment of the sensitivity of groundwater resources of Guam, Mariana Islands, to intra-and inter-annual variations in hydroclimate. Journal of Hydrology, 568: 174-183. https://doi.org/10.1016/j.jhydrol.2018.10.049
[18] Li, Z., Gui, J., Wang, X., Feng, Q., Zhao, T., Ouyang, C., Shi, Y. (2019). Water resources in inland regions of central Asia: Evidence from stable isotope tracing. Journal of Hydrology, 570: 1-16. https://doi.org/10.1016/j.jhydrol.2019.01.003
[19] Liu, H.Y., Chen, B.L., Wen, D.S. (2007). The Characteristics and Distribution Pattern of Karst Water in Western Hubei. Resources Environment & Engineering, 2.
[20] Jiang, M., Deng, H., Cai, Q., Wu, G. (2005). Species richness in a riparian plant community along the banks of the Xiangxi River, the Three Gorges region. The International Journal of Sustainable Development & World Ecology, 12(1): 60-67. https://doi.org/10.1080/13504500509469619
[21] Piper, A.M. (1944). A graphic procedure in the geochemical interpretation of water-analyses. Eos, Transactions American Geophysical Union, 25(6): 914-928. https://doi.org/10.1029/TR025i006p00914
[22] Craig, H. (1961). Isotopic variations in meteoric waters. Science, 133(3465): 1702-1703. https://doi.org/10.1126/science.133.3465.1702
[23] Rozanski, K., Araguás-Araguás, L., Gonfiantini, R. (1993). Isotopic patterns in modern global precipitation. GMS, 78: 1-36. https://doi.org/10.1029/GM078p0001
[24] Zhao, J.C., Wei, B.H., Xiao, S.B. (2009). Stable isotopic characteristics of atmospheric precipitation from Yichang, Hubei. Tropical Geography, 29(6): 526-531.
[25] Kendall, C.C. (2001). Distribution of oxygen-18 and deuterium in river waters across the United States. Hydrological Processes, 15(7): 1363-1393. https://doi.org/10.1002/hyp.217
[26] Froehlich, K., Gibson, J.J., Aggarwal, P.K. (2002). Deuterium excess in precipitation and its climatological significance (No. IAEA-CSP--13/P).
[27] Dansgaard, W. (1964). Stable isotopes in precipitation. Tellus, 16(4): 436-468. https://doi.org/10.3402/tellusa.v16i4.8993
[28] Yin, G., Ni, S.J., Zhang, Q.C. (2001). Deuterium excess parameter and geohydrology significance. Journal-Chengdu University of Technology, 28(3): 251-254.
[29] Peng, H., Mayer, B., Harris, S., Krouse, H.R., (2004). A 10-year record of stable isotope compositions of hydrogen and oxygen in precipitation at Calgary, Alberta, Canada. Tellus 56B, 147-159.
[30] Wu, Y.Z., Wan, J.W., Lin, Y. (2011). Characteristics of hydrogen and oxygen isotopes for precipitation in Xiling Gorge Region of Yichang, Hubei Province. Geological Science and Technology Information, 3.
[31] Ingraham, N.L., Taylor, B.E. (1991). Light stable isotope systematics of large-scale hydrologic regimes in California and Nevada. Water Resources Research, 27(1): 77-90. https://doi.org/10.1029/90WR01708
[32] Jayne, R.S., Pollyea, R.M., Dodd, J.P., Olson, E.J., Swanson, S.K. (2016). Spatial and temporal constraints on regional-scale groundwater flow in the Pampa del Tamarugal Basin, Atacama Desert, Chile. Hydrogeology Journal, 24(8): 1921-1937. https://doi.org/10.1007/s10040-016-1454-3