Silvia Luciani | Gianluca Coccia* | Sebastiano Tomassetti | Mariano Pierantozzi | Giovanni Di Nicola
© 2020 IIETA. This article is published by IIETA and is licensed under the CC BY 4.0 license (http://creativecommons.org/licenses/by/4.0/).
OPEN ACCESS
During their lifetime, photovoltaic (PV) plants are subject to a normal degradation of their components, and they are consequently characterized by decrease of the expected production. In order to prevent and evaluate failures and loss of production, specific tests can be carried out on the PV modules. Non-destructive methods, such as visual inspection and infrared thermography, can be performed in order to determine production failures or defects on the PV modules. I-V curves allow to estimate the performance of photovoltaic modules and strings, estimating the deviation between the power of the examined module and that declared by the manufacturer. The aim of this work is to evaluate the efficiency loss of photovoltaic modules associated to specific defects, causing in a systematic way some faults on a set of brand-new modules and assessing the relative decrease of power. The set of brand-new photovoltaic modules, after being damaged, was experimentally characterized determining their I-V curves by means of an indoor solar flash test device based on a class A+ AM 1.5 solar simulator. Using the I-V curves as a dataset, it was possible to estimate the incidence of different defects on the power of the photovoltaic module being considered.
flash test, I-V curve, infrared thermography, bypass diode, hot-spot, crack
This work is an update of a previous paper on the determination of temperature and irradiance corrections of photovoltaic modules [1]. The year 2017 can be considered as a historic year for the photovoltaic sector. The solar photovoltaic capacity was almost twice respect to the other type of renewable energy, the wind power. From the year 2016 to the end of 2017 the cumulative global installed photovoltaic solar power capacity increased by over 32%, from 306.4 GW to 404.5 GW [2]. In the world, from 2007 to 2017, total photovoltaic capacity suffered an increase by over 4,300%. In 2007, the world’s total photovoltaic capacity was 9.2 GW. In 2017, a total of 99.1 GW of grid connected solar was installed. China dominated global solar market demand in 2017; in fact, China installed in one year more than half of the world's solar capacity (53.3%). In 2017, United States was classified as the world’s second largest PV market. The United States photovoltaic capacity decreased by over 42% from 2016 to 2017. United States installed 15.1 GW in 2016 against 10.6 GW in 2017. Europe left its several-year long downward trend in 2017, adding 9.2 GW, a 30% increase compared to the 7 GW installed in 2016. The European growth was due to Turkey's gigantic growth, adding 2.6 GW, from less than 1 GW in 2016. [2]. 414 MW of photovoltaic plants were installed in Italy, in 2017. In Italy, at the end of 2017, 19,682 MW resulted in exercise (with an increment of + 2.1% respect to 2016) and produced 24,378 GWh (+ 10.3% respect to 2016, due to better irradiation conditions). At the end of 2017, photovoltaic plants that have been installed in Italy were about 774,014, which cover a total power of 19,682 MW. Small PV plants, with power less than or equal to 20 kW, compose over 90% of the total PV systems installed in Italy and represent the 20% of the total national power. At the end of 2017, the average size of PV plants that were installed in Italy was equal to 25.4 kW. In the solar year 2017, about 44,000 plants, almost all characterized by a power lower than 200 kW, were installed in Italy [3].
During their lifetime, photovoltaic (PV) plants are subject to a normal degradation of their components, and they are consequently characterized by loss of power, with a decrease of the expected production [4]. In order to prevent and evaluate failures and loss of production, specific tests can be carried out on the different components of PV systems, and specifically on the PV modules. The first test to carry out with PV modules is represented by the visual inspection of the photovoltaic modules, in order to detect the presence of defects such as delamination, cells cracking, decoloring, or other phenomena that may conceal possible anomalies of operation.
Methods such as electroluminescence (EL), photoluminescence (PL) and infrared (IR) thermography allow to determine defects in solar cells and modules, which cannot be detected using other measurements. EL represents a valid method for detecting electrical inhomogeneities due to presence of dislocations, shunt failures, cracks or interrupted contacts. This technique allows to obtain images with high resolution and consequently it determines some defects more precisely than with IR measurements, but it does not allow to define the origin of some defects in detail. PL, instead, can be used to found defects or failures in the solar cell manufacturing process. IR thermography is a non-destructive measurement technique, which provides fast, real-time, and two-dimensional distributions of characteristic features of PV modules. The measurements can be performed during normal operation for both individual PV modules and as a scan of large-scale systems. It has to be assured that the measurement is carried out under steady state conditions of the PV module. IR thermography can be also used for diagnosing electrical failures and thermal anomalies (hot spots, hot areas, etc.) in photovoltaic modules, even with the system in operation. The diagnosis consists in detecting the temperature of the panels with a thermal imaging camera and subsequent processing of the thermograms acquired in the field to catalog the type of thermal anomaly, that is been detected on the analyzed module. If parts of the solar panel are hotter than others, the hot areas will show up in the thermal image. Depending on their shape and location, these hotspots and areas can identify different types of faults. If an entire module is hotter than normal, this can indicate interconnection problems. If specific cells or cell strings appear as a hot spot or a warmer "patchwork pattern", the cause can be found in a failure of the bypass diodes, internal shorts, and a decoupling of cells [5].
In literature, many published research studies reflected the increasing interest in the use of IR thermography measurements to detect faults on the PV modules. For instance, Schirripa et al. [6] presented a review of infrared thermography applied to PV systems and introduced the potentiality of IR thermography for the identification of possible differences between strings and the location of local hot spots. The authors proposed to consider the thermography as a routine test to perform periodically on the PV plants. Akram et al. [7] showed an improved outdoor infrared thermography scheme to detect defects in PV modules. This scheme was based on modulating the temperature of a PV module through altering electrical behavior of one PV cell in order to obtain different temperature conditions. Experiments were performed in indoor (dark) and outdoor (illumination) for both normal operating and defective PV modules. The indoor and outdoor IR measurements for normal operating modules showed similar results. For the modules with defects, the outdoor IR images did not show all defects, compared to indoor IR images. The outdoor IR images obtained with the improved outdoor thermography scheme provided clearer and detailed information about defects.
Along with the tests discussed so far, the so-called flash tests allow to assess the actual I-V (current-voltage) curve of a PV module [8]. I-V curves represent an important instrument to estimate the performance of strings and PV modules. In fact, from the comparison between I-V curves measured on-site and the I-V curves declared by the module manufacturer in the datasheet, it is possible to detect decreases of performance and to control the degradation of PV devices. On-site I-V curves are performed by means of commercial I-V curve tracers, based on the international standard IEC 60891 [9]. I-V curves, measured according to the provided operating conditions (OPCs), have to be translated into standard test conditions (STCs), consisting in a global irradiance (G) equal to 1,000 W/m2, and a module temperature (T) equal to 25℃. The correction at STC conditions is essential to estimate the deviation between the power of the examined module and the maximum power declared by the manufacturer. The international standard IEC 60891 [9] defines three different correction procedures; the second procedure is usually followed by most of commercial I-V curve tracers. The procedure is based on the simplified one-diode model of PV devices. It is defined by the following equations for current and voltage, respectively:
$I_{2}=I_{1}\left[1+\alpha_{\mathrm{rel}}\left(T_{2-} T_{1}\right)\right] \frac{G_{2}}{G_{1}}$ (1)
and
$V_{2}=V_{1}+V_{\mathrm{OC} 1}\left[\beta_{\mathrm{rel}}\left(T_{2-} T_{1}\right)+a \ln \left(\frac{G_{2}}{G_{1}}\right)\right]$
$-R_{\mathrm{s}}^{\prime}\left(I_{2-} I_{1}\right)-k^{\prime} I_{2}\left(T_{2}-T_{1}\right)$ (2)
where,
As can be shown by the analysis of some relevant studies found in literature, research mainly focused on the study of different techniques used to detect the PV modules anomalies and on the correlation between specific defects and the relative loss of production on PV modules.
Ebner et al. [10] studied and compared non-destructive techniques for quality control of PV modules: IR thermography, electroluminescence (EL) and photoluminescence (PL) imaging. In their work, a combination of IR, EL and PL characterization tools was shown with the aim to increase the number of detectable defects and to determine their origin. For EL investigations, a solar cell was operated as a light emitting diode. Due to recombination effects, the emitted radiation was detected with a sensitive CCD camera. The solar cells or modules were supplied with a defined external excitation current, while the camera took an image of the emitted photons. Damaged areas of a solar module appeared dark or shine less than areas without defects. In PL imaging systems, high-power lasers were used to generate excess charge carriers, and an InGaAs-CCD camera worked as detector. IR measurements were performed with an external current or by applying light. Thermography imaging was performed by means of a portable, uncooled IR-camera.
Gallardo-Saavedra et al. [11] performed an experimental study on the different techniques used for nondestructive characterization of solar PV cells defects: EL, IR thermography, I-V curves and visual tests. In their work, a 60-cell polycrystalline module was manufactured ad hoc, with different defective and non-defective cells. All cells were accessible from the backside of the module and the module included similar kinds of defects in the same bypass string. Manufacturing, soldering and breaking cell defects and their different combination and correlation were studied. In relation with the manufacturing defects, it was seen that the most complete inspection technique is the I-V characterization. Soldering defective cells presented smaller parameter deviations than the rest of defects studied, with local soldering defects presenting the highest losses. As concerns broken cells, the authors noted that the shape of the I-V curves of the affected cells was very similar to the one of the nominal equivalent cells, but current decreased proportionally.
In their work, Munoz et al. [12] presented some evaluations on a PV plant, consisting in visual inspection, I-V curves field measurements, thermal evaluations by IR imaging and measurements of the I-V curves and thermal behaviors of modules in the plant, chosen in laboratory. The main detected defects that were described and discussed are: delamination, bubbles, cracks in cell, hot-spots, detachment of the frame.
Vodermayer et al. [13] presented an overview about the correlation between IR images of defective modules in the field and the associated electrical behavior. In this work, daily profiles with one-minute I-V curve measurements of different PV modules with thermal defects were produced under outdoor conditions. Continuous IR imaging and meteorological data sampling was realized. One representative PV module without thermal or electrical phenomena with average output power was additionally used as reference for every measurement. First, a PV module with one heated solar cell was detected in a PV plant using IR imaging and was studied in detail. The I-V curves of all 4 cell arrays that composed the module, the entire module and the reference module were measured. The measured I-V curves showed a significant power loss at the fourth cell array, where the heated solar cell was located. While the first three cell arrays showed only very little deviation among each other, the fourth cell array presented a clear decrease of the maximum power point (MPP) current. Then, a PV module with multiple heated solar cells was examined. In this module, there were several heated areas, and each single cell array contained at least one cell that has a higher temperature than the average temperature of the module. The power difference between the hottest and the least hot cell array was 18.3%. The authors demonstrated that a temperature delta of few degrees can influence the electrical behavior of the module.
Dalsass et al. [14] studied the correlation between the generated string power of a photovoltaic power plant and module defects detected using aerial thermography. Test objects were three PV power plants in northern Bavaria, Germany. For the aerial thermography, a remote-controlled octocopter with an extensive navigation system was used. Two lightweight cameras were installed on the octocopter, the IR camera Optris PI450 and the RGB camera GoPro Hero 3+. The monitoring data of the inverter were collected, and the incident solar irradiation was measured by the monitoring system of the PV plant. The radiometric IR data was analyzed manually. PV modules that were likely defective were localized and classified like: inactive strings, completely defective modules, inactive substrings within one module, and hotspots. The monitoring data of the inverter of the affected strings were analyzed. The logged data of these strings were compared to the logged data of their neighboring string. Correlation analyses between the identified module defects and the generated power of the associated strings were performed. Single hot spots with temperature differences smaller than 15℃ rarely affected the string energy generation. If a serious cell defect was detected, the short-term influence of the temporarily inactive substring caused a notable string power deviation. This deviation was clearly correlated with the quantity of inactive homogeneously heated substrings. Inactive heated substrings which had a patchwork pattern had similar deviation values as inactive homogeneously heated substrings but were characterized by considerably higher temperature differences.
As the discussed literature shows that clear correlations between electrical, mechanical and thermal defects in PV modules is still unclear, the aim of this work is to provide an estimation of the production loss that affects a PV module, associated to the presence of thermal defects or failures. The method proposed consists in causing, in a systematic way, typical faults and thermal defects on a set of brand-new PV modules, in order to assess the power decrease. The set of brand-new modules, after being damaged, was then experimentally characterized determining their I-V curves by means of an indoor solar flash test device based on a class A+ AM 1.5 solar simulator. Then, the thermal images of the damaged modules were acquired in order to perform a thermographic analysis of defects. Using the I-V curves and analyzing the power values of the tested modules and the thermal images, an estimation of the performance decrease related to each defect produced was provided.
The paper is structured as follows. Section 2 describes the technical specifications of the indoor solar flash test device, the set of tested modules, and the infrared camera used for acquiring thermal images. In Section 3, we will analyze the procedure followed to carry out the necessary measurements: the systematic creation of failures and thermal defects, and the flash-test tests on the modules that were damaged. The results of the study and their discussion are provided in Section 4. The main conclusions of the paper can be found in Section 5.
In the present work, tests were performed by means of an indoor solar flash test device based on a class A+ AM 1.5 solar simulator, made by BERGER Lichttechnik. The system consists of a pulsed solar simulator (PSS), a load and measuring device (pulsed solar load, PSL), an infrared (IR) detector, a Pt100 sensor, a computer with dedicated software for I-V curves acquisition, and a tower system. The PSS includes a power generator and a lamella light source without optical elements for homogenous and reproducible illumination. The device meets all the requirements of IEC 60904-9 [15], while the construction of the lamella light source and the patented flash tube ensure lifetime conformity with this standard. The PSL is a processor-controlled device with three channels, used for measuring and load simulation. It allows to determine the I-V curves of PV modules, according to IEC 60904-1 [16].
The IR detector is a contactless, infrared measuring system with an external sensor head that allows the automatic module temperature acquisition. The Pt100 sensor, instead, is a resistance temperature detector allowing the ambient and cell temperature acquisition. Through the PSL software, installed in the dedicated computer, all relevant data relative to I-V curves are acquired, stored and displayed. The tower system provides a stable test environment for improved uniformity and testing repeatability.
A specific set of five brand-new PV modules was selected. The modules belong to the same brand and have the same nominal power (240 W). They are characterized by 60 series-connected cells in polycrystalline silicon and consist of 3 cell arrays, each with 20 cells in series and one bypass diode per cell array in parallel. The main parameters of the PV modules can be found in Table 1 and 2.
Figure 1. Scheme of the solar simulator used to perform I-V analysis
Table 1. Electrical characteristics of the PV modules
|
Parameter |
Symbol |
Value |
|
Maximum power |
Pmax (W) |
240 |
|
Current at maximum power point |
Impp (A) |
7.78 |
|
Voltage at maximum power point |
Vmpp (V) |
30.86 |
|
Short circuit current |
Isc (A) |
8.24 |
|
Open circuit voltage |
Voc (V) |
37.56 |
|
Maximum System Voltage |
(V) |
1000 |
|
Module efficiency |
Eff (%) |
14.50 |
Table 2. Thermal characteristics of the PV modules
|
Parameter |
Symbol |
Value |
|
Maximum power temperature coefficient |
$\gamma$ (%/℃) |
-0.46 |
|
Open circuit voltage temperature coefficient |
$\beta$ (mV/℃) |
-133.8 |
|
Short circuit current temperature coefficient |
$\alpha$ (mA/℃) |
3.69 |
|
Nominal operating cell temperature |
NOCT (℃) |
44 |
|
Temperature range |
(℃) |
– 40 to 85 |
The thermal images of the tested modules were taken with a manual thermography camera, model FLIR T335. FLIR T335 is a small and light-weight infrared camera with excellent image quality, high sensitivity and a broad temperature range, generally used for maintenance professionals for finding electrical hot spots and faulty equipment. The main technical specifications of the infrared camera FLIR T335 can be found in Table 3.
Table 3. Imaging and optical data of infrared camera FLIR T335
|
Imaging and optical data |
|
|
IR resolution |
320 x 240 pixels |
|
Thermal sensitivity/ NETD |
< 0.05℃ @ +30℃ (+86℉) / 50 mK |
|
Field of view (FOV) / Minimum focus distance |
25°x19° / 0,4 m (1,31 ft.) |
|
Spatial resolution (IFOV) |
1.36 mrad |
|
Image frequency |
30 Hz |
|
Focus |
Automatic or manual |
|
Zoom |
1-4 × continuous, digital zoom, including panning |
|
Focal Plane Array (FPA) / Spectral range |
Uncooled microbolometer / 7.5 - 13 µm |
As a first step, the five brand-new modules, before being damaged, were subjected to a flash-test analysis in order to verify the accuracy of the technical data reported in the identification label. To determine all the I-V curves, each of the five tested modules was placed on a dedicated support inside the tower system. Each module was placed underneath the flasher, connected to the PSS. The measurement procedure starts with a flash test of the first module. Then, the PSL software shows the graphic representation of the tested module I-V curve at OPC conditions; in addition, the software displays the relative STC-translated I-V curve. The PSL software also provides a CSV file with all the current-voltage values of the two obtained I-V curves. The same procedure was repeated for the other four modules. For each PV module, 20 flash tests were carried out, and data related to I-V curves at OPC and STC conditions were acquired and collected.
In order to evaluate the effect of defects in the PV modules, in each brand-new module a typical defect or fault was specifically recreated. The failures that were replicated and studied are: one damaged bypass diode, two damaged bypass diodes, hotspot, cracked cell and damaged front glass module.
Bypass diodes are used in PV modules to protect them against issues that could derive from local defects. If a cell within a string of cells wired in series is shaded or damaged, bypass diode will limit the current production of that string and can cause a local thermal defect. A bypass diode mitigates this effect by allowing for an alternative current path. The main failure mode that is possible with bypass diode is failing in short. The column of cells associated with the damaged bypass diodes appears in IR images hotter than the two neighboring column cells. In this work, the damaged bypass diode was replicated by short-circuiting one of the three bypass diodes that composes the tested module. The failure was achieved by inverting the diode polarity, thus interrupting the current flow through the PV cells associated with the bypass diode. Similarly, the same procedure was also performed to disconnect two bypass diodes.
A hotspot is an area of a photovoltaic module that is characterized by a very high temperature and this overtemperature can damage an entire cell or any other elements of the module. Hotspot can be caused by partial shadowing, cell mismatch or defects in the interconnection between cells. In these cases, the cell can overheat so much that damages not only itself, but also the encapsulation material and the back sheet of the module. In this work, in order to simulate the overtemperature of a cell caused by a hotspot, the encapsulation material located on the back sheet of the PV cell was removed.
Any microcracks or cracks that affect one or more of the photovoltaic cells, can occur already during the modules transport and mounting processes; but these failures can also be caused by external mechanical effects. While the microcracks may still be negligible, cell crack can have effects on the performance of the whole module. In this work, a crack cell was obtained by damaging a module cell scratching its surface by means of a sharp object.
Frequently, PV modules can be affected by the complete breaking of their front glass surface. This phenomenon, that can be caused by transport operations, and in particular atmospheric conditions such as hailstorms or other factors, involves the reduction in the total output power generated by the module. In the present study, this failure was replicated by violently striking with a blunt instrument the module front glass surface, causing the complete shredding.
As a second step, the modules, after being damaged, were again placed underneath the flasher and the I-V curve of each module was determined in order to assess the power decrease.
In addition, IR images of the three modules, characterized respectively by one (two) damaged bypass diode (s) and hotspot were acquired, in order to identify the typical thermographic patterns associated to these defects.
The following section presents and discusses the results of the study. First, in order to verify the correctness of the technical data reported in the identification label and in the datasheet, in Table 4 the main electrical characteristics of the PV modules, detected with the flash tests, are reported.
Table 4. Summary of the electrical characteristics for each PV module
|
Module serial number |
Pmax (W) |
Impp (A) |
Vmpp (V) |
Isc (A) |
Voc (V) |
|
AS31408 |
247 |
8.23 |
30.01 |
8.79 |
37.76 |
|
AS31409 |
248 |
8.31 |
29.86 |
8.86 |
37.85 |
|
AS31411 |
248 |
8.31 |
29.81 |
8.80 |
37.81 |
|
AS31412 |
248 |
8.48 |
29.26 |
8.48 |
37.75 |
|
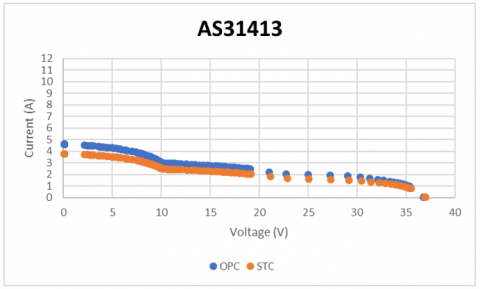
AS31413 |
247 |
8.44 |
29.27 |
8.87 |
37.81 |
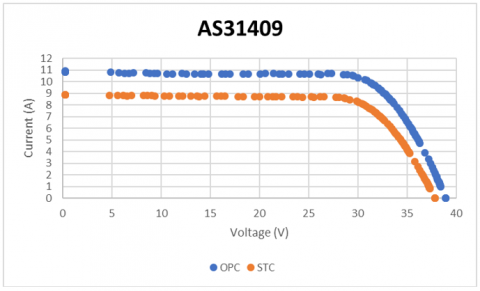
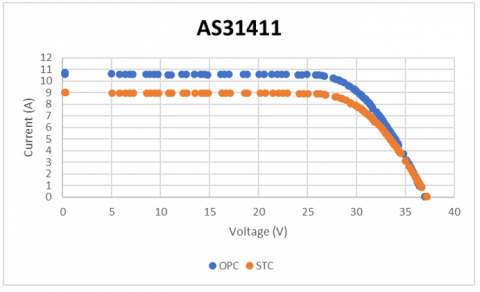
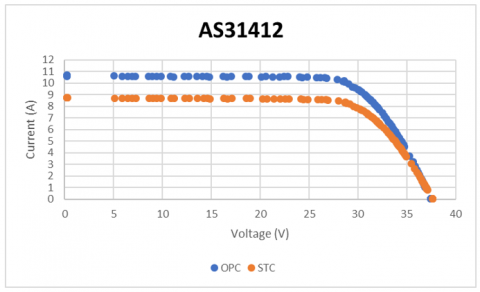
Figures 2, 3, 4, 5 and 6 represent the I-V curves at STC and OPC conditions for each module being considered, obtained with the flash tester before causing the failures.
For each different PV defect studied and presented in Section 3, the impact of the anomaly on the maximum power of the module was analyzed and discussed. The results of the analysis are provided as follows.
The module AS31408, on which the damaged bypass diode was produced, presents a value of Pmax equal to 161 W. The percentage decrease between the original Pmax of the module with that of the damaged bypass diode is therefore equal to about -34.89%. Figure 7 shows the I-V curve of the module with damaged bypass diode at O.
Figure 2. STC and OPC I-V curves obtained with flash tests module AS31408
Figure 3. STC and OPC I-V curves obtained with flash tests module AS31409
Figure 4. STC and OPC I-V curves obtained with flash tests module AS31411
Figure 5. STC and OPC I-V curves obtained with flash tests module AS31412
Figure 6. STC and OPC I-V curves obtained with flash tests module AS31413
PC and STC conditions, determined with the flash tester.
Figure 7. STC and OPC I-V curves obtained with flash tests module AS31408 with one damaged diode bypass
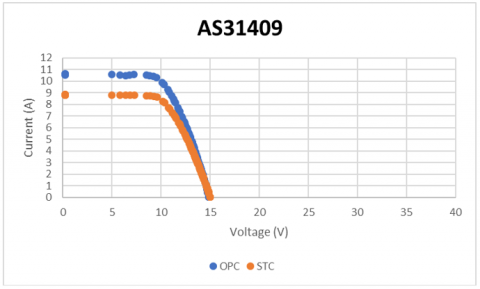
The module AS31409, characterized by two damaged bypass diodes, has a value of Pmax equal to 84 W. The percentage difference between the maximum power of the module with the damaged bypass diode and the intact module is equal to about -66.08%. Figure 8 shows the I-V curve of the module with two damaged bypass diodes at OPC and STC conditions, determined with the flash tester.
Figure 8. STC and OPC I-V curves obtained with flash tests module AS31409 with two damaged diodes bypass
The hotspot was replicated on the module AS3111; in this case, the Pmax value was equal to 241 W. The percentage decrease between the Pmax of the module with the hotspot on a PV cell and the intact module is about -2.64%, and Figure 9 shows the corresponding I-V curves evaluated with the flash tester at OPC and STC conditions.
Figure 9. STC and OPC I-V curves obtained with flash tests module AS31411 with the defect hotspot
The cell crack defect was evaluated on the module AS31412; a Pmax value equal to 241 W was determined. The percentage decrease between the maximum power of the module with the crack cell and the intact module is, therefore, -2.89%. Figure 10 shows the I-V curve of the module with a crack cell at OPC and STC conditions, obtained with the flash tester.
Figure 10. STC and OPC I-V curves obtained with flash tests module AS31412 with a cell-crack
The module AS31413, affected by the complete breaking of its front glass surface, was characterized by a value of Pmax equal to 44 W. The percentage difference between the Pmax of the module with the complete breaking of the front glass surface and the intact module is equal to -82.30%, and Figure 11 shows the related I-V curves at OPC and STC conditions.
Figure 11. STC and OPC I-V curves obtained with flash tests module AS31413 with complete breaking of front glass surface
In the present work, the presence of specific types of faults affecting photovoltaic (PV) modules electrical performance was evaluated. Specifically, five brand-new PV modules were damaged in a systematic way and a solar simulator was used to analyze their current-tension (I-V) curves.
Based on the results of the experimental tests, it was found that the most serious damage that can affect PV modules is a complete breaking of the front glass surface. This damage simulates the effect of hailstorms and similar mechanical stresses and, respect to the other defects studied in the present article, can be easily detected by operators. On the other hand, defects such as damaged bypass diodes, hotspots and cell cracks cannot be found without techniques like infrared thermography. The analysis carried out in this paper shows that infrared thermography coupled with flash tests can be used to detect and evaluate in a quantitative way the effect of specific failures. Referring to the modules considered in our analysis, we found that one of the most insidious faults that can affect a PV module involves the bypass diode. A single, damaged bypass diode can reduce the power production of a panel by one third, and this issue doubles when two bypass diodes fail. On the contrary, hotspots and cell cracks have only limited effects on the power production (-2.64% and -2.89%, respectively, based on the results of the analysis), but such defects should not be underestimated as in the long period their presence could affect other near cells, and thus further worsening the performance of the PV module.
As the correlations between defects and power loss found can be considered valid and applicable in real conditions, the analysis proposed here should not be limited to individual PV modules, but it could be extended to a whole string and even to the entire PV plant. In this way, it would be possible to define the impact of defective modules on the overall energy yield of the PV plant and it would be possible to quantify the effective loss of production in kWh per year. Such evaluations highlight the importance of the techniques discussed in the present analysis.
|
AM |
air mass |
|
a |
irradiance correction factor for the open circuit voltage |
|
CCD |
charge-coupled device |
|
Eff |
module efficiency, % |
|
EL |
electroluminescence |
|
k |
temperature coefficient, Ω. ℃-1 |
|
k’ |
temperature coefficient, Ω. ℃-1 |
|
G |
irradiance, W.m-2 |
|
I |
current intensity, A |
|
IR |
Infrared |
|
IRT |
Infrared thermography |
|
MPP |
maximum power point |
|
NOCT |
nominal operating cell temperature, ℃ |
|
n |
number of I-V points |
|
OPC |
operating condition |
|
P |
electrical power, W |
|
PL |
photoluminescence |
|
PSL |
pulsed solar load |
|
PSS |
pulsed solar simulator |
|
PV |
photovoltaic |
|
Rs’ |
internal series resistance, Ω |
|
STC |
standard test condition |
|
T |
temperature, ℃ |
|
V |
voltage, V |
|
Greek symbols |
|
|
$\alpha$ |
short circuit current temperature coefficient, mA. ℃-1 |
|
$\beta$ |
open circuit voltage temperature coefficient, mV. ℃-1 |
|
$\gamma$ |
maximum power temperature coefficient, %. ℃-1 |
|
Subscripts |
|
|
1 |
OPC (operating conditions) |
|
2 |
STC (standard test conditions) |
|
max |
maximum |
|
mpp |
maximum power point |
|
oc |
open circuit |
|
rel |
relative |
|
sc |
short circuit |
[1] Luciani, S., Coccia, G., Tomassetti, S., Pierantozzi, M., Di Nicola, G. (2020). Use of an indoor solar flash test device to estimate temperature and irradiance corrections of photovoltaic modules. Tecnica Italiana-Italian Journal of Engineering Science, 64(2-4): 167-172. https://doi.org/10.18280/ti-ijes.642-406
[2] Global Market Outlook - For Solar Power / 2018 - 2022, 201 Technical Report, SolarPower Europe, 2018.
[3] Rapporto Statistico solare fotovoltaico. Technical Report, GSE - Gestore Servizi Energetici, 2018.
[4] Jordan, D.C., Silverman, T.J., Wohlgemuth, J.H., Kurtz, S.R., VanSant, K.T. (2017). Photovoltaic failure and degradation modes. Progress in Photovoltaics: Research and Applications, 25(4): 318-326. https://doi.org/10.1002/pip.2866
[5] Thermal Imaging Guidebook for Buildings and Renewable Energy Applications. (2011). FLIR Systems, Wilsonville (Oregon), USA.
[6] Spagnolo, G.S., Del Vecchio, P., Makary, G., Papalillo, D., Martocchia, A. (2012). A review of IR thermography applied to PV systems. In 11th International Conference on Environment and Electrical Engineering, pp. 879-884. https://doi.org/10.1109/EEEIC.2012.6221500
[7] Akram, M.W., Li, G., Jin, Y., Chen, X., Zhu, C., Zhao, X., Ahmad, A. (2019). Improved outdoor thermography and processing of infrared images for defect detection in PV modules. Solar Energy, 190: 549-560. https://doi.org/10.1016/j.solener.2019.08.061
[8] Roy, J.N., Gariki, G.R., Nagalakhsmi, V. (2010). Reference module selection criteria for accurate testing of photovoltaic (PV) panels. Solar Energy, 84(1): 32-36. https://doi.org/10.1016/j.solener.2009.09.007
[9] International Electrotechnical Commission. (2009). IEC 60891. Procedures for Temperature and Irradiance Corrections to Measured IV Characteristics of Crystalline Silicon Photovoltaic Devices. Second edition.
[10] Ebner, R., Kubicek, B., Újvári, G. (2013). Non-destructive techniques for quality control of PV modules: Infrared thermography, electro-and photoluminescence imaging. In IECON 2013-39th Annual Conference of the IEEE Industrial Electronics Society, pp. 8104-8109. https://doi.org/10.1109/IECON.2013.6700488
[11] Gallardo-Saavedra, S., Hernández-Callejo, L., del Carmen Alonso-García, M., Santos, J.D., Morales-Aragonés, J.I., Alonso-Gómez, V., Martínez-Sacristán, O. (2020). Nondestructive characterization of solar PV cells defects by means of electroluminescence, infrared thermography, I-V curves and visual tests: Experimental study and comparison. Energy, 205(15): 117830. https://doi.org/10.1016/j.energy.2020.117930
[12] Munoz, M.A., Alonso-García, M.C., Vela, N., Chenlo, F. (2011). Early degradation of silicon PV modules and guaranty conditions. Solar Energy, 85(9): 2264-2274. https://doi.org/10.1016/j.solener.2011.06.011
[13] Vodermayer, C., Mayer, M., Mayer, M., Müller, T., Niess, M., Wotruba, G., Schumacher, J. (2008). First results-correlation between IR images and electrical behavior and energy yield of PV modules. In Proceedings of the 23rd European Photovoltaic Solar Energy Conference and Exhibition (EU PVSEC). Valencia, Spain.
[14] Dalsass, M., Scheuerpflug, H., Fecher, F.W., Buerhop-Lutz, C., Camus, C., Brabec, C.J. (2016). Correlation between the generated string powers of a photovoltaic: Power plant and module defects detected by aerial thermography. In 2016 IEEE 43rd Photovoltaic Specialists Conference (PVSC), pp. 3113-3118. https://doi.org/10.1109/PVSC.2016.7750239
[15] International Electrotechnical Commission. (2007). IEC 60904–9. Photovoltaic devices, Part 9.
[16] International Electrotechnical Commission. (2006). 60904-1, Photovoltaic Devices, Part 1: Measurement of Photovoltaic Current–Voltage Characteristics. International Electrotechnical Commission, Geneva, Switzerland. Ed, 2.