Arnaud Tonang Zebaze | Adoua Kopa Njueya* | Maurice Kwekam | Emile Temgoua
© 2020 IIETA. This article is published by IIETA and is licensed under the CC BY 4.0 license (http://creativecommons.org/licenses/by/4.0/).
OPEN ACCESS
Population in Adamawa Plateau faced to borehole failure and return to alternative water supply structures (wells and catchments) with a doubtful quality. This study was carried out to highlight the location of aquifers, their hydrodynamics characteristics and groundwaters quality in Mbakaou locality, which belong to the Adamawa Region. Combination of geological and geoelectrical surveys at 10 stations, with hydrodynamic study of 4 boreholes were carried out to characterize aquifers. Hydrochemical analysis of 10 waters samples has been done to determine physico-chemical water quality and origin of waters mineralization. Geological studies show that basement rocks, which constitute fractured aquifers, consists of a large assemblage of granitoid. Geophysics and drilling data highlight superficial aquifers located between 2 and 17 m and fractured aquifers located between 11 and 74 m, with resistivity ranging from 50 to 671 Ω.m. The borehole have yield varying between 2.80 and 5.14 m3/h. Transmissivity and permeability ranging from 10-6 to 10-5 m2/s and 10-7 to 10-6 m/s respectively, indicating that aquifers are semi-permeable. Waters are of good quality compared to WHO norms and weakly mineralized (35 to 247.9 mg/l). Piper diagram show that calcium and magnesium bicarbonate facies is dominant. Mineralisation of water is mainly influenced by water-rock interaction through silicate weathering.
aquifers, borehole, geoelectrical survey, resistivity, hydrodynamics, mineralization, Mbakaou
In Cameroon, the firm CDE (Camerounaise Des Eaux) is using its distribution network to try to provide drinking water to the population. Currently, the firm covers less than 50% of the demand in water supply for all the urban areas where it is present [1, 2]. The partial supply of drinking water in urban areas has fostered the development of a new mode of water distribution called “resale point”. In rural and suburban areas like Mbakaou, rural hydraulic programs have enabled the realization of many boreholes to facilitate the access to potable water to the populations who were still using water from wells, springs or rivers of doubtful quality. Despite the construction of those boreholes, the average number of people still needs for water supply remains high because many of them has failed [1]. Moreover, the lack of maintenance of the existing hydraulic structures in one hand and the poor quality of their construction on the other hand are the main obstacles to the efforts made by the government [3, 4]. In this area, boreholes realized at the first point after survey is frequently negative; it is after two or three drilled that we have a positive results. This raises the problem of the best choice of boreholes location and the interpretation of data acquired during hydrogeological and geoelectric investigation [5, 6]. This study aims to determine suitable locations, depths of aquifers and their hydrodynamics characteristics to optimize boreholes drilling in this area to minimize failures and assess water quality, for its sustainable utilization.
Mbakaou, located in the Adamawa Region, Tibati subdivision, Cameroon, is well known for its reservoir dam built on the river Djerem in 1969. The study area extends between latitudes 6°15’N to 6°23’N, and longitudes 12°44’30’’E to 12°50’E. The altitude of the area varies between 800 and 880 m. Some permanent or intermittent rivers flow in the large and flat valleys slightly incised. The presence of the Mbakaou dam with size of about 189.48 Km2 has modified the former hydrographic regime of the area. The hydrographic network is very dense and subdendritic, and is constituted of streams from order 1 to order 4. It is marked at some places by straight portions and numerous waterfalls, which indicate a structural control in the study area. The area has a humid tropical climate, hot and humid, with two distinct seasons. The average annual rainfall is 1908 mm per year with an average temperature of about 23℃. The vegetation consists mainly of shrub savannah, which is evolving towards grasslands under the action of bushfires and overgrazing. Along rivers, some gallery forests are remaining.
The study area in the Adamawa plateau, is located on the central domain of Panafrican fold belt in Cameroon, at around 33 km from the southeast of the city Tibati (Figure 1). Structurally, it’s characterized by the presence of the megastructure called Tibati Shear Zone (TSZ), known as the southern extension of the Central Cameroon Shear Zone (CCSZ, [7]). The area is dominated by syn- to post- tectonic granitoïds, partly covered by the volcanic lava from the “Cameroon Volcanic Line”. Adamawa plateau is stretching on the predominant direction N70°E and its bedrock is dominated by paleoproterozoic metamorphic intruded by Neoproterozoic granitoids (Figure 1). This bedrock is mainly composed of gneiss and heterogenic calc-alkaline granites [8-10]. The intrusive granitoids are syn-to-post tectonic, often fractured, crushed and tangled. The orogenic movements that are subsequent to their setting are characterised by a brittle tectonic on this rigid material. The geological units of the area are locally overlain by Cretaceous sediments, residual rocks and Cenezoic volcanic flows. Recent studies show that the basement rocks of the Adamawa plateau is complex. It is composed mainly of granitoids containing relic fragments of a paleoproterozoic continental crust recrystallized under conditions of high grade granulite facies [9-13]. According to these authors, granitoïds has various facies: hornblende biotite granites, leucogranites and syenite [9]. In the field, these formations are highly altered and in places covered by slightly thick bank alluviums drained by river Djerem. The outcrops are located in the bed of the watercourse. The mineralogical composition is dominated by quartz, orthoclase, plagioclase and biotite. Some significant fracturing with variable direction and extension is observed on the rocks. There are also some rare preferential orientations of feldspar mega-crystals. Depending on the stage of deformation, the rocks of the study area can be classified as pre-tectonic, syn-tectonic or post-tectonic rocks [8, 14]. Three different types of soil developed over granite are found in the area; evolved soils, indurated lateritic soils and hydromorphic soils.
Geomorphological context of Mbakaou area show a plain with a gentle landscape and a slight dissection model known as Djerem plain. The course of the great collector river Djerem and its tributaries follows in most cases the major tectonic features. Many small resurgences forming streams that join downstream the river Djerem course are also observed in the area. The Adamawa Plateau is known as the main water tower of Cameroon, due to the particular abundance of streams and rivers in the region, as observed at Mbakaou. The most important factor that promotes infiltration and groundwater recharge is the peneplain relief. The thickness of the weathered layer is on average 15 m and represents an important source of alimentation for the deep aquifers of the area. The pervasive presence of termite nests in the area contributes considerably to the soil porosity. The gallery forests which expand along river courses are good markers for fractures [15] and for the permanent presence of water within these fractures. The facts that springs, wells and boreholes are found in the area are evidences of the availability of groundwater resources [4]. Finally, the Mbakaou artificial lake itself constitutes a big reservoir for water supply for the whole region [3]. Thus, research of groundwater in this locality is focused on fractures [15].
Figure 1. Location of study area on (A) geological map of Cameroon and (B) geological map of study area with this sampling points. Modified from [14] and [10]
The approach used for this study is a combination of field observations and laboratory analysis of field samples. The field observation enabled locating and characterizing the various outcrops, identifying and measuring the structural features, locating and characterizing all observed water sources. Thin sections of the rock samples taken from the field are realized in Geological and Mining Research Institute (IRGM) and their microscopic analysis conducted at the Laboratory of Geology and Environment of the University of Dschang, Cameroon. Due to the similarity of geological nature, geochemical data of rocks have been taken from [9, 13] to understand the origin of mineralogical composition of water samples. Prior to the geophysical sounding, the aerial photographs were used to map out the main lineaments (lines resulting from the morphostructural alignments, the natural alignment of trees, the provision of drainage system or from the correctness of geomorphological contours) and also to setup the initial sites for the geophysical exploration.
A geophysical survey consisted of geoelectrical soundings in order to reveal vertical anomalies in the subsurface of the region. The implementation of the vertical electrical sounding (VES) was carried out using ABEM TERRAMETER SAS 300, which permits induced current to be measured with good penetration and low power consumption. The apparent resistivity was measured according to the Schlumberger approach by using four symmetrical electrodes. The spacing between the AB/2 electrodes varying from 1.5 to 83 m with 10 measurement stations. Once the data were obtained and curves were constructed as a function of the spacing of the electrodes in a bilogarithmic diagram. Initial interpretation of VES data are carried out using curve matching techniques. These datas were interpreted by using Ipi2win software to obtain resistivity values and thickness of different layers. Based on lithological structure of field and VES curves, depth location of aquifer was choose at place were anomalies observed [16]. After drilling 4 boreholes (F1, F2, F4 and F6) at right of given VES choosen, a correlation between lithology and VES curves allows to give depths and resistivity of aquifers.
Determination of the hydrodynamic parameters (transmissivity, permeability and operating flow) were obtained from pumping tests of two boreholes (F1 and F2), as a function of the final flow rates obtained during blowing. In the present case, being the observation well, it is recommended according to some authors [17-19] to use the data from the ascent after stopping the pumping. These data were interpreted from the analytical solution of Theis [20] and Jacob approximation [21]. From this analytical approach, transmissivity has been deduced by graphic resolution according to the Eq. (1):
$T=0.183^{*} Q / \Delta s$ (1)
where: Q = pumping rate (m3/s) and Δs = variation in the drawdown between a logarithmic module.
The coefficient of permeability was determined from Eq. (2):
$K=T / e$ (2)
where: T = transmissivity (m² / s) and e = thickness of the aquifer, identified here by the length of the strainer (m).
Ten water samples (1 open well, 3 springs and 6 boreholes) were collected and analyses. Physico-chemical analysis of the F1 and F2 boreholes were done with the collaboration of the Centre Pasteur of Cameroon, while those of F3, F5 and the spring S2 were analyzed with the collaboration of IRGM using chromatographic ionic method. The remaining boreholes data F4 and F6 as well as the data from springs S1 and S3 and the well Pt were analysed in the laboratory of soil analysis and environmental chemistry (LABASCE) of the Faculty of Agronomy and agricultural science (FASA) of the University of Dschang using gravimetric, complexometric and distillation methods. During the samples collection, care was taken and standard procedure was applied to avoid contamination. Sampling point were recorded by means of GPS Garmin etrex-30 and plot on a map (Figure 1). Duplicate samples of each point were collected in acid washed 500 ml polyethylene bottles after rinsing at least three times with water to be sampling. Concerning water samples from boreholes, its was pumped up to 5 min to purge aquifers before sampling operation. Physicochemical parameters of water including, pH, conductivity, temperature and dissolved oxygen were determined in situ using a multiparameter Waterproof-test. Hydrochemical composition of water samples concerning major elements like cations (Ca2+, Mg2+, Na+, K+ and Fe2+) and anions (Cl-, NO3-, SO42- and HCO3-) were determined at the laboratory. In order to process the chemical analysis and some graphical representation, open software “DIAGRAMMES” version 5.3 were used. The quality of the investigated water samples for drinking purposes was assessed in comparison to WHO norms [22].
4.1 Petrography and structural data
4.1.1 Petrography
The study area consists mainly of granitoïds. The rocks found on the field are fine grain granite, medium grain granite, and porphyroïd granite rich in silica (Table 1). All these samples outcrops in slabs and blocks next to the river Mekay bridge, in form of blocks in the bed of river Djerem, precisely next to the Mbakaou quarry located southwest of the study area. They are made of quartz, plagioclase, K-megacrysts feldspar, variable amount of hornblende, biotite and accessory minerals including sphene and oxides. The textures of these rocks are magmatic heterogranular to granoblastic.
Fine grain granite consists of grain sizes ranging from 0.6 to 3.6 mm. It represents about 5% of the total surface of the study area. This fine-grained granite of grey colour is crossed by numerous quartzo-feldspathic veins.
Medium grain granite consists of grain sizes ranging from 1.7 to 5.5 mm. It covers around 80% of the total surface of the study area. This granite is homogeneous, pink in colour, and show the presence of joints. It has an isogranular grainy texture the alteration of this rock produces hard soils having small interconnected cavities of millimetre order, whose origin is related either to the phenomena of dissolution of minerals or to the bioturbation activities.
Porphyroïd granite consists of grain sizes ranging from 0.3 to 7.6 mm. It occupies about 15% of the total surface of the study area and has a grainy porphyritic texture due to the development of megacrystals of pink feldspar.
Table 1. Proportion (W%) of major elements for granitic rocks of study area [9, 13]
|
Sample |
DA28a |
D5N a |
KB6b |
KW6b |
|
SiO2 |
72.62 |
72.02 |
77 |
75.8 |
|
TiO2 |
0.34 |
0.40 |
0.09 |
0.13 |
|
Al2O3 |
14.32 |
13.72 |
12.1 |
13.0 |
|
Fe2O3 |
1.83 |
2.67 |
1.22 |
0.36 |
|
MnO |
0.00 |
0.03 |
0.01 |
0.04 |
|
MgO |
0.60 |
0.47 |
0.01 |
0.04 |
|
CaO |
1.49 |
1.48 |
0.42 |
0.78 |
|
Na2O |
2.97 |
3.19 |
3.17 |
3.37 |
|
K2O |
4.97 |
5.14 |
5.61 |
5.77 |
|
P2O5 |
0.13 |
0.13 |
0.01 |
0.01 |
|
PF |
0.59 |
0.44 |
0.23 |
0.27 |
|
Total |
99.86 |
99.69 |
99.9 |
99.9 |
Plagioclases are zoned in ranged an 15-23; K-feldspar are rich in Or89; Hornblende and biotite with XMg ranging from 0.47 to 0.58 [9, 13]. Mineral chemistry of whole rocks (Table 1) show the proportion of different major elements composition of granites.
In this composition, K2O is greater than Na2O same thing is observed between CaO and MgO. Ratio (MgO+CaO) / (K2O + Na2O) are less than 1. Concentrations of SiO2 is greater than the other oxides. The order of abundance are as follows: SiO2 > Al2O3 > K2O > Na2O > Fe2O3 > CaO > MgO.
4.1.2 Structural analysis
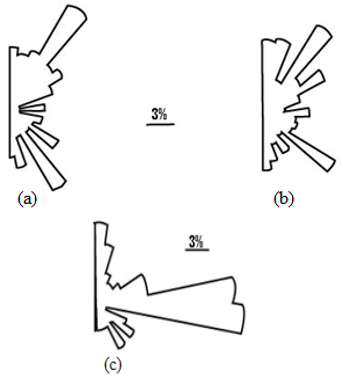
The lineament analysis was used to assess the tectonic activity in the area and to find the correlation between this activity and the landform before geoelectrical survey. A dense and large network of fractures has been inferred from the observed lineaments. Using the rosette (Figure 2), the frequency distribution (Figure 2a) reveals two major orientations for the lineaments: N30-40°E and N140-150°E. The frequency distribution of orientations based on the cumulative lengths of lineaments (Figure 2b) shows that the classes N30-40°E and N120-130°E correspond to the orientation of the major fractures in the area. From the field observation, two types of fracturing that crosses the bedrock in the form of veins and joints were identified. These joints have various orientations in the study area. The statistical analysis of their orientations (Figure 2c) suggests two major orientations that are N80-90°E and N90-100°E.
Figure 2. Different Rosettes of lineaments (a) orientations; (b) cumulative lineament lengths; (c) joint orientations
4.2 Geoelectrical and Drilling data
4.2.1 Geoelectrical data
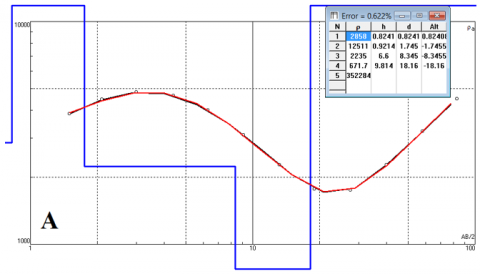
Geoelectrical data analysis shows four types of curves: H, KH, M and W (Figure 3). KH curve type is most abundant after computed VES data (Table 2) and have been the object of drilling. All VES computed are recorded in Table 2 and they show four (VES 9) to six electrically distinct layers (VES 1). These layers should be analysed according to the field observation of cuttings come from drilling.
KH curve type
H curve type
W curve type
M curve type
Figure 3. Representative VES curves types obtained in the study area
First layer with resistivity values ranged from 208.9 to 2858 Ω.m, and its thickness ranged from 0.53 to 1.11 m. This layer corresponds to topsoil mostly conductive (excepted case of VES 5 and VES 7) and it is considered as the surface layer.
Second geoelectrical layer have resistivity value ranged from 245.2 to 12511 Ω.m, and its thickness ranged from 0.8 to 4.41 m. This layer corresponds to surface soil made of weathering product of bedrock and it is most resistive than the first one.
Third geoelectrical layer is conductive than the second one and its resistivity values ranged from 50.07 to 4601 Ω.m with thickness ranged from 2.13 to 23.89 m. This third layer can be an aquifer where VES show low resistivity between two layers with high resistivity values (case of VES 1, VES 8 and VES 9).
Fourth geoelectrical layer is very conductive than the third layer (except case of VES 1, VES 8 and VES 9), and could be saturated fractured zones with resistivity values ranging from 61.44 to 671.7 Ω.m and thickness ranging from 9.82 to 35.27 m. This layer could be the potential aquifer where groundwater could be found in fracture.
Fifth and sixth geoelectrical layers are very resistive than the fourth layer (except case of VES1 and VES8 where we have low resistivity for the fifth layer) with resistivity ranging from 3292 to 35228 Ω.m. This layer corresponds to dry and fresh massive hard granitoid.
4.2.2 Drilling data
Drilling data from boreholes F1, F2, F3 and F4 (Table 3), show multilayers aquifers at two main levels. First level where we have superficial aquifer is located between 2 to 20m depth and made of weathered and decayed rock. Second level which are mainly mobilized for these borehole, correspond to fractured aquifers located between 11 to 75 m depth.
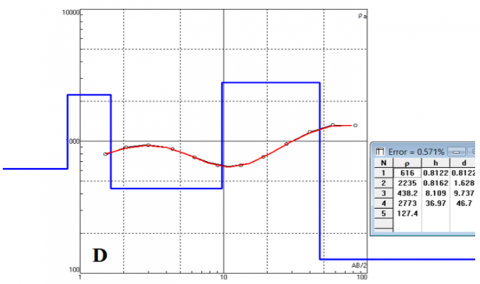
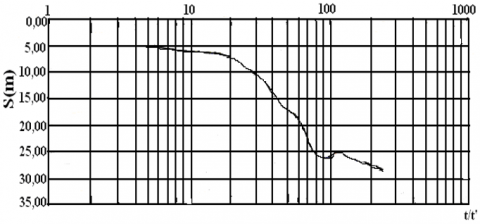
Boreholes depths ranged between 41 and 80 m. Thickness of weathering level is comprised between 10 to 18 m. Based on observation during drilling operation (case of F1, F2, F3 and F4) and pumping tests on two boreholes (F1 and F2), flow rate was estimated from 2.8 to 5.14 m3/h (Figure 4; Table 3). The computation of others hydrodynamic parameters of the aquifers show that a Transmissivity ranged between 10-5 and 10-6 m2/s and Permeability between 10-6 and 10-7 m/s.
4.3 Hydrochemistry data
Physicochemical analysis of the 10 water samples (6 boreholes, 3 springs and 1 well). show the variation of physical (temperature, pH, conductivity) and chemical (Na+, K+, Mg2+, Ca2+, Fe3+, HCO3-, SO42-, Cl-, NO3-) parameters (Table 4). The pH values ranged between 5.5 to 5.7 in well and spring, and between 5.3 to 7.3 in boreholes. For well and springs, waters are acidic and are below the standards [22]. But these pH values in borehole water samples increases from acidic to neutral nature. The electrical conductivity (EC) ranged from 10.5 to 15.3 µS/cm in well and spring, and from 35.6 to 249.2 µS/cm in boreholes. Temperature of water samples is around 25°C (25.1 to 25.9℃) in well and spring, but ranged from 26.3 to 27.9°C in boreholes.
Regarding concentrations of cations in all water samples (comprise between 0.1 and 36 mg/l), they are below the standards. Ca2+ (in Pt, S3, F1, F2 and F3) and Na+ (in Pt, S1, S2, and F5) and are most abundant cations. In many case, higher values are obtained in borehole sample. The order of abundance are as follows: Ca2+ > Na+ > Mg2+ > K+.
Table 2. Resistivity values, layer thicknesses, depth and models of VES curves
|
VES Code |
Number of layers |
Resistivity (Ohm.m) |
Thickness (m) |
Depth (m) |
Curve type |
|
ρ1 / ρ2/ ... / ρn+1 |
h1 / h2 / ... / hn+1 |
d1/ d2 / ... / dn+1 |
|||
|
VES5 |
5 |
1217 / 662.1 / 188.3 / 61.44 / 22182 |
0.90 / 3.2/ 6.9 /20.8 |
0.9 / 4.1 / 11.0 / 31.8 |
H |
|
VES1 |
6 |
459.7 / 1257 / 265.3 / 1756 / 152.9 / 28099 |
0.90 / 1.1 / 2.9 / 17.4 / 23.1 |
0.9 / 2 / 4.9 / 22.3 / 45.4 |
KH |
|
VES2 |
5 |
785 / 2190 / 898.4 / 284.9 / 13651 |
1.11 / 2.01 / 14.4 / 33.5 |
1.11 / 3.12 / 17.52 / 51.02 |
|
|
VES3 |
5 |
1335 / 5995 / 1297 / 159.6 / 95157 |
0.92 / 1.13 / 8.71 / 14.33 |
0.92 / 2.05 / 10.76 / 25.09 |
|
|
VES4 |
5 |
1593 / 2520 / 1120 / 364.5 / 7996 |
0.53 / 4.41 / 21.01 / 34.24 |
0.53 / 4.94 / 25.95 / 60.19 |
|
|
VES6 |
5 |
2858 / 12511 / 2235 / 671.7 / 35228 |
0.82 / 0.92 / 6.60 / 9.82 |
0.82 / 1.74 / 8.34 / 18.16 |
|
|
VES9 |
4 |
208.9 / 2038 / 50.07 / 508.1 |
0.81 / 1.06 / 6.84 |
0.81 / 1.87 / 8.71 |
|
|
VES10 |
6 |
484.1 / 1445 / 424.4 / 281.7/ 106 / 14679 |
0.68 / 0.61 / 17.13 / 1.45 / 34.05 |
0.68 / 1.29 / 18.42 / 19.87 / 53.92 |
|
|
VES8 |
5 |
616 / 2235 / 438.2 / 2773 / 127.4 |
0.81 / 0.82 / 8.11 / 36.97 |
0.81 / 1.63 / 9.74 / 46.71 |
M |
|
VES7 |
5 |
1193 / 245.2 / 4601 / 367.9 / 3292 |
0.69 / 1.20 / 2.13 / 35.27 |
0.69 / 1.89 / 4.02 / 39.29 |
W |
Table 3. Characteristics of boreholes assessed
|
|
Thickness of weathering level (m) |
Fractured levels captured (m) |
Thickness of captured aquifer |
Borehole depth (m) |
Flows (m3/h) |
Transmissivity (m²/s) |
Permeability (m/s) |
|
F1 |
13 |
56-61 / 67-74 |
12 |
80 |
3.00 |
7,12 x 10⁻⁶ |
6,03 x 10⁻⁷ |
|
F2 |
10 |
11-14 / 41-53 |
15 |
57 |
5.14 |
7,32 x 10⁻⁵ |
6,21 x 10⁻⁶ |
|
F4 |
18 |
48-51 / 55-60 |
8 |
66 |
3.00 |
|
|
|
F6 |
13 |
15-21 / 35-38 |
9 |
41 |
2,80 |
|
|
(A) Pumping test curve of F1
(B) Pumping test curve of F2
Figure 4. Pumping test curve of F1 and F2
Concentrations of anions in most water samples (comprise between 0.02 and 195.2 mg/l), is dominated by HCO3- which is low (from 13.4 to 20.7 mg/l) in well and spring, but high (from 41.5 to 195.2 mg/l) in boreholes. The order of abundance for the rest of anions was NO3- (0.0 – 13.7 mg/l), SO42- (0.52 – 9.7 mg/l) and Cl- (0.02 – 0.56 mg/l). Nitrates (NO3-) are present in well, springs and some boreholes like F4, F5 and F6 but relatively absent in others like F1, F2 and F3. All anions concentrations values (excepted nitrates), are higher in boreholes than the water samples of spring and well. These values of anions concentration are low than the standard limits. Water mineralization is ranged from 23.1 to 35.6 mg/l in well and spring, and from 51.6 to 247.9 mg/l in boreholes.
The results reveal that iron concentrations in water samples of well and springs are higher (from 0.31 to 0.73) than those in boreholes (from 0 to 0.15) excepted water samples of F3 and F6. All the parameters have contents that are compatible with the norms [22] with the exception of iron content which is abnormally high than the standard (concentration greater than or equal to 0.3 mg/l in 6 of 10 analysed samples).
Table 4. Physicochemical analysis of water sample in the study area
|
Sample Code |
pH |
EC µS/cm |
Temp (°C) |
Na+ |
K+ |
Mg2+ |
Ca2+ |
Fe2+ |
HCO3- |
SO42- |
Cl- |
NO3 |
TDS |
|
mg/l |
|||||||||||||
|
Pt |
5,5 |
13,5 |
25,2 |
2,06 |
1,4 |
1,2 |
2,1 |
0,35 |
15,8 |
1,4 |
0,06 |
11,2 |
35,6 |
|
S3 |
5,6 |
10,5 |
25,1 |
1,0 |
0,9 |
0,4 |
1,2 |
0,31 |
14,8 |
0,82 |
0,03 |
13,1 |
32,3 |
|
S2 |
5,7 |
11,6 |
25,6 |
0,98 |
0,5 |
0,1 |
0,1 |
0,47 |
20,7 |
0.0 |
0,14 |
0.0 |
23,1 |
|
S1 |
5,6 |
15,3 |
25,9 |
2,66 |
1,4 |
1,3 |
1,8 |
0,73 |
13,4 |
1,19 |
0,04 |
10,9 |
33,5 |
|
F6 |
5,7 |
43,0 |
27,4 |
1,84 |
4,3 |
1,3 |
2,3 |
0,56 |
41,5 |
1,23 |
0,02 |
13,7 |
66,8 |
|
F5 |
5,3 |
35,6 |
27,9 |
3,88 |
0,4 |
0,1 |
0,5 |
0,09 |
36,6 |
0.0 |
0,11 |
9,98 |
51,6 |
|
F4 |
5,8 |
61,5 |
26,3 |
1,84 |
5,5 |
2,6 |
1,7 |
0,15 |
61 |
0,66 |
0,07 |
10,9 |
84,5 |
|
F3 |
7,2 |
214 |
27,4 |
10,6 |
3,8 |
9,2 |
18,6 |
0,3 |
185,1 |
0,52 |
0,56 |
0.0 |
228,8 |
|
F2 |
7,3 |
249,2 |
27,2 |
3,48 |
4,2 |
1,1 |
36 |
0,0 |
195,2 |
7,7 |
0,2 |
0,0 |
247,9 |
|
F1 |
7,2 |
244,7 |
27,5 |
3,5 |
5 |
1,1 |
36 |
0,1 |
189,1 |
9,7 |
0,4 |
0,0 |
244,9 |
|
WHO (2004) |
6,5 - 8,5 |
750 |
/ |
200 |
100 |
30 |
75 |
<0,3 |
200 |
250 |
200 |
10 |
|
5.1 Diversity of VES curves and borehole productivity
The geological basement mostly encountered in Mbakaou as well as in the Adamawa Plateau region are granitoids. The frequency and length of fractures in these granitoids constitute the vulnerability points in which water infiltrations occur, and then favour the productivity of the aquifers in the area. The curves shape obtained are similar to the anomalies identified in volcanic and cristalline area in Cameroon [23, 24] and on the basement area made of granitoïds in Ivory Coast [25-27] and Nigeria [28]. This suggested that shape of the curves is influenced by the topography and the structure of the field [24]. In fact, the analysis of the lithological sections after drilling in agreement with the electrical curves models, shows that the structural heterogeneity of the terrain is responsible for the diversity of curve models. This structural and lithological heterogeneity influence on the depth location of the aquifer level. Thus, for two boreholes carried out on the same lithological type and at different depths, different flow rates (F1 and F2) was observed. The different observations made show that the shape of a VES curve does not depend essentially on the lithological nature, but on the structure of the ground (thickness and number of layers, degree of alteration and presence or absence of fractures). This observation is consistent with the observations of many authors [23, 24, 29]; both in the basement area and in the sedimentary area. In addition to these two main factors, there is the topography which, according to [30], is the main factor which would influence the shape of the VES curves, especially within a terrain whose lithological nature is homogeneous. Aquifers resistivity obtained (50 to 671 Ω.m) are in conformity with the Resistivity values of Pan-African aquifers explored by [31]. These resistivity values show that granitoid formation at level explored are highly weathered and/or fractured.
Hydrodynamics data like flow rate (2.8 to 5.14 m3/h), transmissivity of 10-5 to 10-6 m2/s and a permeability of 10-6 to 10-7 m/s obtained, suggesting the semi-permeable nature of the granites that constitutes the aquifers. These values obtained at right of KH VES type choose for drilling, confirm that this type of VES is good for boreholes location to have a positive results. According to [28], KH VES type is more suitable than the other type (A, H, M and W) when identified, for groundwater potential in crystalline basement made by granite. The fact that the flow rates vary slightly from one site to another with regard to the sections of the boreholes can be explained by the fact that these originally massive and crystalline formations only develop a fracturing system thanks to tectonic or decompression phenomena [32]. Furthermore to the degree of fracturing of the crystalline rocks in this case the granites, the productivity of the boreholes is also linked to the thickness and the nature of the saprolites which when it is large with low proportions of clays, increases the productivity. This observation is made by many authors [32-35] who argue that the high productivity of boreholes on crystalline as well as crystallophyllian rocks in general and on granitic material in particular is influenced not only by the structure of the rock, but also by the thickness of the saprolite layer which supplies water to the network of fracture. Moreover, [35] argue that the productivity of boreholes is proportional to depth; because it is possible to find hydraulically active fractures. This observation does not agree with the results obtained in this study, because the deepest holes are not necessarily the most productive and this observation is similar to those of [36].
5.2. Water quality and Hydrogeochemical processes
5.2.1 Water quality
Data from Table 3 show according to [22], two groups of waters. From pH, we distinguish acidic waters (Pt, S1, S3, F4, F5 and F6) that was not suitable for drinking purpose and neutral water which according to [22]. Acidic character of water analysed can be due to the composition of weathered product came from rocks, which are acidic and rich in silica. Many authors [37, 38] have shown that groundwaters from aquifers in granitic basement complex is acidic. This is in conformity with our results. Looking for EC, all cations and anions (excepted NO3) concentrations, these samples are good quality and fresh. Concentration of Nitrate and Iron are higher in general than norms [22] in waters from springs, well and some boreholes and make them not suitable like potable water. Only water sample for boreholes F1, F2 and F3 respected all conditions of WHO standard and then can be considered in all point of view like potable water and suitable for drinking purpose. According to [39], presence of nitrate that make groundwater not potable, can be due to anthropogenic activities that occurs in a given area like farming, industrial effluents and poor sanitation. Because there is no industry in the study area and poor farming activities, presence of nitrate can be due to poor sanitation. Origin of Iron can be attributed to hydrolysis of ferromagnesian rich minerals such as hornblende and biotite that composed basement rocks. High concentration of iron in well, springs and some borehole are link to high degree of rock weathering [40-42].
5.2.2 Chemical Facies of the water samples
The Piper [43] and Stiff diagrams (Figure 5) are a graphical representation tools useful to display the chemical facies of analysed water samples.
The display of the water from various sampling sources on the Piper diagram [43] shows two types of facies:
Stiff diagram show three facies by their importance:
Figure 5. Chemical facies of the analysed waters on the Piper (left) and Stiff (right) diagrams
The domains in which these water samples failed are likely to be influenced by their depth of origin rather than by the petrographic facies encountered. [40] have also suggested this interpretation earlier from its analysis of water from the Western Highlands of Cameroon. In addition, the waters from shallow groundwater (springs) analysed by [44] on the Cameroon Line revealed dominant facies of Ca-(Mg)-HCO3-SO4, which is the same from the dominant facies found in our study area.
5.2.3 Water mineralisation processes
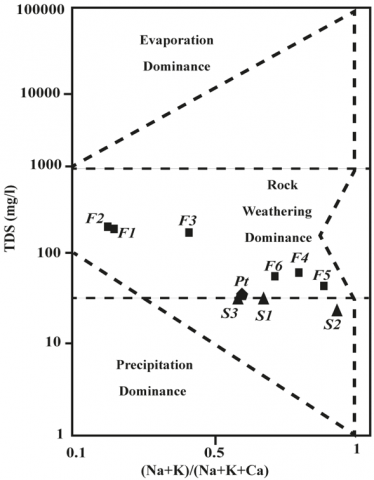
The Gibbs diagram ([45], Figure 6) shows the variation of water mineralization function of the ratio and allow to distinguish between waters in which mineralization is controlled by evaporation and those in which mineralization is influenced by the alteration process of rocks or water - rocks interaction.
Figure 6. Display of analysed water samples in the Gibbs diagram.
The display of the analysed water samples reveals that all water samples of boreholes are in the domain of water – rock interaction; then, we can conclude that water mineralization of boreholes is mainly controlled by the weathering processes. Water samples of well and springs are between two domains (Water-rock interaction domain and Precipitation domain) except sample of spring S2 which is only on precipitation domain. This result show that mineralization of water of springs and well are both influenced by rainfall and water - rocks interaction. According to [40-42], water mineralisation is influenced by residence time, which is grow up with water mineralisation. Then in our case poor mineralization (less than 100 mg/l) of water sample from well and spring and some boreholes (F4, F5 and F6) show the low time residence compared to those borehole with high mineralization (from 228.8 to 247.9 mg/l) like F1, F2 and F3. In view of the depth of the fractures captured by the boreholes (F4 and F6 as well as F1 and F2) with the chemical behavior of the water which is similar to that of wells and springs, we can say that some fractures are directly fed by surface water; hence these fractured aquifers may be subject to pollution phenomena.
5.2.4 Behaviour of alkalis and alkaline earth minerals in the waters
The Hendry and Wassenaar diagram [46] (Figure 7) is useful to understand the behaviour of alkalis and alkaline earth metals in the water. From this diagram, it appears two groups of waters:
The abundance of alkali in groundwater can be explained primarily by the poor presence of alkaline earth minerals in granite, and secondarily to the preferential binding of alkaline earth into the network of clay minerals of the shallow crustal layers. Meanwhile, the relative abundance of alkaline earth minerals compared to alkalis in groundwater can be interpreted as the absence of leaching and also by the low development of clay minerals capable of fixing these ions. [40, 41] made similar conclusions after analysing groundwater from the Western Highlands of Cameroon.
Figure 7. Diagram showing the variation of alkalis versus alkaline earth minerals [46]
According to rocks composition [9, 13], these alkalis and alkaline earth ions can come from minerals like Plagioclases, K-Feldspars, Biotite and Hornblende which are the most common and abundant minerals observed. The contents of alkalis and alkaline earth minerals in general increase from the shallow to the deep groundwater, revealing the intense leaching that occurs on the shallow subsurface.
The assessment of depth location of suitable aquifers to be exploited by positive borehole and groundwaters qualities in Mbakaou which belong to the Adamawa Plateau was carried out through combination of geological, geoelectrical survey at 10 stations, examination of hydrodynamics characteristics of 4 boreholes and hydrochemistry of 10 water samples (6 boreholes, 3 springs and 1 well). Mbakaou is made of fractured granitoid with two majors direction of fractures: N30°-40°E and N120°-130°E. Using these directions for geoelectrical survey, we obtained four types of VES anomalies (KH, H, M and W). Interpretation of these VES anomalies in relation with drilling data has helped in the identification and better understanding of, aquifer dimensions and multilayer character. It has been established from this study that electrical resistivity methods are suited for estimating thickness of weathered mantle and fractured zones. KH VES type is more suitable and have a good potential yield with flow rate between 2.8 to 5.14m3/h. In general water samples compositions show that boreholes are of good quality compared to springs and well. Groundwaters from captured and fractured aquifers are not always of good quality. Groundwater quality and mineralisation of aquifers depend on recharge model, residence time and anthropogenic activities. At end of this study, it is therefore suggested that geophysical methods, most especially the electrical resistivity method, along with geological methods should form an integral part of groundwater exploration programs to avoid borehole failure. For water consumption groundwater for borehole is more suitable than those for well and springs; then, population should take care and analyse water before using it as potable water to avoid deseases.
We sincerely thank the company GEOBASE for providing geoelectrical data used for this study. Authors also grateful to the electricity company AES-SONEL for the internship opportunity offered at Mbakaou Dam, where part of this work was completed.
[1] INS. (2005). Annuaire Statistique du Cameroun 2004. Institut National de la Statistique.
[2] Temgoua, E., Djeuda, T.H.B., Tanawa, E., Guenat, C., Pfeifer, H.R. (2005). Groundwater fluctuations and foot slope ferricrete soils in the humid tropical zone of Southern Cameroon. Hydrological Processes, 19(16): 3097-3111. https://doi.org/10.1002/hyp.5834
[3] Tonang, A. (2009). Influence de la lithologie et des structures géologiques sur la dynamique et la qualité des eaux des aquifères de socle dans la région de Mbakaou et ses environs. Th. M.Sc. Univ. Dschang-Cameroun.
[4] Njueya Kopa, A. (2018). Apport des méthodes géophysiques et géostatistiques à la caractérisation électrique et structurale des aquifères du secteur Centre de la Chaîne Panafricaine d’Afrique Centrale au Cameroun: implication dans la réduction du taux d’échec des forages. Thèse de Doctorat/Ph.D, Université de Dschang, Cameroun.
[5] Ibuot, J.C., George, N.J., Okwesili, A.N., Obiora, D.N. (2019). Investigation of litho-textural characteristics of aquifer in Nkanu West Local Government Area of Enugu state, southeastern Nigeria. Journal of African Earth Sciences, 153: 197-207. https://doi.org/10.1016/j.jafrearsci.2019.03.004
[6] Sultan Awad, S., Hatem Mekhemer, M., Santos Fernando, M. (2009). Groundwater exploration and evaluation by using geophysical interpretation (case study: Al Qantara East, North Western Sinai, Egypt). Arabian Journal of Geosciences, 2: 199-211. https://doi.org/10.1007/s12517-008-0028-7
[7] Ngako, V., Affaton, P., Njonfang, E. (2008). Pan-African tectonics in northwestern Cameroon: Implication for the history of western Gondwana. Gondwana Research, 14(3): 509-522. https://doi.org/10.1016/j.gr.2008.02.002
[8] Lasserre, M., (1961). Carte géologique de reconnaissance à l’échelle 1/500 000, territoire du Cameroun, Ngaoundéré-Est, Direction des Mines et de la Géologie, Yaoundé, Cameroun.
[9] Nzenti, J.P., Kapajika, B., Warnen, G., Lubala, T.R. (2006). Synkynematic emplacement of granitoid, in Pan-African shear zone in central Camroon. Journal of African Earth Science, 45(1): 74-86. https://doi.org/10.1016/j.jafrearsci.2006.01.005
[10] Tchameni, R., Pouclet, A., Penaye, J., Ganwa, A.A., Toteu, S.F. (2006). Petrography and geochemistry of the Ngaoundere Pan-African granitoïds in Central North Cameroun: Implication for their sources and geological setting. Journal of African Earth Science, 44(4-5): 511-529. https://doi.org/10.1016/j.jafrearsci.2005.11.017
[11] Nzenti, J.P. (1998). Neoproterozoic alkaline meta-igneous rocks from the pan-African North equatorial fold Belt (Yaounde, Cameroon): Biotites and magnetites rich pyroxenites. Journal of African Earth Sciences, 26(1): 37-47. https://doi.org/10.1016/S0899-5362(97)00135-8
[12] Nzenti, J.P., Barbey, P., Tchoua, F.M. (1999). Evolution crustale du Cameroun: éléments pour un modèle géodynamique de l’orogenèse néoprotérozoïque. In: Géologie, environnement au Cameroun, Vicat et Bilong (éditeurs), éditions, Collection GEOCAM, 2: 397-407.
[13] Njanko, T., Nedelec, A., Affaton, P. (2006). Synkinematic high-K calco-alcaline plutons associated to the Pan-African central Cameroon Shear zone (W–Tibati area): Petrology and geodynamic significance. Journal of African Earth Sciences, 44(4): 494-510. https://doi.org/10.1016/j.jafrearsci.2005.11.016
[14] Toteu, S.F., Van Schmus, W.R., Penaye, J., Michard, A. (2001). New U-Pb, and Sm-Nd data from North-Central Cameroun and its bearing on the pre-Pan-African history of Central Africa. Precambrian Research, 108(1-2): 45-73. https://doi.org/10.1016/S0301-9268(00)00149-2
[15] Koussoubé, Y., Nakolendousse, S., Bazié, P., Savadogo, A.N. (2003). Typologie des courbes de sondages électriques verticaux pour la reconnaissance des formations superficielles et leur incidence en hydrogéologie du socle cristallin du Burkina Faso. Sud Sciences et Technologies, 10: 26-32.
[16] Bakkali, S., Bouyalaoui, J. (2004). Prospection géophysique appliquée à l’évaluation des eaux souterraines de Médiouna (Tanger, Maroc). Journal des Sciences Pour l’Ingénieur, 4: 13-22.
[17] Lasm, T. (2000). Hydrogéologie des réservoirs fracturés de socle: Analyses statistiques et géostatistiques de la fracturation et des propriétés hydrauliques. Application à la région des montagnes de Côte d’Ivoire (domaine Archéen). Thèse de Doctorat de l’université de Poitiers, France.
[18] Lalbat, F. (2006). Fonctionnement hydrodynamique de l’aquifère du Miocène du bassin de Carpentras (Vaucluse, France). Thèse de Doctorat, Université d’Avignon et des pays de Vaucluse, France.
[19] Soro, G.N., Soro, N., Ahoussi, K.E., Lasm, T., Kouame, F.K., Soro, T.D., Biemi, J. (2010). Evaluation des propriétés hydrauliques des aquifères fracturés des formations cristalline et métamorphique dans la région des Lacs (centre de la Côte d’Ivoire). Estudios Geologicos, 66(2): 227-242.
[20] Theis, C.V. (1935). The relation between the lowering of the piezometric surface and the rate and duration on discharge of the well using groundwater storage. Transactions of the American Geophysical Union, 16(2): 519-524. https://doi.org/10.1029/TR016i002p00519
[21] Jacob, C.E. (1947). Draw-down test to determine effective radius of artesian well. Transactions, American Society of Civil Engineers, 112(1): 1047-1070.
[22] WHO (World Health Organization). (2004). Guidelines for Drinking-Water Quality, Third Edition. WHO Press, Geneva, Switzerland, 515.
[23] Ananfack Keleko, T.D., Tadjou, J.M., Kamguia, J., Tabod, C.T., Feumoe Sieyapdjie, A.N., Kenfack, J.V. (2013). Groundwater investigation using geoelectrical method: A case study of the Western region of Cameroon. Journal of Water Ressource and Protection, 5(6): 633-641. http://dx.doi.org/10.4236/jwarp.2013.56064
[24] Njueya Kopa, A., Kengni, L., Fonteh, F.M., Kagou Dongmo, A., Ntankouo Njila, R., Nkouathio, D.G., Tazo C. (2016). Apport des sondages électriques verticaux à la localisation et la caractérisation des aquifères dans l’Arrondissement d’Ebone et ses environs. European Journal of Scientific Research, 1(138): 54-65.
[25] Sombo Abé, P., Francis, W., Boko, C., Loukou, N., Eric G. (2011). Contribution de la prospection électrique à l’identification et à la caractérisation des aquifères de socle du département de Sikensi (Sud de la Côte d’Ivoire). Euro Journals Publishing, 2: 206-219.
[26] Kouassi Kouakou, E.G., Dosso, L., Kouame, L.N., Sombo Abé, P., Sombo Boko, C. (2015). Contribution des méthodes de résistivité électrique à la recherché d’eau en milieu cristallin: cas de Yakassé-Attobrou et d’Abié, région de la Mé, Côte d’Ivoire. Rev.Sci.Technol., 26: 194 - 211.
[27] Coulibaly, A., Lasm, T., Kouadio, K.E., Kouassi, W.F., De Lasme, O.Z., Baka, D., Yao, K.T., Savane, I., Biemi, J. (2014). Contribution of electrical resistivity method to the location of aquifers of Precambrian basement in the department of Tanda (North-Eastern Côte d’Ivoire). Journal of Scientific Research and Reports, 3(5): 722-741. https://doi.org/10.9734/JSRR/2014/6463
[28] Toluwaleke, A., Bola, A., Rereloluwa, B. (2019). Geoelectric assessment of groundwater potential in supare Akoko, Southwestern, Nigeria. Environmental and Earth Sciences Research Journal, 6(2): 59-70. https://doi.org/10.18280/eesrj.060202
[29] Boudoukha, A., Messaid, B. (2014). Caractérisation électrique des formations aquifères de l’Est Algérien. Courrier Du Savoir, 18: 77-82.
[30] Penz, S. (2012). Modélisation et inversion des données électriques en courant continu: vers une prise en compte efficace de la topographie. Thèse de Doctorat de l’école nationale supérieure des mines de Paris.
[31] Arétouyap, Z., Nouayou, R., Njandjock, N.P., Asfahani, J. (2015). Aquifers productivity in the Pan-African context. Journal of Earth System Science, 124: 527-539. https://doi.org/10.1007/s12040-015-0561-1
[32] Wyns, R., Baltassat, J.M., Lachassagne, P., Legchenko, A., Vairon, J., Mathieu, F. (2004). Application of SNMR sounding for groundwater reserves mapping in weathered basement rocks (Brittany, France). Bulletin Société Géologique France, 175(1): 21-34. https://doi.org/10.2113/175.1.21
[33] Kouassi Amani, M., Okaingni, J.C., Kouakou Koffi, E., Biemi, J. (2013). Evaluation des propriétés hydrauliques des aquifères de socle cristallin et cristallophyllien: cas de la région du N’zi-Comoé (Centre – Est de la Côte d’Ivoire). International Journal of Innovation and Applied Studies, 2(1): 61-71.
[34] Lachassagne, P., Wyns, R., Dewandel, B. (2011). The fracture permeability of hard rock aquifer is due neither to tectonics, nor to unloading, but to weathering processes. Terra Nova, 23: 145-161. https://doi.org/10.1111/j.1365-3121.2011.00998.x
[35] N’go, Y.A., Goné, D.L., Savané, I., Goblé, M.M. (2005). Potentialités en eaux souterraines des aquifères fissurés de la région d’Agboville (Sud Ouest de la Côte d’Ivoire): Caractérisation hydroclimatique et physique. Afrique Sciences, 1(01): 127-144.
[36] Gnamba, F.M., Oga Yeï, M.S., Gnangne, T., Lasm, T., Biémi, J., Kouakou Yao, K.N. (2014). Analyse de la productivité des aquifères de fissures du socle paléoprotérozoïque de la région de Katiola (Centre –Nord de la Côte d’Ivoire). European Scientific Journal, 5(10): 1857-7881.
[37] Adomako, D., Gibrilla, A., Akiti, T.T., Fianko, R., Maloszewski, P. (2011). Hydrogeochemical evolution and groundwater flow in the Densu river basin, Ghana. Journal of Water Ressource and Protection, 3(7): 548. https://doi.org/10.4236/jwarp.2011.37065
[38] Edet, A., Nganje, T. N., Ukpong, A. L., Ekwere, A. S. (2011). Groundwater chemistry and quality of Nigeria: A status review. African Journal of Environmental Science and Technology., 5(13): 1152-1169. https://doi.org/10.5897/AJESTX11.011
[39] Sunkari, E.D., Abu, M., Bayowobie, P.S., Dokuz, U.E. (2019). Hydrogeochemical appraisal of groundwater quality in the Ga west municipality, Ghana: Implication for domestic and irrigation purposes. Groundwater for Sustainable Development, 8: 501-511. https://doi.org/10.1016/j.gsd.2019.02.002
[40] Nono, A., Temgoua, E., Likeng, J.D.H., Djoukouo, T.J.P. (2008). Influence de la nature lithologique et des structures géologiques sur la qualité des eaux souterraines sur le versant Nord des Monts Bambouto (Hautes terres de l’Ouest-Cameroun): cas du village Balepo et de ses environs. Africa Geoscience Review, pp. 149-162.
[41] Nono, A., Likeng J.D.H., Wabo H., Tabue Y.G., Biaya S. (2009). Influence de la nature lithologique et des structures géologiques sur la qualité et la dynamique des eaux souterraines et des sources dans les hauts plateaux de l’Ouest-Cameroun. International Journal of Biological and Chemical Sciences, 3(2): 218-239.
[42] Nono, A., Djeuda Tchapnga, H.B., Njonfang, E., Tella, N.F.N., Tabué Youmbi, J.G., Bouopda, J.F. (2001). Influence de la lithologie et des structures géologiques sur la qualité des eaux souterraines et des sources dans les hauts plateaux de l’Ouest-Cameroun. 12th International conference of the geological society of Africa. Geo environmental catastrophes in Africa. Journal of the Geosciences of Cameroon, 105-196.
[43] Piper, A.M. (1944). A graphic procedure in the geochemical interpretation of water analysis. Transactions American Geophysical Union, 25(6): 914-929. https://doi.org/10.1029/TR025i006p00914
[44] Aka, F.T., Kusakabé, M., Nagao, K., Taniyléké, G. (2000). Noble gas isotopic composition and water/gas chemistry of Soada springs from the island of Bioko, Sao Tome, and Annobon, along with Cameroon volcanic line, West Africa. Applied Geochemistry, 16(3): 323-338. https://doi.org/10.1016/S0883-2927(00)00037-8
[45] Gibbs, R.J. (1970). Mechanisms controlling worlds water chemistry. Science, 170(3962): 1088-1090. https://doi.org/10.1126/science.170.3962.1088
[46] Hendry, M.J., Wassenaar, L.I. (2000). Controls on the distribution of major ions in pore waters of a thick surficial aquitard. Water Resources Research, 36(2): 503-513. https://doi.org/10.1029/1999WR900310