Mwanret G. Daful* | Cyril K. Ezeamaka | Moses Ogbole | Hosea Sani | Queen O. Sadiq
OPEN ACCESS
This paper examined the possible breading space of tsetse flies in Ikom Local Governement Area and it’s environs in Cross River State, Nigeria, using remote sensing and geographic information system techniques. The study used supervised classification techniques with maximum likelihood algorithms to classify the satellite imagery in to four categories as vegetation–agriculture, water bodies, built-up lands, and other land uses and digitized all the rivers on the imagery as polylines. A buffer operation of 1km away from the digitized area was done; an overlaid analysis was carried out on the buffered operation and the classified image, so as to analyze the probability of breeding of the tsetse flies on each parcel of land. The study grouped the possible breeding sites of the tsetse flies into three; most probable, moderately probable and less probable breeding space. Result of the findings reveals that 48.496 Hectares (24.64 %) is most probable for tsetse flies to breed on, 107.54 hectares (54.24 %) is moderately probable, and 42.231 Hectares (21.3 %) is less probable. Based on the findings of the study it’s apparent that Ikom Local Governement Area and it’s environs provide a good breeding space and habitat for tsetse flies, it becomes imperative for all stakeholders in the control and eradication of tsetse flies, to work towards its total eradication in the area.
breeding sites, probable, tsetse flies, trypanosomes, trypanosomiasis, remote sensing and GIS
Tsetse flies (Glossina spp.) are a family of bloodsucking Dipteran insects of Africa. They are very common in tropical and subtropical regions south of the Sahara. They are vectors of human and veterinary trypanosomiasis (sleeping sickness) and this makes them one of the most harming pests in Africa, especially for cattle [1]. Their distribution and prevalence are most influenced by spatial factors such as climate, vegetation and land utilization [2]. According to Junquera [1] there are about 30 species of the genus Glossina, each one with a different distribution and prevalence, whereby various species can share a common environment.
Tsetse flies live in areas that provide ideal conditions for every stage of their life cycle. Precisely, tsetse flies live in habitats that provide shade for developing puparia and resting sites for adults [3]. Tsetse are characterized with a low reproductive rate giving birth to one larva by the mature female adult after one to nine days of egg deposition in the uterus. The larva burrows into the ground from where it pupates within a few hours without any feeding at all. The pupa transforms itself into a live adult fly from beneath the soil layer after 30 days [4]. The adult fly takes 12 to 14 days to mature in preparation for mating. Like most of insects, tsetse flies have a life cycle which is constituted by four major stages (i.e. egg, larva, pupa and adult). The key difference is that for the tsetse fly, the egg is simply deposited and held in the uterus of the mother fly until it is converted into a larva. It is the larva that is released from the mother fly and buries itself in the sub-soil. The process of converting from larva into pupa is done within the sub-soil. The pupa will hatch into an adult and then exit the sub-soil onto the surface [4].
Tsetse flies are a class of insects that are very sensitive to environmental changes and ecological instability [5]. This implies that tsetse flies are found in ecologically suitable habitats which have the necessary temperature; humidity and vegetation cover [4, 6]. Generally, tsetse thrives best in areas with mean annual temperatures of 19-30 ℃. Temperatures below 19 ℃ will slow down tsetse activity and general physiology [5]. Such unfavorable conditions will prevent the tsetse from flying and carrying out normal life functions. The tsetse will be unable to move to find a host for a blood meal, leading to its starvation [7]. Under extreme temperatures of below 10oC, tsetse will die within 3 hours of exposure [3].
The main habitats of tsetse flies are local patches of dense vegetation along banks of rivers and lakes in arid terrain, and also in dense, wet, heavily forested equatorial rainforest. Many tsetse flies hide in holes in the trunks of trees and between roots and they spend most of the day at rest in shaded places in forested areas [4]. When tsetse flies are on the move, they are searching for hosts from which to take a blood meal or for resting places partly or wholly by sight [8-9].
Tsetse are biological vectors of trypanosomes meaning that tsetse, in the process of feeding, acquire and then transmit small, single-celled organisms called trypanosomes from infected vertebrate hosts to uninfected animals [4]. Some tsetse-transmitted trypanosome species cause trypanosomiasis, an infectious disease. In humans, tsetse transmitted trypanosomiasis is called sleeping sickness while in animals it’s called nagana, souma, and surra according to the animal infected and the trypanosome species involved, although the usage is not strict and nagana is occasionally used for any form of animal trypanosomiasis. Trypanosomes are animal parasites, specifically protozoa of the genus Trypanosoma [3].
Tsetse flies (Glossina spp.) are distributed over a large part of sub-Saharan Africa (about 107 KM2) and are the common vectors of the trypanosome that causes serious disease in both livestock and humans [10]. Trypanosomiasis is considered a neglected tropical disease associated with an agriculture loss of up to US$4.5 billion per year, with as many as three million cattle dying each year worldwide [11, 12]. Furthermore, about 60 million humans are at risk of contracting the disease and more than 10,000 cases are reported each year across Africa [13-14].
Lillesand et al. [15] in their book "Remote Sensing and Image Interpretation" defined "Remote Sensing as the science and art of obtaining information about an object, area, or phenomenon through the analysis of data acquired by a device that is not in contact with the object, area, or phenomenon under investigation." typically from aircraft or satellites. Geographic Information System (GIS) and remote sensing are precious instruments to assist health researchers in management, planning, monitoring and evaluation for disease in an area. GIS has been defined as the science and technology related to the gathering, storage, manipulation, analysis and visualization of geo-referenced data [16].
Several researches have been done on vectors breading space, their diseases and control such as; Elias and Tim-Robinson study on GIS and multiple-criteria evaluation for the optimisation of tsetse fly eradication programmes [17]. Mugenyi studied the spatial distribution of tsetse (Diptera: Glossinidae) within the trypanosoma brucei rhodesiense focus of Uganda [18]. Palaniyandi examined the role of remote sensing and GIS for spatial prediction of vector-borne diseases transmission [19]. Cecchi, Mattioli, Slingenbergh and Rocque study focus on land cover and tsetse fly distributions in sub-Saharan Africa [20]. Pagabeleguem, Ravel, Dicko, Vreysen, Parker and Takac examined the influence of temperature and relative humidity on survival and fecundity of three tsetse strains [21]. Bouyer, Dicko, Cecchi, Ravel, Guerrini, Solano maped landscape friction to locate isolated tsetse populations that are candidates for elimination [22]. Tirmizi and Tirmizi looks at GIS based risk assessment of oil and gas infrastructure in Sindh, Pakistan [23]. Ngonyoka, Gwakisa, Estes, Nnko, Hudson and Cattadori assessed the variation of tsetse fly abundance in relation to habitat and host presence in the Maasai Steppe [24]. Alderton, Macleod, Anderson, Palmer, Machila, Simuunza, Welburn, and Atkinson studied the agent-based model of tsetse fly response to seasonal climatic drivers: Assessing the impact on sleeping sickness transmission rates [25]. Onyekwelu, Ejezie, Eze, Ikekpeazu, Ezeh, and Edeh, surveyed the prevalence of trypanosome infection in tsetse flies from Oji River and Emene axis of Enugu State, Nigeria [26]. However, none of these studies look at the application of remote sensing and GIS to predict probable breading habitat for tsetse flies.
The use of out-dated maps for decision support has presents challenges in the quest to break the trypanosomiasis transmission chain [27]. Thus, in view of the various menace caused by the tsetse flies to human and animals, its control is imperative. Knowledge of background information such as the possible land area as well as extent of its breeding space is essential in planning for the control and eradication of the tsetse fly and the disease it cause. This is essential because it will aid the researcher examine the area and adopts the best possible method for the total eradication of the tsetse flies in that area. To this end this study uses remote sensing and geographic information system techniques, to examine the possible breading space of tsetse flies in Ikom Local Governememnt Area (LGA) and its environs in Cross River State, Nigeria.
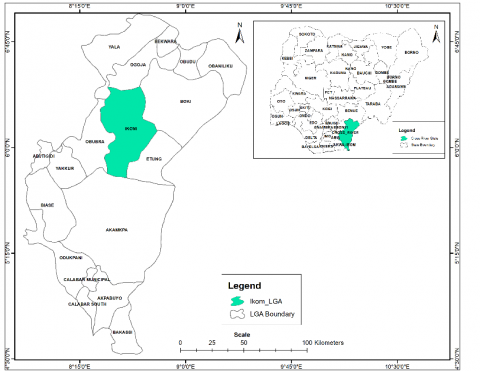
Figure 1. Cross River State showing Ikom LGA source: Cross River State ministry of land and survey (2014)
Ikom Local Covernment Area is one of the 18 LGAs in Cross River State, Nigeria. Its headquarter is in the town of Ikom, Ikom Local Government Area falls between Latitudes 5°47'N to 6°26'N of the equatorial plane and Longitudes 8°24'E to 8°48'E of the Greenwich Meridian as shown in Figure 1. It is located at the rain forest vegetation belt of Nigeria, and has an area of 1,982.67 km² and a population of 162,383 as at the 2006 census [28]. Ikom LGA belongs to tropical rainfall belt where rainfall is usually seasonal and at times very heavy. Humid tropical climate of about 1300 to 3000 mm rain fall and 30 °C mean annual temperatures prevail over Ikom LGA and it’s environs in Cross River State. The vegetation ranges from mangrove swamps to rainforest. The map of Nigeria showing the location of Ikom LGA is presented in figure 1.
Materials: A personal computer equipped with the Arc GIS 10.5 package software.
Data: Nig sat X imagery of 2013 with a spatial resolution of 22 meters of the study area was acquired from Nigerian Space Reseach and Development Agency (NASRDA).
Criteria: the study groups the possible breeding space of the tsetse flies into three; most probable, moderately probable and less probable breeding space. The vegetation area within 1km of rivers marshy areas are termed most probable breeding space, this is because the vegetation in that area are denser and the soil moist provides good shades which is an excellent habitat for the tsetse, and home for most wild animals in which the tsetse found as source of food. Other vegetation area within the study area will be termed moderately probable breeding space, as they also provide shades and moist soils for the flies to reproduce. Other land uses within the area will be termed less probable breeding space, since there are chances of them breading under log of wood within residential area and stones.
Procedure: Mather considered classification to be the process of pattern recognition of the pattern associated with each pixel position in an image in terms of the characteristics of the objects or materials present at the corresponding point of the Earth’s surface [29]. Its major functions are spatial, spectral and temporal pattern recognition [30]. Maximum likelihood classification algorithm was used. This is the process of assigning individual pixels of a multispectral image to categories, generally based on spectral characteristics of known parts of an image scene. It involves training the computer to make some interpretative decisions in a less biased way. The intent of the classification process is to categorize all pixels in a digital image into one of several land cover classes, or “themes”. This categorized data may then be used to produce thematic maps of the land cover present in an image. The objective of image classification is to identify and portray, as a unique gray level (or colour), the features occurring in an image in terms of the object or type of land cover these features actually represent on the ground.
The standard image processing techniques such as image extraction, rectification, restoration, and classification were applied in the study. The Nig Sat X imagery was used to create a False Colour Composite (FCC). Training polygons were chosen from the composite image and corresponding attribute data was obtained in the field using GPS. Based on these, signatures were produced, corresponding to various land features; image classification was done using the Maximum Likelihood Classifier. The images were classified into four broader categories as vegetation–agriculture, water bodies, built-up lands, and other land uses, as shown in Figure 2. All the rivers on the satellite imagery were digitized as poly-lines, this was to enable it to convert the raster area of the rivers in to vectors form, for the purposed of easy buffering. A buffer zone of 1km away from the digitized area was created so as to be able to determine the most probable breeding area extend. An overlaid analysis was carried out on the buffered operation and the classified image, so as to analyze the probability of breeding of the tsetse flies on each parcel of land. The results of the study are presented as image maps and tables.
3.1 Results presentation
Table 1. Land Use Land Cover Distribution of the study area
|
Land Used/Cover Categories |
Area (Hectares) |
Percentage |
|
Vegetation Water Bodies Built-Up Area Other land Used |
148.343 7.693 3.469 38.762 |
74.8 % 3.88 % 1.75 % 19.55 % |
|
Probability |
Land Area (Hectares) |
Percentage |
|
Most Probable Moderately Probable Less Probable |
48.496 107.54 42.231 |
24.64 % 54.24 % 21.3 % |
Figure 2. Classified image of Ikom LGA and environs
Figure 3. Tsetse flies breeding space probability map
3.2 Discussion of results
From the classified image in Figure 2, the area highlighted as vegetation-agriculture, water bodies, built-up lands, and other land use were computed and tabulated accordingly for further analyses as shown in Table 1. The results of the studies from Table 1, shows that vegetation covered an area of 148.343 Hectares (74.8 %), the implication is that vegetation dominates the land cover of the study area, providing a good home for wild animals and a breeding space and habitat for the tsetse flies while water bodies cover an area of 7.693 Hectares (3.88 %), thus implying that there is enough water for the wild animals and the vegetation to thrive as well as providing good moist soil for the breeding of the tsetse flies. However,built up area covered an area of 3.469 Hectares (1.75 %), this shows the extent of land development in the area, distorting the natural breeding space of the tsetse flies, making breeding in such areas difficult for the flies. Other land uses covered an area of 38.762 Hectares (19.55 %).
Further analysis on the probability of breeding space of the tsetse flies revealed that 48.496 Hectares (24.64 %) of the area is most probable for tsetse flies to breed, depicted by the dark green color area in Figure 3, computed and tabulated accordingly as shown in Table 2. This implies that the chances of the flies breeding in 48.496 hectares are very high since the area provides an excellent breeding space for the flies. 107.54 hectares (54.24 %) of the area is moderately probable for the tsetse flies to breed, this is depicted by the olive green color in Figure 3, and implies that the area provides not only a fair chance for the flies to breed but served as a good habitat for them, hence, there are good chances of them breeding in such areas. The 42.231 Hectares (21.3 %) of the land area is less probable for the tsetse flies to breed on, which is depicted by the yellow color in Figure 3, and implies that breeding in such areas is very difficult for the tsetse flies, as a result of human activities and the absence of conducive environment for the flies to thrive and breed. A composite map showing the final probability of breeding space for the tsetse flies in Ikom LGA and it’s environs is as shown in Figure 3.
Anderson (2002) noted that since planning is an act of preparation for future action, availability of background information constitutes a major preliminary exercise in the planning process [31]. It is also pertinent to note that one essential pre-requisite of any planning exercise is a clear understanding of the existing condition in a given area. Hence, availability of background information such as this is essential for the control and eradication of tsetse flies in any area.
This study was formulated to examine probable tsetse flies breeding space, showing areas most probable, moderately probable and less probable for tsetse flies to breed. Based on the findings of the study it’s apparent that Ikom LGA and environs provide a good breeding space and habitat for tsetse flies, hence people and animals in the area are in danger of the vector diseases caused by tsetse flies. Thus, based on the breeding space probability map produce in Figure 3, it will be desirable for all stakeholders in the control an eradication of the flies to use it for the planning of various control measures towards the total control and eradication of the flies in the study area.
[1] Junquera P. (2014). Tsetse flies - glossina spp - on cattle, sheep, goats, swine and other livestock: Biology, prevention and control. https://parasitipedia.net
[2] Rogers DJ, Hay SI, Packer MJ. (1996). Predicting the distribution of tsetse flies in west Africa using temporal Fourier processed meteorological satellite data, anim. Trop. Med. Parasitol 96(3): 225-241. https://doi.org/10.1080/00034983.1996.11813049
[3] Rogers DJ, Robinson TP. (2004). Tsetse distribution. In I. Maudlin, P. H. Holmes & M.A. Miles, eds. The Trypanosomiases, Wallingford, UK, CABI Publishing.
[4] Leak SGA. (1999). Tsetse biology and ecology their role in the epidemiology and control of trypanosomosis. CAB Wallingford, UK.
[5] Terblanche JS, Clusella-Trullas S, Deere JA, Chown SL. (2008). Thermal tolerance in a south-east African population of the tsetse fly Glossina pallidipes (Diptera, Glossinidae): Implications for forecasting climate change impacts. J. Insect Physiol. 54(1): 114–127. https://doi.org/10.1016/j.jinsphys.2007.08.007
[6] FAO. (1982). Training manual for tsetse control personnel: Ecology and behaviour of tsetse. J.N. Pollock, ed.
[7] Hargrove JW. (2001). Factors affecting density-independent survival of an island population of tsetse flies in Zimbabwe. Entomologia Experimentalis et Applicata 100(2): 151-164. https://doi.org/10.1046/j.1570-7458.2001.00858.x
[8] WHO. (1997). Tsetse flies. In vector control: Methods for use by individuals and communities. Edited by Rozendaal, J.A. Geneva, pp. 178-209.
[9] Steverding D, Troscianko T. (2004). On the role of blue shadows in the visual behaviour of tsetse flies. Proc. Biol. Sci. 271(Suppl 3): S16-S17. https://doi.org/10.1098/rsbl.2003.0121
[10] Kristjanson PM, Swallow BM, Rowlands GJ, Kruska RL, de Leeuw PN. (1999). Measuring the costs of African animal Trypanosomosis, the potential benefits of control and returns to research. Agric. Sys. 59: 79-98. https://doi.org/10.1016/S0308-521X(98)00086-9
[11] Schofield CJ, Kabayo JP. (2008). Trypanosomiasis vector control in Africa and Latin America. Parasites & Vectors 1: 24. https://doi.org/10.1186/1756-3305-1-24
[12] Muturi CN, Ouma JO, Malele II, Ngure RM, Rutto JJ, Mithöfer KM, Enyaru J, Masiga DK. (2011). Tracking the feeding patterns of tsetse flies (Glossina genus) by Masiga, analysis of bloodmeals using mitochondrial cytochromes genes. PloS One 6(2): e17284. https://doi.org/10.1371/journal.pone.0017284
[13] Ruiz-Postigo JA, Franco JR, Lado M, Simarro PP. (2012). Human African trypanosomiasis in South Sudan: How can we prevent a new epidemic? PLoS Negl. Trop., Dis. 6: e1541. https://doi.org/10.1371/journal.pntd.0001541
[14] Funk S, Nishiura H, Heesterbeek H, Edmunds WJ, Checchi F. (2013). Identifying Transmission cycles at the human-animal interface: The role of animal reservoirs in maintaining Gambiense Human African Trypanosomiasis. PLoS. Comput. Biol. 9. https://doi.org/10.1371/journal.pcbi.1002855
[15] Lillesand T, Kiefer WR, Chipman J. (2015). Remote sensing and image interpretation. 7th Edition, John Wiley and Sons, New York.
[16] Burough P. (2001). Principles of geographical information system, spatial information systems and Geostatistics. New York: Oxford University Press, p. 20.
[17] Elias S, Tim-Robinson ND. (2007). GIS and multiple-criteria evaluation for the optimisation of tsetse fly eradication programmes. Environmental Monitoring and Assessment 124(1-3): 89-103. https://doi.org/10.1007/s10661-006-9210-0
[18] Mugenyi AW. (2014). The spatial distribution of tsetse (Diptera: Glossinidae) within the Trypanosoma brucei rhodesiense focus of Uganda. Phd Thesis, University of Edinburgh.
[19] Palaniyandi, M. (2012). The role of remote sensing and GIS for spatial prediction of vector-borne diseases transmission: A systematic review. Journal of Vector Borne Diseases 49(4): 197-204.
[20] Cecchi G, Mattioli RC, Slingenbergh J, Rocque SD. (2008). Land cover and tsetse fly distributions in sub-Saharan Africa. Medical and Veterinary Entomology 22(4): 364–373. https://doi.org/10.1111/j.1365-2915.2008.00747.x
[21] Pagabeleguem S, Ravel S, Dicko AH, Vreysen MJB, Parker A, Takac P. (2016). Influence of temperature and relative humidity on survival and fecundity of three tsetse strains. Parasites and Vectors 9: 520. https://doi.org/10.1186/s13071-016-1805-x
[22] Bouyer J, Dicko AH, Cecchi G, Ravel S, Guerrini L, Solano P. (2015). Mapping landscape friction to locate isolated tsetse populations that are candidates for elimination. Proc Natl Acad Sci. 112(47): 14575–14580. https://doi.org/10.1073/pnas.1516778112
[23] Tirmizi ST, Tirmizi SRI. (2017). GIS based risk assessment of oil and gas infrastructure in Sindh, Pakistan. Environmental and Earth Sciences Research Journal 4(3): 55-59. https://doi.org/10.18280/eesrj.040301
[24] Ngonyoka A, Gwakisa PS, Estes AB, Nnko HJ, Hudson PJ, Cattadori IM. (2017). Variation of tsetse fly abundance in relation to habitat and host presence in the Maasai steppe, Tanzania. Journal of Vector Ecology 42(1): 34–43. https://doi.org/10.1111/jvec.12237
[25] Alderton S, Macleod ET, Anderson NE, Palmer G, Machila N, Simuunza M, Welburn SC, Atkinson PM. (2018). An agent-based model of tsetse fly response to seasonal climatic drivers: Assessing the impact on sleeping sickness transmission rates. PLoS Negl Trop Dis 2: 10. https://doi.org/10.1371/journal.pntd.0006188
[26] Onyekwelu KC, Ejezie FE, Eze AA, Ikekpeazu JE, Ezeh RC, Edeh GC. (2017). Prevalence of trypanosome infection in tsetse flies from Oji river and emene axis of Enugu State, Nigeria: A preliminary report. Trop Parasitol 7(2): 98–102. https://doi.org/10.4103/tp.TP_14_17
[27] Moore N, Messina J. (2010). A landscape and climate data logistic model of tsetse distribution in Kenya. Plos ONE 5(7): e11809. https://doi.org/10.1371/journal.pone.0011809
[28] National Population Commission (2009). Federal Republic of Nigeria Official Gazette. The Federal Government Printers Lagos, Nigeria, pp. 493-500.
[29] Mather PM. (1999). Computer Processing of Remotely Sensed Images – An Introduction. John Wiley and sons, Wiley, Toronto.
[30] Syed A, Abdulla SMS. (2002). Assessing desert vegetation cover using remotely sensed data: A case study from the state of Qatar. www.gisdevelopment.net.
[31] Anderson TA. (2002). Planning the built environment. Planners Press American Planners Association. Chicago, Washinton D.C., pp. 1-214.