© 2018 IIETA. This article is published by IIETA and is licensed under the CC BY 4.0 license (http://creativecommons.org/licenses/by/4.0/).
OPEN ACCESS
The unified power quality compensator (UPQC) is a one of the best solutions used in industry to mitigate both voltage- and current-based power quality problems. Fail in UPQC can affect the power line and generate a hardly detectable fault due to its specific architecture. Therefore, a signal processing technique is required to detect and localize the damage. The technique used must reach three goals. The first one, identify the damaged inverter. Second one localizes which leg is affected and the last one detects the failed switch. An automatic tool based on Artificial Neural Network (ANN) is applied to identify and localize the faulty switch. The features extracted from time and frequency domain are used to train and test the ANN classifier model.
UPQC, active power filter, ANN, fault detection, open switch fault, FFT, skewness
Electric power quality is important in the transmission, distribution and the use of electrical power. The power quality can be disturbed by voltages or currents fluctuations. However, electrical power distribution systems are facing severe power quality (PQ) problems of voltages and currents (reactive power burden, unbalanced loads, voltage sag, swell, surges, notches…) (Singh et al., 2015). Improving the quality of power line plays an important role in industry. The UPQC system offers a good solution to improve the quality affected by external or internal disturbances, it’s composed of two inverters voltage source converters and current source converters. The Parallel Active Filter deals with current changes and removes harmonics responsible of disturbances. The Series Active Filter offers a solution to improve the voltage quality (Singh et al., 2015).
The performance of the power line is related to the UPQC state. Sometimes, failures in UPQC devices can corrupt the quality. Identifying the sources of disturbances is very difficult and hardly detectable. These failures affect electrical machines and even destroy the electrical parts. To solve this problem, various fault diagnostic methods have been developed during the last decade and many researchers have proposed various methods.
Considered various fault modes of a voltage source PWM inverter system for induction motor drive (Kastha and Bose, 1994). They have studied rectifier diode short circuit; inverter transistor base driver open and inverter transistor short-circuit conditions. However, they do not propose to reconfigure the inverter topology.
Was interested in fault tolerant control of induction motor drive applications using analytical redundancy, providing solutions to most frequent occurring faults (Thybo, 2001).
In Xu et al., (2008) have describing many methods used in detection, and they describe a technique of neural network with orthogonal basis functions based on recursion least square is utilized to transform signals in order to achieve harmonic characteristic for classifying fault type.
Benslimane and Thameur, (2009) presents a fault diagnosis method based on classical currents measurements including combinatory logic to analyze and validate error signals. They demonstrate that a change in active filter signal waveform is defined as the instant at which a sudden increase or decrease is observed in the DC offset component of the signal. Fault detection is based on the calculation of zero harmonic components.
Suggested the use of the average absolute values of current to detect faulty phase and faulty switches (Ubale et al., 2013).
There are many works carried out on fault detection and diagnosis and they have tended to move from traditional techniques to artificial intelligence. A. Rohan and S. Ho Kim (Ali et al., 2016) have proposed to use Discrete wavelet transform (DWT) on the Clarke transformed (-) stator current and extracted features from the wavelets. An artificial neural network (ANN) is then used for the detection and identification of single and multiple switching faults. In this paper, we explore a new technique for the open switch fault detection, applied on an UPQC system, based on SVPWM control strategy feeding a nonlinear load. The new approach of a fault diagnostic system is presented based on the use of ANN in order to automate the fault detection and localization. The features (Input data) of the ANN model are extracted from the variation of current and voltage signals, enables us to extract useful information related to the open- switch faults on UPQC system. The data extracted in Frequency domain are computed by FFT and in Time-domain by computing the skewness, for both healthy and faulty states to develop a very rich database. The database will be used to train the ANN model to detect and localize the inverter and the switch responsible of the fluctuations on the transmission line.
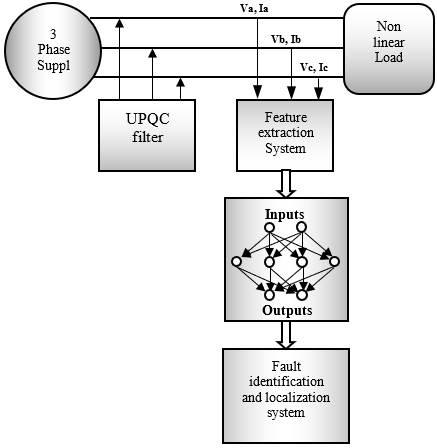
The UPQC is a power electronic device, which is a combination of shunt and series compensators shown in Figure 1 (Singh et al., 2015). It is used to mitigate both load current as well as supply voltage imperfections. A UPQC works in simultaneous voltage and current control modes, it depends on the series and shunt APF controller at the same time. The purpose of the shunt device named the SHUNT APF, is to mitigate the current quality problems. It acts as a controlled current generator that compensated the load current and the source current drained from the network will become balanced, sinusoidal and in phase with the positive-sequence system voltages. It compensates reactive current of the load and improves power factor. The series component of the UPQC called the SERIES APF is responsible to provide a compensating voltage to keeps the load end voltage insensitive to the supply voltage quality problems such as sags/swells, flicker, voltage unbalance and harmonics. The SERIES APF inserts voltages between the supply and the consumer load to maintain the load voltages at a desired level (Singh et al., 2015; Anjali et al., 2010; Sandhya et al., 2010; Benachaiba et al., 2010; Aredes et al., 2003).
Figure 1. General model of UPQC
The main objective of a control algorithm in the active power filters is to maintain a stable power quality under any disturbances. There are many control strategies reported in the literature to find out the reference values of the voltage and the current of UPQC. Most of the control algorithms used for the SHUNT APF and SERIES APF are applied to the UPQC. The Figure 2 shows the block diagram for control strategies of an UPQC system. These control algorithms are classified as time-domain and frequency-domain control algorithms. Some of them are as follows: The Instantaneous reactive power (PQ or α–β) theory, synchronous reference frame (SRF or d–q) theory, Artificial Neural network theory, fuzzy control algorithm and instantaneous symmetrical component theory... The SHUNT APF and SERIES APF are controlled separately for power quality enhancement in the current and voltage, respectively. The SHUNT APF and SERIES APF controller offer the advantage to mitigate the disturbance with precision, fast response, flexibility, robustness and ease implementation (Singh et al., 2015).
Figure 2. Control strategies of the UPQC
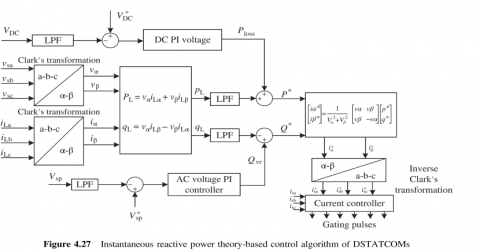
3.1. Estimation of reference voltage (Singh et al., 2015)
The Instantaneous Reactive Power control algorithm of SHUNT APFs is shown in Figure 3. Three-phase load currents (iLA; iLB; iLC) and point of common coupling (PCC) voltages (vsa; vsb; vsc) are sensed and filtered. These three-phase filtered load voltages and load currents are transformed into two-phase α–β orthogonal coordinates (Vα, Vβ) and (iLα, iLβ) respectively as:
$\left(\begin{array}{c}{\mathrm{v}_{\alpha}} \\ {\mathrm{v}_{\beta}}\end{array}\right)=\sqrt{\frac{2}{3}}\left(\begin{array}{ccc}{1} & {-\frac{1}{2}} & {-\frac{1}{2}} \\ {0} & {\frac{\sqrt{3}}{2}} & {-\frac{\sqrt{3}}{2}}\end{array}\right)\left(\begin{array}{l}{\mathrm{V}_{\mathrm{sa}}} \\ {\mathrm{V}_{\mathrm{sb}}} \\ {\mathrm{v}_{\mathrm{sc}}}\end{array}\right)$ (1)
$\left(\begin{array}{c}{\mathrm{i}_{\mathrm{L} \alpha}} \\ {\mathrm{i}_{\mathrm{L} \beta}}\end{array}\right)=\sqrt{\frac{2}{3}}\left(\begin{array}{ccc}{1} & {-\frac{1}{2}} & {-\frac{1}{2}} \\ {0} & {\frac{\sqrt{3}}{2}} & {-\frac{\sqrt{3}}{2}}\end{array}\right)\left(\begin{array}{l}{\mathrm{i}_{\mathrm{La}}} \\ {\mathrm{i}_{\mathrm{Lb}}} \\ {\mathrm{i}_{\mathrm{Lc}}}\end{array}\right)$ (2)
The calculation of instantaneous active and reactive power (pL, qL) as:
$\left(\begin{array}{c}{\mathrm{p}_{\mathrm{L}}} \\ {\mathrm{q} \mathrm{L}}\end{array}\right)=\left(\begin{array}{ll}{\mathrm{V}_{\alpha}} & {\mathrm{V}_{\beta}} \\ {\mathrm{V}_{\beta}} & {-\mathrm{v}_{\alpha}}\end{array}\right)\left(\begin{array}{l}{\mathrm{i}_{\mathrm{L} \alpha}} \\ {\mathrm{i}_{\mathrm{L} \beta}}\end{array}\right)$ (3)
The DC components of active and reactive powers are extracted by using two low-pass filters (LPFs), and these quantities are processed to generate reference current commands $\mathbf{i}_{\mathrm{sa}}^{*} ; \mathbf{i}_{\mathrm{sb}}^{*}$ and $\dot{\mathbf{I}}_{\mathbf{S} \mathbf{C}}^{*}$. The reference three-phase supply currents $\mathbf{i}_{\mathrm{sa}}^{*} ; \mathbf{i}_{\mathrm{sb}}^{*}$ and $\dot{\mathbf{I}}_{\mathbf{S} \mathbf{C}}^{*}$ are estimated as
$\left(\begin{array}{c}{\mathrm{i}_{\mathrm{sa}}^{*}} \\ {\mathrm{i}_{\mathrm{sb}}^{*}} \\ {\mathrm{i}_{\mathrm{sc}}^{*}}\end{array}\right)=\sqrt{\frac{2}{3}}\left(\begin{array}{cc}{1} & {0} \\ {-\frac{1}{2}} & {\frac{\sqrt{3}}{2}} \\ {-\frac{1}{2}} & {-\frac{\sqrt{3}}{3}}\end{array}\right)\left(\begin{array}{cc}{\mathrm{V}_{\alpha}} & {\mathrm{V}_{\beta}} \\ {-\mathrm{V}_{\beta}} & {\mathrm{V}_{\alpha}}\end{array}\right)^{-1}\left(\begin{array}{l}{\mathrm{p}^{*}} \\ {\mathrm{q}^{*}}\end{array}\right)$ (4)
These reference supply currents $\mathbf{i}_{\mathrm{sa}}^{*} ; \mathbf{i}_{\mathrm{sb}}^{*}$ and $\mathbf{i}_{\mathbf{S C}}^{*}$, with the respective sensed supply currents ($\mathbf{i}_{\mathbf{s a}}^{*}, \mathbf{i}_{\mathbf{s b}}^{*}, \mathbf{i}_{\mathbf{s c}}^{*}$) are fed to a current controller to generate the switching signals for controlling the APF and injecting the appropriate current in the system to mitigate the power quality problems. the control algorithms to compute the voltage compensation reference $\mathrm{V}_{\mathrm{Sa}}^{*}; \mathrm{V}_{\mathrm{Sb}}^{*}$ and $\mathrm{V}_{\mathrm{SC}}^{*}$, of the series active power filter are similar to the control algorithm of the shunt active power filter. The switching signals are generated by employing hysteresis, PWM, SVM or SVPWM current or voltage control.
Figure 3. Instantaneous reactive power theory-based control algorithm of SHUNT APFs (Singh et al., 2015)
The basic architecture of the fault detection and localization system is shown in Figure 4. The proposed methodology for fault diagnosis is based on using ANN as a tool for detecting the exact time when the fault occurs and localize the opened switch responsible of the fault.
The neural network approach has two phases; training and testing. Before the training phase, open single switch faults were created through simulation and features were computed and saved in the input database. A second database was created named target outputs. The databases of inputs and target outputs determine the structure of the ANN model. In the training phase the ANN model is trained to learn the relationship between the inputs database and target outputs. In the test phase the ANN model is tested with a different and non-used input database. Once the networks are trained and tested, they are ready to identify and localize the open switch fault.
Figure 4. Structure of fault detection and localization system
4.1. Feature extraction
For the UPQC system, a measurement of current and voltage must be done. Current sensors are used to measure the grid current and help to identify if the Active shunt compensator is damaged or no. The load voltage is measured to identify if the Active Series compensator is damaged or no. All of the features were chosen for their potential in discriminating between the different characteristics (frequency, amplitude, …) of a signal (current or voltage) in healthy or faulty state.
A change in active filter signal waveform is defined as the instant at which a sudden increase or decrease is observed in the DC offset component of the signal. Fault detection is based on the calculation of zero harmonic components (Benslimane and Thameur, 2009).
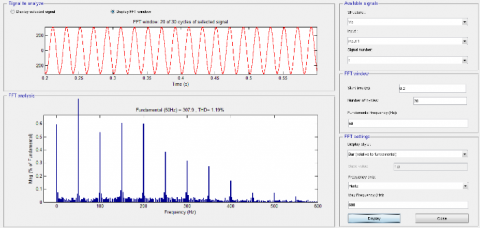
To detect the change in signal waveform, the first feature computed is the maximum value of the magnitude of the Fast Fourier Transform (FFT) on the frequency domain (Shiuly et al., 2014). The second feature computed is the skewness in the time domain, because it represents the change of form occurred on the signal (Cohen, 2016).
4.1.1. Fast fourier transform (FFT)
The Fourier transform has been widely used in different applications of signal processing because it’s determined all frequencies of the signal and allow a better understanding of this signal very fast. It gives us a frequency-domain version of the signal (transforms a time domain signal into its frequency domain). The FFT is widely used in power electronics applications (estimate the reference currents, harmonic analysis, and so on) due to its functioning in the frequency domain. The Fast Fourier Transform (FFT) is a mathematical tool which computes the discrete Fourier transform (DFT). The discrete - time Fourier transform (DFT) is defined by (Shiuly et al., 2014), (Kumar et al., 2015):
$\mathrm{X}(\mathrm{k})=\sum_{\mathrm{n}=0}^{\mathrm{N}-1} \mathrm{x}(\mathrm{n}) \cdot \mathrm{e}^{-\mathrm{j} \mathrm{n} \omega \mathrm{k}}$ (5)
With
$\omega_{\mathrm{k}}=\frac{2 \pi \mathrm{k}}{\mathrm{N}}$ frequency of the kth sinusoid.
The FFT is used to extract harmonic components, the function obtained by subtracting the DC and fundamental components from a non-sinusoidal periodic function. The magnitude and order of Fourier transform describes the signal (Singh et al., 2015). The equation of the magnitude It is given by the following expression:
Magnitude $[\mathrm{FFT}(\mathrm{X})]=\sqrt{\left.\left(\text { real }[\mathrm{FFT}(\mathrm{X})]^{2}+\text { imag[FFT }(\mathrm{X})\right]^{2}\right)}$ (6)
4.1.2. Skewness
The skewness is a statistical tool used in time domain; it’s the third standardized moment. The skewness measures the asymmetry of the data around the mean value. Skewness checks the distributions with respect to a Gaussian one. The values of Skewness negative or positive indicate the data that are skewed left or right respectively. In the time domain analysis, the feature will be selected from skewness, defined as follows (Cohen, 2016), (Li and Wang, 2016):
Skewness: $\frac{\sum_{i=1}^{N}\left(x_{i}-E_{x}\right)^{3}}{(N-1) \vartheta_{x}^{3}}$ (7)
With
Energy: $\quad \mathrm{E}_{\mathrm{x}}=\sum_{\mathrm{i}=1}^{\mathrm{N}} \mathrm{x}_{\mathrm{i}}^{2}$ (8)
Where xi are data samples in a data set, i=1, 2, 3, …, N; and N is he size of the data set; $\mathrm{E}_{\mathrm{x}}$ and $\vartheta_{\mathrm{x}}$ are the mean and the standard deviation of the data set respectively.
4.1.3. Artificial neural network model
An Artificial neural network (ANN) is formed by mathematical model to simulate human brain process. It’s used in various fields, including pattern recognition, identification, classification, and control systems. The first step makes the best ANN model is to choose the Network Structure. This includes the selection of the features, the input, hidden and output layers and type of the transfer function used. The parameters of the ANN network (weights and biases) are determined based on a comparison of the output and the target, many such input/target pairs are needed to train a network until the network output matches the target (Devaraj et al., 2005), (Nahak et al., 2017).
The multilayer perceptron neural network (MLP) is the most famous and used one, due to its powerful characteristics such as generalization, parallelism, and ease of use. A MLP is constituted generally three layers: an input layer, hidden layer and output layer. There are many different types and architectures of neural networks varying according to the training algorithm. The back-propagation learning algorithm which propagates the error from the output layer to the hidden layer to update the weight matrix is most commonly used for feed forward neural networks. The most frequently used training algorithm to resolve identification problem is the back-propagation algorithm based on the Levenberg–Marquardt (LM) algorithm (Qasim and Khadkikar, 2014; Nahak et al., 2017).
To diagnose the inverter condition, the specific time and frequency domain features, skewness and maximum of the magnitude (FFT), are extracted.
Table 1. Characteristics of the proposed ANN model
|
Number of inputs nodes |
12 |
3 nodes for FFT of SAPF 3 nodes max (magnitude (FFT(ASAPF)) 3 nodes for FFT of SERIES APF 3 nodes max (magnitude (FFT(ASERIES APF)) |
|
Number of outputs nodes |
5 |
Target output = [X X X X X]; X= 0 or 1. |
|
Number of Hidden layers |
2 |
|
|
Number of Hidden nodes |
Layer1: 7 Layer2: 4 |
|
Table 2 presents the details of the best structure of the ANN model found for an automatic detection and localization of open switch fault occurred in UPQC system. The training data are applied with the corresponding Input/output data. The neural network model was trained using the back-propagation algorithm based on the Levenberg–Marquardt (LM) training algorithm. At the end of the training process, the model obtained consists of the optimal weight and the bias vector. The minimum performance gradient was set to 1.00 e−8 and training will stop when any one of these conditions are met:
1) the maximum number of epochs = 10000;
2) the mean square error = 0.001;
3) the performance gradient <= 1.00 e−8.
Table 2. The target output for healthy and faulty case
|
1: for healthy state 0: for fault state |
0: for SHUNT APF 1: for SERIES APF |
0 0 1: T1 0 1 0: T3 0 1 1: T5 1 0 1: T2 1 1 0: T4 1 1 1: T6 |
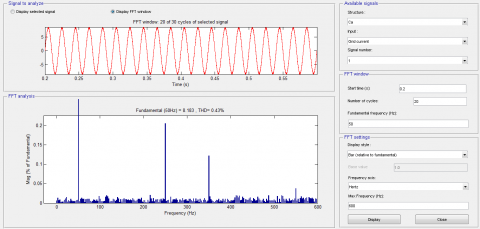
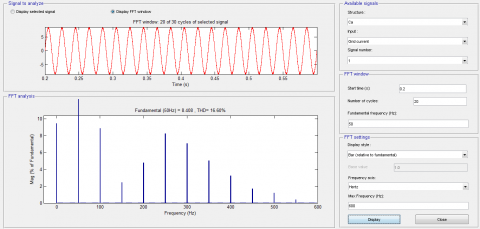
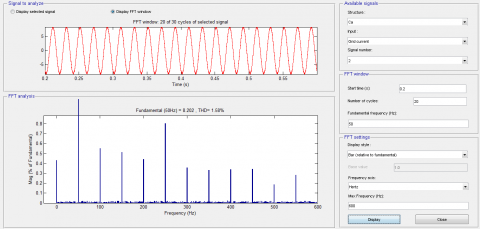
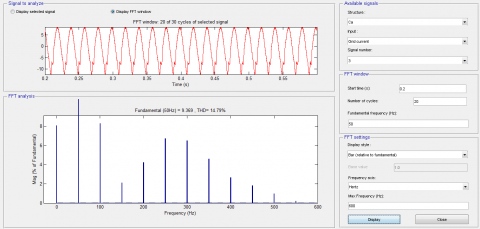
The different waveforms of the load current for the phases (A, B, and C) after applying the open switch fault on T1, for the SHUNT APF are illustrated on figure 5b, 5c and 5d respectively. The corresponding magnitude is computed using the FFT and is shown in the same figures.
(a) FFT of current Phase (A) healthy state
(b) FFT of current Phase (A) open switch fault state in T1
(c) FFT of current Phase (B) open switch fault state in T1
(d) FFT of current Phase (C) open switch fault state in T1
Figure 5. Currents waveforms and FFT analysis: (a) phases A for healthy state, (b, c, d) phases (A, B, and C) for faulty open-circuit T1
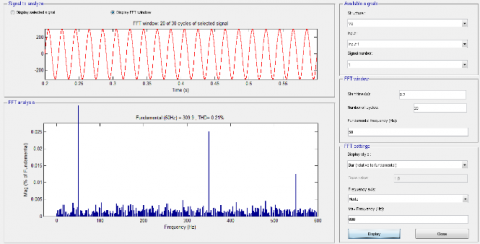
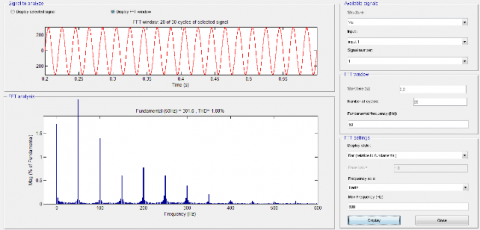
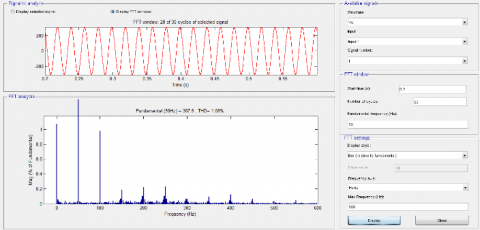
The voltages of the phases (A, B, and C) are measured and the FFT are computed the results are illustrated on the figures 6b, 6c and 6d.
(a) FFT of voltage Phase (A) healthy state
(b) FFT of voltage Phase (A) open switch fault state in T1
(c) FFT of voltage Phase (B) open switch fault state in T1
(d) FFT of voltage Phase (C) open switch fault state in T1
Figure 6. Voltages waveforms and FFT analysis of phases: (a) phases A for healthy state, (b, c, d) phases (A, B, and C) for faulty open-circuit T1
5.1. Evaluation of performance
In order to evaluate the performance of the classifier, the data collected were randomly divided into training and testing sets. Each dateset is divided in two types were: one is normal state (without a fault) and the other a faulty signal with an open switch fault. The performance of the ANN classifier can be determined by the computation of sensitivity, specificity and total classification accuracy (Sujatha BG et Anitha GS. 2016). The calculated statistical measures are shown in Table 3.
• Sensitivity: number of true positive decisions divided by the number of actual positive cases;
Sensitivity $=\frac{\mathrm{TP}}{\mathrm{TP}+\mathrm{FN}} \times 100$
• Specificity: number of true negative decisions divided by the number of actual negative cases;
Specificity $=\frac{\mathrm{TN}}{\mathrm{TN}+\mathrm{FP}} \times 100$
• Classification accuracy: number of correct decisions divided by the total number of cases.
Accuracy $=\frac{\mathrm{TN}+\mathrm{TP}}{\mathrm{TN}+\mathrm{TP}+\mathrm{FN}+\mathrm{FP}} \times 100$
Table 3. The values of the statistical parameters of the classifier ANN
|
|
|
Statistical parameters (%) |
||
|
State |
Desired result X= 0 or 1 |
Sensitivity |
Specificity |
Accuracy |
|
Healthy SHUNT APF or SERIES APF |
1 X 0 0 1: T1 1 X 0 1 0: T3 1 X 0 1 1: T5 1 X 1 0 1: T2 1 X 1 1 0: T4 1 X 1 1 1: T6 |
96.98 |
97.13 |
97.35 |
|
Faulty SHUNT APF |
0 0 0 0 1: T1 0 0 0 1 0: T3 0 0 0 1 1: T5 0 0 1 0 1: T2 0 0 1 1 0: T4 0 0 1 1 1: T6 |
96.20 |
97.01 |
97.6 |
|
Faulty SERIES APF |
0 1 0 0 1: T1 0 1 0 1 0: T3 0 1 0 1 1: T5 0 1 1 0 1: T2 0 1 1 1 0: T4 0 1 1 1 1: T6 |
97.36 |
98.95 |
97.4 |
The UPQC system is a complex system due to its complex architecture consisting of two independent inverters. The detection and localization of an open circuit faults becomes very difficult with conventional methods. The purpose of the research was to investigate the accuracy of an automatic diagnosis system, trained on the extracted features for detecting and localizing the fault. The ANN classifier showed a great performance to detect and localize an open switch fault on an UPQC system. Advantages of the proposed scheme its simplicity, modeling, and implementation. Finally, the diagnosis system based on the ANN classifier allow realizing a preventive maintenance and ensuring the safety of the material and the person by localizing the defective transistor and thus to allow its replacement or an alternative arm can be envisaged.
Ali R., Sung H. K. (2016). Fault detection and diagnosis system for a three-phase inverter using a DWT-based artificial neural network. International Journal of Fuzzy Logic and Intelligent Systems, Vol. 16, No. 4, pp. 238-245. http://dx.doi.org/10.5391/IJFIS.2016.16.4.238
Anjali-Devi A. S. N., Madhavi G. (2016). Unified power quality conditioner in distribution system for enhancing power quality. International Journal of Electrical Engineering & Technology, Vol. 7, No. 6, pp. 55–63. http://www.iaeme.com/IJEET/issues.asp? JType=IJEET&VType=7&IType=6
Aredes M., Monteiro L. F. C., Mourente J. (2003). Control strategies for series and shunt active filters. Conference: Power Tech Conference Proceedings. 2003 IEEE Bologna, Vol. 2, No. 6. http://dx.doi.org/10.1109/PTC.2003.1304675
Benachaiba C., Abdelkhalek1 O., Dib S., Allali M., Dib D. (2010). The Unified Power Quality Conditioner (UPQC): The principle, control and application. Quatrième Conférence Internationale sur le Génie Electrique CIGE’10, Vol. 2, pp. 91-94. http://dx.doi.org/10.1109/PCC.2002.998518
Benslimane T., Thameur A. (2009). Open switch faults detection and localization algorithm for three phase shunt active power filter based on two level voltage source inverter in main power supply constant and variable frequency conditions. Istanbul University, Journal of Electrical & Electronics Engineering, Vol. 9, No. 1, pp. 841-851. http://dlibrary.univ-boumerdes.dz:8080/jspui/handle/123456789/499
Cohen Z. (2016). Automatic sleep stage classification using a neural network algorithm. School of Engineering & Applied Science, Washington University in St. Louis. https://www.ese.wustl.edu/~nehorai/ugr/Report_UGR_Zoe_Cohen_2016.pdf
Devaraj D., Durairaj S., Karthi S., Vaitheeswaran. (2005). Artificial neural network model for efficiency optimization of variable speed induction motor. Conference: Proceedings of the 4th WSEAS International Conference on Applications of Electrical Engineering, pp. 334-339. http://doi.org/10.1149/1.3294708
https://www.researchgate.net/profile/Dianguo_Xu/publication/3945440_Unified_power_quality_conditioner_UPQC_the_principle_control_and_application/links/0deec52ed4400270c7000000/Unified-power-quality-conditioner-UPQC-the-principle-control-and-application. pdf?origin=publication_detail
Kastha D., Bose B. K. (1994). Investigation of fault modes of voltage-fed inverter system for induction motor drive. IEEE Transactions on Industry Applications, Vol. 30, No. 4, pp. 1028-1038. http://dx.doi.org/10.1109/28.297920
Li D. Z., Wang W. (2016). An intelligent monitor for electric motor fault diagnosis. International Journal of Mechanical & Mechatronics Engineering IJMME-IJENS, Vol. 16, No. 5, pp. 8-13. http://ijens.org/Vol_16_I_05/164405-9797-IJMME-IJENS.pdf
Nahak M. P., Triveni M. K., Panua R. (2017). Numerical investigation of mixed convection in a lid-driven triangular cavity with a circular cylinder using ANN modeling. International Journal of Heat and Technology, Vol. 35, No. 4, pp. 903-918. https://doi.org/10.18280/ijht.350427
Qasim M., Khadkikar V. (2014). Application of artificial neural networks for shunt active power filter control. IEEE Transactions on Industrial Informatics, Vol. 10, No. 3, pp. 1765-1774. https://doi.org/10.1109/TII.2014.2322580
Sadhu P. K., Pal P., Pal N., Sanyal S. (2015). Selection of power semiconductor switches in M.H.B.R.I. fitted induction heater for less harmonic injection in power line. International Journal of Power Electronics and Drive System, Vol. 6, No. 1, pp. 121-128. https://www.researchgate.net/publication/283526593_Selection_of_power_semiconductor_switches_in_MHBRI_fitted_induction_heater_for_less_harmonic_injection_in_power_line
Sandhya K., Jayalaxmi A., Soni M. P. (2013). Design of Unified Power Quality Conditioner (UPQC) for power quality improvement in distribution system. IOSR Journal of Electrical and Electronics Engineering, Vol. 4, No. 2, pp. 52-57. http://dx.doi.org/10.9790/1676-0425257
Shiuly M. (2014). Power system harmonic compensation using shunt active power filter. Journal of Engineering Research and Application, Vol. 4, No. 7, pp. 60-63. https://pdfs.semanticscholar.org/b297/ 975ae0006a8a04d54ddf87587858d41c0669.pdf
Singh B., Chandra A., Haddad K. A. (2015). Power quality problems and mitigation technique. Hoboken, NJ, USA: Wiley Publishers. http://dx.doi.org/10.1002/ 9781118922064
Sujatha B. G., Anitha G. S. (2016). Enhancement of PQ in grid connected PV system using hybrid technique. Ain Shams Eng J. http://dx.doi.org/10.1016/j.asej.2016.04.007
Thybo C. (2001). Fault-tolerant control of induction motor drive applications. Proceedings of the American Control Conference, Vol. 4, pp. 2621- 2622. http://dx.doi.org/10.1109/ACC. 2001.946266
Ubale M. R., Dhumale R. B., Lokhande S. D. (2013). Open switch fault diagnosis in three phase inverter using diagnostic variable method. International Journal of Research in Engineering and Technology, Vol. 2, No. 12, pp. 636-641. https://doi.org/10.15623/ijret.2013.0212108
Xu B., Yang D., Wang X. (2008). Neural Network based fault diagnosis and reconfiguration method for multilevel inverter. Chinese Control and Decision Conference, pp. 564-568. http://doi.org/10.1109/ICElMach.2012.6350081