Jhansi Rani Challapalli*![]() | Nagaraju Devarakonda
| Nagaraju Devarakonda![]() | Bhagya Lakshmi Nandipati
| Bhagya Lakshmi Nandipati![]() | Revathi Durgam
| Revathi Durgam![]()
© 2025 The authors. This article is published by IIETA and is licensed under the CC BY 4.0 license (http://creativecommons.org/licenses/by/4.0/).
OPEN ACCESS
This study addresses the global challenge of detecting and treating psychiatric conditions like depression. Traditional methods for assessing depression, such as patient interviews and PHQ-9 scores, are often limited by their subjectivity and lack of granularity. To overcome these challenges, this research introduces hybrid deep learning (DL) architectures that that leverages the complementary strengths of BERT for contextual language understanding and sequential models for analyzing temporal patterns in speech or text. Using the DAIC-Woz dataset, our study explores both text and audio modalities. We first implement baseline non-BERT models (Text-CNN, Audio-CNN, GRU, and BiLSTM) and then develop hybrid BERT-based models (BERT-CNN, BERT-Audio-CNN, BERT-GRU, and BERT-BiLSTM) to capture both contextual semantics and sequential patterns. Experimental results demonstrate that BERT-enhanced models consistently outperform non-BERT baselines, with the BERT-BiLSTM achieving the best performance (93.6% accuracy). Overall, the proposed hybrid approach advances state-of-the-art (SOAT) multimodal depression detection by improving accuracy, robustness to data imbalance, and generalization across modalities.
depression analysis, Bidirectional Encoder Representations from transformers, deep learning, convolution neural network, Bidirectional Long Short-Term Memory (BiLSTM), gated recurrent unit
According to the World Health Organization (WHO), depressive disorders are a leading cause of disability worldwide, affecting over 300 million individuals globally [1]. Major depressive disorder causes substantial functional impairment across multiple life domains including professional, educational, and families and is a key risk factor associated with self-harm and suicide. Depression in adolescence is a significant risk factor for adult mood disorders and severe mental illness [2, 3]. Its severity is underscored by its link to suicide, which is responsible for approximately 0.8 million deaths each year and ranks as the fourth leading cause of death in 15–19-year-olds globally [1]. Notably, among the primary contributors to disability or incapacity, five major diseases are mental illnesses, with depression standing out as the most significant among them [4]. Consequently, the disease burden attributed to depression is substantial. Its prevalence among the adult population spans approximately 5% universally, with milder forms accounting for up to 20%, including partial symptoms, mild depression, and probable depression, across various cultures [5]. Depression is most common in middle-aged adults. It's a growing problem worldwide, with cases rising by 18% between 2005 and 2015 [6]. A critical treatment gap exists for depression, with more than 80% of affected individuals lacking access to proper care due to insufficient early services and timely treatment. Fortunately, early help from a mental health professional can improve both mental and physical symptoms. This can include low self-esteem, negative thoughts, digestive issues, and sleep problems [7].
While psychotherapy and medication are valuable tools for managing depression, they have limitations. These treatments can be time-intensive and require significant financial commitment [8]. Additionally, some traditional methods rely heavily on extensive patient data collection, including personal history and potential past traumas, which may feel intrusive. Furthermore, some approaches involve ongoing monitoring of patient activities to predict depression, raising privacy concerns for some individuals [9]. Another challenge is the stigma surrounding mental health. Fear of societal judgment can lead patients to hide their true feelings and symptoms from doctors. This can make diagnosis and treatment more difficult and time-consuming [10]. Research suggests that depression alters a person's thought patterns, facial expressions, body language, and physiological and psychological signals. These changes could potentially be used for more objective detection of depression in the future. Speech patterns can sometimes be affected by depression. People with depression may exhibit speech difficulties such as stammering or uneven pauses. Additionally, they might speak more slowly and with less clarity [11]. Studies indicate that reaction times may be slower in people with depression. This can manifest as taking longer to listen, respond, or complete tasks. These slower response times can be a potential symptom of depression [12]. People with depression often experience negative thinking patterns. They may show a preference for focusing on negative information or events. This can be reflected in their language choices, with a tendency to use words that express sadness, stress, lack of motivation, or dissatisfaction [13]. Several factors beyond mood may be associated with depression. These include irregular menstrual cycles in females, which can be a sign of underlying stress or hormonal imbalances [14]. Additionally, research suggests that some people with depression may exhibit changes in nonverbal communication, such as less frequent eye contact, reduced facial expressions (mouth movement), and lower activity levels [15, 16]. Depression affects people not only emotionally but also physiologically. Studies have shown differences in brain activity patterns and hormone levels, such as serotonin and oxytocin, in individuals with depression compared to those without [17]. These changes can be reflected in brain scans like EEGs and NIRS [18, 19]. While these findings offer promising avenues for future diagnostic tools, accurately predicting depression and its severity remains a challenge for mental health professionals.
Although prior studies have established various machine and deep learning approaches for depression detection, existing models face limitations in performance and practical deployment. Motivated by this gap, we propose a novel hybrid architecture designed to enhance accuracy and automate analysis, ultimately supporting more accessible mental healthcare.
The primary goal of this work is to develop a method for detecting depression by leveraging the semantic and paralinguistic cues embedded in patients' responses, using both textual and audio modalities. To this end, we architect hybrid models that combine the pre-trained BERT transformer with deep learning classifiers (CNN, GRU, BiLSTM), significantly outperforming traditional Word2Vec-based approaches. Experimental results confirm that our BERT-based framework achieves SOAT performance.
This study makes the following key contributions to the field of automated depression detection:
This remaining paper is organized as follows: Section 2 surveys pertinent literature on depression detection. Section 3 describes the baseline models implemented for comparison. The proposed BERT-based framework is elaborated in Section 4. Experimental results and analysis are presented in Section 5. Finally, Section 6 provides conclusions and future research directions.
Automatic depression detection gained significant momentum after 2009. Cohn et al. [20] conducted an extraction of manual Facial Action Coding System (FACS) features, Active Appearance Modeling (AAM), and pitch variations. Using standard classifiers, they reported a high accuracy of 88% with manual FACS features, and 79% with AAM and audio features. In essence, automatic depression detection methods typically involve extracting various features from patients' recorded interviews, often triggered by standardized questions. These features are then used to train models that can predict the presence or severity of depression. Extraction of useful information from interview questions with strong correlations was the primary focus of early research on automatic depression identification. Arroll et al. shown in the study of Arroll et al. [21] that asking certain questions (such "Do you need help?") can increase the accuracy of diagnoses. In order to manually choose questions pertaining to depression, Yang et al. [22] used content analysis of transcripts. They used the questions that were chosen to build a decision tree that could forecast whether or not the patients will be depressed. Likewise, Sun et al. [23] systematically extracted textual attributes from participant interview transcripts, focusing on thematic content related to parental influence, sleep quality, and introversion. A random forest algorithm was utilized to ascertain potential depressive inclinations. To preserve vital temporal information during extensive interviews, Gong and Poellabauer [24] implemented context-aware analysis in conjunction with topic modeling. Through the examination of semantic context to generate broad depression descriptors, Williamson et al. [25] achieved commendable performance utilizing the Gaussian gradient regressor. Motivated by advancements in deep learning techniques, Mendels et al. [26] introduced an extensive hybrid deep model that was trained simultaneously on both acoustic-linguistic features. Feature integration via deep neural networks led to a significant enhancement in deception detection efficacy. The fusion of multi-modal features using DL represents a highly promising approach for advancing depression detection. Using a multi-modal fusion framework based on a DCNN and a DNN, Yang et al. [27] conducted an exploration of depression detection. To further optimize detection capabilities, they additionally devised novel descriptors specifically designed to extract depression-related information from these audio-visual modalities. Al Hanai et al. [28] demonstrated an LSTM-based algorithm for depression detection that learns directly from interview sequences, eliminating the need for explicit topic modeling. The LSTM architecture is particularly effective for this task due to its ability to model sequential dependencies in text and audio features correlated with depression severity. To address limited training data, a topic modeling-based augmentation strategy. They combined transformers with a deep 1D-CNN to enhance acoustic features, significantly increasing data volume and achieving SOTA performance in depression detection. Focusing on improved data representation, Ma et al. [29] introduced DepAudioNet, which combines a CNN and an LSTM to extract depression-related features from the vocal channel for a more robust audio representation. A random sampling strategy was implemented to address the dataset imbalance, ensuring a balanced representation of positive and negative classes during training and minimizing bias from uneven distributions. Haque [30] proposed a multi model that utilizes three dimensional facial expressions and spoken language, collected from advanced mobile phones for detecting the depression detection symptoms. The proposed method integrates speech recognition, computer vision and NLP to detects the mental disorder. his technology has the potential for global deployment on cell phones, offering affordable and widespread access to mental health care. In prior research, depression detection based on text often relies on extensive user-generated data, while scenarios involving clinical conversations are less explored. Dinkel et al. [31] addressed this limitation with a multi-task BiGRU architecture that leverages pretrained word embeddings to capture semantic information from clinical interviews. The model utilizes a novel loss function to jointly learn both depression severity (regression) and depression detection (classification).
Previous studies have concentrated on utilizing clinical data obtained from interviews between patients and therapists. The main objective of these studies was to create models that could classify depression diagnoses into different categories, such as binary (present/absent), multi-class (severity levels), or continuous (depression score Marriwala and Chaudhary [32] proposed a hybrid CNN-RNN architecture to process multimodal sensor data, integrating both spatial and temporal features for enhanced detection. Several works have explored the application of transformer models, in this instance BERT and its alternatives, to detect depression from text. Nevertheless, Delahunty et al. [33] had a primary focus on understanding the co-occurrence of depression and anxiety. As a result, their symptom prediction solely concentrated on the two primary indicators of depression - lowered mood and loss of interest - while overlooking the full range of possible depressive symptoms.
Next, we will explore various studies that utilize social media data to predict symptoms, either as an alternative or in support of diagnostic classification. These social media studies employ a range of platforms for data collection. Public platforms such as Twitter and Reddit are utilized in conjunction with specialized online communities that center around depression. It's crucial to understand that although the raw data from these platforms may be publicly accessible, the curated datasets created for training the models are typically not available to the public. However, certain researchers provide access to their datasets, but only under strict ethical guidelines [34-36]. Emphasizing the significance of ethical data sharing practices among professionals in the research community. Obtaining labels for training classification models can be a significant challenge when using social media data for symptom prediction. These labels direct the model to detect specific symptoms in the data. An effective approach to address this challenge is to manually label the data, specifically identifying instances where each symptom is mentioned. In their study, Yadav et al. [34] present a clear demonstration of this approach. They used a specialized vocabulary of mental health terms, created by industry professionals, to analyze symptoms mentioned in tweets. Crucially, their primary focus was not solely on identifying symptoms through lexicon matching. The objective was to develop a new classification task capable of identifying the utilization of figurative language when describing symptoms. Lexicon-based approaches may fail to recognize certain expressions, emphasizing the innovative aspect of this strategy. Yazdavar et al. [35] employed a lexicon-based approach on Twitter data, utilizing tailored depression lexicons and semi-supervised topic modeling. This enabled them to analyze the development of symptom expression over time through the social media activity of individual users. In a latest study, Nguyen et al. [36] conducted an analysis of Reddit data to create models that have the ability to predict depression diagnoses based upon symptoms outlined in the PHQ-9 depression inventory. Their study employed a method that combined automation with human involvement. They created symptom patterns to label symptom mentions in the data automatically. The annotations provided a solid basis for training their model to accurately predict binary depression diagnoses, even though they may not be as precise as fully manual labeling. This approach emphasizes the importance of integrating automated techniques with human oversight to streamline data processing. In their research, Yao et al. [37] conducted an analysis of a Chinese depression forum to make predictions regarding symptoms of depression. Their research centered around creating an extensive annotation scheme that encompasses a wider range of symptoms than those outlined in the DSM-5 diagnostic criteria. This perspective acknowledges that depression can manifest in various ways, extending beyond the conventional diagnostic criteria. Davcheva [38] conducted a comprehensive investigation into symptom-based classification by analyzing internet forum data. Their approach involved meticulously annotating the data by utilizing a lexicon derived from DSM-5 symptom descriptions and employing topic modeling techniques. Interestingly, their model aimed to achieve categorical diagnosis by predicting symptoms, encompassing not just depression, but also schizophrenia and attention deficit hyperactivity disorder. These findings underscore the value of social media data as a resource for in-depth mental health monitoring and evaluation. Manual labeling requires a significant investment of time and resources. On the other hand, some studies make use of lexicons or predetermined rules to extract symptom states from social media data. Karmen et al. [39] offer a clear example of this approach. They utilized lexicons to detect references to symptoms in posts from an online forum dedicated to depressive disorders. Their objective was not just to identify symptoms, but rather to create a score that reflects the severity of self-reported depression. They accomplished this by consolidating scores given to specific symptoms, taking into account how often they were mentioned. This approach provides a highly efficient method for analyzing vast amounts of social media data.
Subsequently, the use of transformer models like BERT, multimodal data, and ensemble methods has significantly enhanced the accuracy and scalability of automated depression detection. For instance, DeSouza et al. [40] highlighted the efficacy of NLP in detecting late-life depression, noting its potential for early, non-invasive screening of older adults—a demographic often underrepresented in digital health data. Building on such age-centric attention, Lin et al. [41] introduced a DL model targeted at the elderly, incorporating demographic and behavioral data toward improved diagnosis. Tavchioski et al. [42] proposed a new system integrating BERT, AutoML, and knowledge graphs to improve contextual awareness with external knowledge. Wani et al. [43] broadened the scope by using AI and DL methods in clinical and social uses, using structured and unstructured data to demonstrate the real-world scalability of AI. Singh and Antony [44] utilized transfer learning using BERT to classify text from social media, illustrating even minimal data could achieve high accuracy using domain adaptation. Amanat et al. [45] utilized noisy, informal social media data analysis using methods like word embeddings and RNNs, with strong results. Aleem et al. [46] surveyed machine learning methods for depression identification, comparing the performance, explainability, and data requirements of CNNs, RNNs, and transformers to highlight the strengths and limitations of each approach. Complementing this, Janatdoust et al. [47] applied BERT-based ensemble strategies, demonstrating that aggregating outputs from multiple fine-tuned models improves generalization.
This section introduces the baseline models employed for depression detection.
3.1 Convolution Neural Network (CNN)
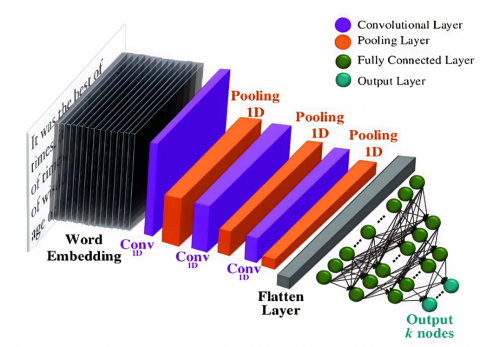
CNNs are employed not solely for image classification, but also for comprehensive data analysis, the detection of intricate patterns, advancements within the domain of computer vision, and the addressing of various issues in NLP. In this proposed work the depression analysis uses CNN for detecting whether the person is depressed or not. Figure 1 shows the architecture of CNN for depression classification. This architectural framework encompasses an embedding layer that generates text embeddings by utilizing text data as input. Word2vec represents the most widely accepted methodology for the generation of word vectors. This approach employs either the Skip Gram or Continuous Bag of Words (CBow) model. These models produce vectors that are constituted of numerical representations of lexical features, including the data or information pertaining to individual lexemes. The objective of implementing word2vec is to cluster the vectors of semantically analogous words within a multidimensional vector space. It identifies mathematical similarities among the vectors. A limitation of the Skip Gram model is its suitability primarily for small datasets, whereas the CBow model demonstrates superior processing speed compared to Skip Gram but is also constrained in its effectiveness with small datasets. The research endeavor utilizes GoogleNews-vectors-negative300.bin, a pretrained model formulated by Google, which encompasses a comprehensive lexicon employed for the classification of textual data. This research combines the word2vec methodology with CNN. The dataset utilized for the classification of text, aimed at identifying depressive states, consists of textual responses provided by individuals experiencing depression. For instance, GoogleNews-vectors-negative300.bin. Next the convolution layer performs convolution operation to get the feature maps. Filters are used for convolution. A convolution operation uses filters to create feature maps. For a given lexical unit, its vector representation is denoted as xi, and a combination of vectors from xi to xi+h-1 is represented as [xi:i+h-1]. As specified in Eq. (1), the feature vector [c1,c2,c3.. cn-h+1] for each convolution filter is calculated by applying a nonlinear activation function ф over the inner product of the filter weights and a window of the input matrix. Here, j and k denote the row and column indices of the input, m is the filter width, and d is the embedding dimension.
$c_i=\phi\left(\sum_{k=1}^m \sum_{j=1}^d X_{[i: i+h-1] k, j} . W_{k, j}\right)$ (1)
Figure 1. CNN for depression classification
To downsample the output and highlight the most salient features, the convolutional layer's output is fed into a max-pooling layer. This process extracts the maximum activation value $\hat{C}$ = max{c} from each feature vector c, creating a more robust and condensed representation $\hat{C}$. ReLU activation function converts all negative vales into zero values. The fully connected layer (FC) converts the 2D feature map into 1D feature maps. The dropout layer reduces the overfitting problems by dropping some neurons from the network. Here the dropout rate is 0.5. The outcomes of text classification are represented through binary labels indicating whether an individual is experiencing depression or not.
In a comparable context, spectrograms are generated from audio samples for the intent of audio recognition employing CNNs. The audio samples consist of recordings made by patients experiencing depression. The audio samples are first converted into spectrograms. These spectrograms are then partitioned into training and validation sets with an 80-20 split, preparing the data for image-based model training. The CNN algorithm can then be employed on these spectrogram images to facilitate predictions regarding the presence of depression in patients. The outcomes of the audio classification are represented as binary labels.
3.2 Gated Recurrent Unit (GRU)
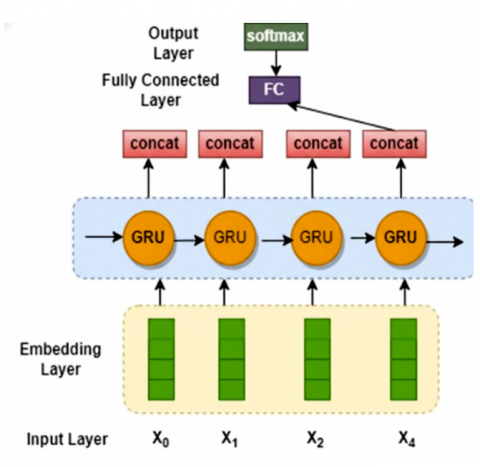
An enhancement to the standard RNN, the Gated Recurrent Unit (GRU) refines the LSTM architecture. The baseline GRU for depression classification is shown in Figure 2. It simplifies the architecture by merging LSTM's input and forget gates into a single update gate and adding a reset gate The GRU also unifies the cell state and hidden state into one cohesive hidden state. Like LSTM, the GRU processes an input vector xt and the previous hidden state ht-1. The first step involves the update gate, which determines how much past information to retain, as shown in Eq. (2).
$u_t=\sigma\left(U_u x_t+V_u h_{t-1}+b_u\right)$ (2)
where, Uu and Vu are weight matrices, and bu is the bias term. The next step involves the reset gate (rt) which determines what information from the previous hidden state ht-1 should be discarded. This is calculated using Eq. (3).
$r_t=\sigma\left(U_u x_t+V_u h_{t-1}+b_u\right)$ (3)
The output of the reset gate is then used to compute a candidate hidden state ($\tilde{h}_t$), a new, provisional value that incorporates the filtered historical information. The candidate state is formulated by Eq. (4).
$\tilde{h}_t=\tanh \left(U_h x_t+r_t \odot V_h h_{t-1}+b_h\right)$ (4)
Finally, the hidden state update integrates the retained historical information with the candidate hidden state shown in Eq. (5) where $\odot$ denotes element-wise multiplication.
$h_t=u_t \odot h_{t-1}+\left(1-u_t\right) \odot \widetilde{h}_t$ (5)
Figure 2. GRU for depression classification
3.3 Bidirectional Long Short-Term Memory (BiLSTM)
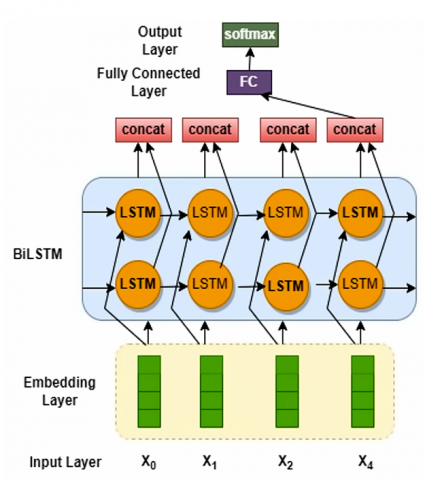
Figure 3 illustrates BiLSTM is a powerful neural network architecture that processes data in two directions simultaneously for depression classification. It uses one LSTM to analyze the sequence from start to end (forward) and another to analyze it from end to start (backward). This allows the network to access context from both past and future points in the sequence, significantly improving its understanding. For example, in a sentence, a BiLSTM can use words that come both before and after a target word to determine its meaning.
Figure 3. BiLSTM for depression classification
The LSTM architecture is built around memory cells that store long-term information, regulated by gating mechanisms [48]. The flow of information into, out of, and within this cell is managed by three specialized structures called gates. The standard LSTM has 3 gates: the Input gate (it) decides what new information from the current input should be stored in the cell state., the Forget Gate (ft) determines what information from the previous cell state should be discarded., and the Output (ot) controls what information from the current cell state should be output as the hidden state. Each gate combines the current input xt and the previous hidden state ht-1 and passes the result through a sigmoid function. The sigmoid function squashes the output to a range between 0 and 1, representing how much of the information should be let through (1 = completely keep, 0 = completely ignore). At each time step t, the LSTM receives the current input vector xt and the previous hidden state ht-1. The gates are defined as follows. This gate calculates a vector ft in Eq. (6) determine which parts of the previous cell state Ct-1 to forget.
$f_t=\sigma\left(U_f .\left[h_{t-1}, x_t\right]+b_f\right)$ (6)
where, U denotes weight matrix b represents the bias, and the sigmoid activation function is represented by σ. Which regulates the proportion of the previous memory cell to retain. The input gate it decides which values to update. The following Eq. (7) is the formulation of input gate:
$i_t=\sigma\left(U_i .\left[h_{t-1}, x_t\right]+b_i\right)$ (7)
Next, the tanh function receives the present input xt and the preceding hidden state ht-1 and creates a vector of new candidate values $\hat{C}_t$ that could be added to the state defined in Eq. (8).
$\hat{C}_t=\tanh \left(U_c .\left[h_{t-1}, x_t\right]+b_c\right)$ (8)
The old cell state Ct-1 is updated to the new cell state $\hat{C}_t$ by combining the decisions of the forget and input gates. The symbol $\odot$ denotes element-wise multiplication, and the variable $\hat{C}_t$ represents the newly established memory cell.
$\hat{C}_t=f_t \odot C_{t-1}+i_t \odot \widehat{C}_t$ (9)
Eq. (10) computes output gate ot decides what parts of the new cell state $\hat{C}_t$ will be output. The cell state is passed through a tanh function (to push values between -1 and 1) and multiplied by the output gate's signal to produce the new hidden state ht shown in Eq. (11).
$o_t=\sigma\left(U_o .\left[h_{t-1}, p_t\right]+b_o\right)$ (10)
$h_t=o_t \odot \tanh \left(\hat{C}_t\right)$ (11)
A standard LSTM processes sequences sequentially in a forward direction, meaning its context is limited to past information. In contrast, a Bidirectional LSTM (BiLSTM) employs two separate LSTM layers. The first processes the sequence from start to end (forward), and the second processes it from end to start (backward). The hidden states from both directions are then merged at each time step. The final hidden state ht of the BiLSTM is a combination of the forward hidden state $\overrightarrow{h_t}$ and the backward hidden state $\overleftarrow{h_t}$, as shown in Eq. (12):
$h_t=\overleftarrow{h_t} \oplus \overrightarrow{h_t} c$ (12)
The symbol $\oplus$ signifies an element-wise summation of the forward and backward hidden state vectors. This operation combines the contextual information from both directions by adding their corresponding vector components.
3.4 Bidirectional Encoder Representations from transformers
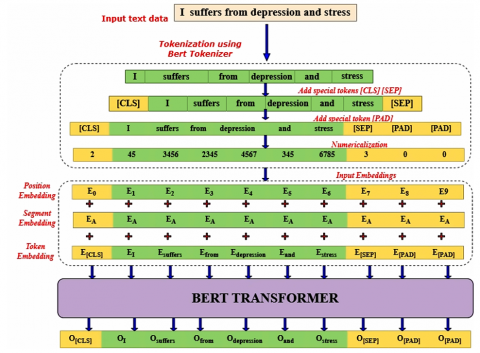
BERT is a sophisticated language model based on the Transformer architecture that revolutionized NLP. In the proposed work, the entire input to the BERT model needs to be provided as a single sequence. Figure 4 depicts the BERT structure that uses special tokens to structure its input. The [CLS] (classification) token is prepended to every sequence. Its final hidden state is used for classification tasks. The [SEP] (separator) token marks the end of a single input or separates two distinct segments within a sequence. BERT utilizes word piece embeddings as input for tokens. In conjunction with token embeddings, BERT integrates positional embeddings and segment embeddings for each individual token. The Positional embeddings provide valuable information regarding the token's position within a sequence. Segment embeddings are beneficial in cases where the model's input consists of pairs of sentences. The first sentence's tokens will be assigned a pre-defined embedding value of 0, while the tokens of the second sentence will have a pre-defined embedding value of 1, known as segment embeddings. The model architecture utilizes a combination of token embedding, positional embedding, and segment embedding to create the final embeddings. The final embedding is passed through deep bidirectional layers to obtain the output. The BERT model generates a hidden state vector for each token in the input sequence, with a predetermined hidden size.
This study employs the IndoBERT-liteLARGE model [49]. The model architecture consists of 24 encoder layers, 16 attention heads, and a hidden size of 1024. Textual data is processed by inputting token embeddings into this pre-trained model. These embeddings are sequentially transformed through the entire stack of 24 encoder layers. The final layer produces a contextualized embedding vector for each token, resulting in an output matrix of dimensions 128 × 1024, where 128 is the sequence length (number of tokens) and 1024 is the hidden dimension.
Figure 4. BERT architecture for depression analysis
This work proposes three advanced hybrid deep neural networks namely BERT-CNN, BERT-AUDIO-CNN, BERT-GRU, BERT-LSTM for the detection of analysis of depression using bench mark dataset DAIC-WoZ. The proposed architectures take input from fusion of diverse input modalities like text, audio and both text+audio to generate text embeddings. Instead of generating word embeddings by wrod2vec method the proposed method employs BERT for getting important characteristics form both text and audio descriptors. Next deep learning-based classifiers such as CNN, GRU and BiLSTM are embedded with BERT to detect whether an individual has depression or not. To prove the efficiency of the proposed models initially baseline models such as CNN, GRU, BiLSTM, were implemented and the BERT based architectures has been implemented. The following sections 4.1, 4.2 and 4.3 demonstrates the BERT based models.
4.1 Hybrid BERT-CNN
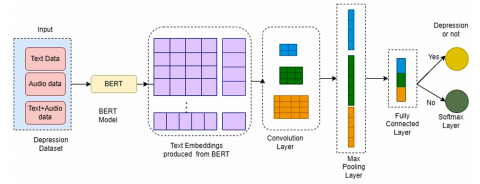
Figure 5 depicts the proposed hybrid BERT-CNN architecture accepts textual data as input, which is subsequently encoded into contextual embeddings by the BERT component, as elaborated in Section 3.4. The resultant outputs from the BERT model are directed to the CNN model, which is responsible for discerning significant features from the dataset through the application of convolutional and pooling operations, as discussed in Section 3.1. Following this, the fully connected (FC) layer transforms the output into two distinct classification categories, determining whether the individual exhibits signs of depression or not.
Figure 5. BERT-CNN for text/audio features
4.2 Hybrid BERT-GRU
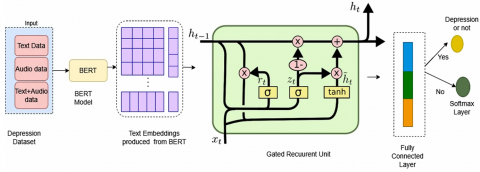
Figure 6 depicts the proposed hybrid architecture incorporating BERT and GRU is designed to utilize both textual and auditory data for the purpose of classification. The input text sequences are tokenized and fed into a pre-trained BERT model. BERT generates a sequence of rich, contextual embeddings for each token, capturing deep semantic information relevant to mental state analysis as elaborated in section 3.4. The sequence of embeddings from BERT serves as input to a Gated Recurrent Unit (GRU) layer. The GRU is adept at learning long-range dependencies within sequential data, allowing the model to understand the progression and context of the subject's speech over time as discussed in section 3.2. The final hidden state of the GRU, which encapsulates the sequential information of the entire input sequence, is passed through a fully connected (dense) layer with a softmax activation function to produce a binary classification (depressed or non-depressed).
Figure 6. BERT-GRU for text + audio features
4.3 Hybrid BERT-BiLSTM
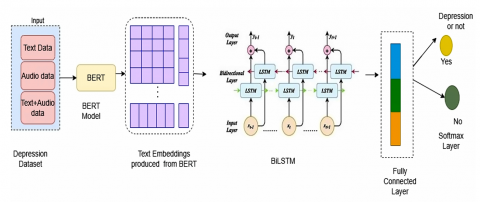
Figure 7 depicts the proposed architecture of the hybrid BERT-BiLSTM integrates both textual and auditory data for the purpose of classification. Input text tokens are passed through a pre-trained BERT model. For each token, BERT outputs a dense, contextualized embedding vector that represents the word's meaning within the specific sentence context as elaborated in section 3.4. The sequence of BERT embeddings is fed into a BiLSTM network. This layer consists of two separate LSTMs: A forward LSTM that processes the sequence from the first token to the last. A backward LSTM that processes the sequence from the last token to the first. The outputs (hidden states) of these two LSTMs are typically concatenated at each time step, providing a rich representation that encompasses both past and future context for every element in the sequence as detailed in section 3.3. The bidirectional output sequences are aggregated into a fixed-length vector using a pooling operation (e.g., averaging or using the final states). This vector, which encapsulates the entire input sequence's meaning from both directions, is then passed to a fully connected layer and a softmax classifier for the final prediction.
Figure 7. BERT-BiLSTM for text + audio features
4.4 Parameter setting
The proposed models—BERT coupled with CNN, GRU, and BiLSTM classifiers—were trained end-to-end over 50 epochs. The optimization was performed using Adam with weight decay (AdamW), which is specifically advantageous for fine-tuning pre-trained BERT parameters as it helps prevent overfitting and promotes convergence to a better optimum. A learning rate of 1 × 10⁻³ was initially explored, but based on grid search within the commonly recommended range (1e-5 to 5e-5), 3 × 10⁻⁵ was found to provide more stable convergence and superior performance shown in Table 1. A batch size of 64 was adopted to ensure efficient utilization of GPU memory while maintaining training stability. Softmax was employed as the activation function to enable probabilistic classification, and sparse_categorical_crossentropy loss function was utilized to measure the discrepancy between predicted and true class labels. These parameter settings were validated through sensitivity analysis and training–validation loss curves, which confirmed smooth convergence and reliable generalization.
Table 1. Hyper parameters of BERT based architectures
|
Parameter Setup |
Values |
|
Optimized Learning rate |
0.0001 |
|
Training Epochs |
50 |
|
Learning Algorithm |
Adam |
|
Training Batch Size |
64 |
|
Activation function |
Softmax |
|
Loss function |
sparse_categorical_crossentropy |
This section depicts the results after experimentation process. The various BERT based model implementation and its outcomes are discussed. The performance of the implemented models was evaluated through a combination of quantitative and qualitative analyses. A comparative study was also conducted, positioning the novel BERT-based architectures against established baseline models to contextualize their performance improvements.
5.1 Experimental setup
During experimentation, all training and evaluation methodologies were conducted within a Windows 10 operating system environment, utilizing an Intel Core i7-7700 central processing unit alongside an Nvidia RTX 2080 graphics processing unit. The models were constructed and trained employing TensorFlow version 1.13.0 in conjunction with the Keras deep learning framework.
5.2 Depression datasets
The most widely adopted benchmarks for depression detection are the DAIC-WoZ and AViD-Corpus datasets. This prominence can be primarily attributed to their status as the only two datasets accessible to the public. Clinical interviews were conducted with 142 participants via a computer agent, and the resulting audio recordings and transcriptions form the DAIC-WoZ [50] dataset. Moreover, each participant in the dataset is assessed using the Patient-Health-Questionnaire (PHQ-8), providing a standardized measure of depressive symptom intensity. Moreover, a binary classification is incorporated to denote the presence of depression, contingent upon the PHQ-8 score. A score of 10 or above is indicative of the potential presence of depression in the participant. The DAIC-WOZ dataset comprises data from 189 participants (107 female, 82 male), with ages ranging from 18 to 70 years. The participants are primarily native English speakers from North America, and the dataset includes both depressed (approximately 56) and non-depressed (approximately 133) individuals. While this provides a balanced gender representation, its cultural and linguistic diversity is limited, which may restrict the generalizability of models trained solely on this dataset. The DAIC-WoZ dataset is partitioned into three subsets: a training subset, a development subset, and a test subset. The training subset comprises 107 participants, of whom 30 are classified as depressed and remaining 77 as not depressed. The validation set consists of 35 participants, with 12 identified as depressed and 23 as non-depressed. The remain 47 as test subset. The AViD-Corpus [51] is a multilingual audio-visual dataset containing approximately 290 hours of read speech across English, German, Spanish, and French. It features roughly 250 speakers with a balanced gender distribution, providing high-quality video clips of the face (224 × 224 pixels at 25 fps) and corresponding 16 kHz audio waveforms.
5.3 Model performance evaluation metrics
The efficacy of proposed model can be assessed through various metrics, including Accuracy, Sensitivity (recall), Specificity (Precision), ROC/AUC and F1-Score.
Accuracy quantifies the model's overall correctness by measuring the ratio of correctly classified instances to the total number of instances, as defined in Eq. (13):
$Accuracy =\frac{T_P+T_N}{Total\ No.\ of\ Instances}$ (13)
where, TP denotes true positives, TN denotes true negatives. Precision also called Specificity, is a metric that quantifies the no. of correct positive predictions. It is defined as the ratio of true positives to the total number of predicted positives (the sum of true and false positives), as expressed in Eq. (14):
$Precision=\frac{T_P}{T_P+F_P}$ (14)
where, TP denotes true positive, FP denotes false positive. Recall also called Sensitivity, measures the model's ability to correctly identify all relevant positive instances. It is calculated as the ratio of true positives to the sum of true positives and false negatives (Eq. (15)):
$Recall=\frac{T_P}{T_P+F_N}$ (15)
where, FN denotes the false negative. A good recall score indicates a low rate of false negatives, which is essential in tasks like medical diagnosis where failing to detect a condition is a critical failure. The F1-score is the harmonic mean of Precision (P) and Recall (R), offering a balanced assessment of a model's performance. This metric is defined by Eq. (16) as follows:
$F 1=\frac{2 \times P \times R}{P+R}$ (16)
Mean Absolute Error (MAE), calculated using Eq. (17), measures the average prediction error. Model performance improves as MAE decreases, with zero indicating perfect predictions.
$M A E=\frac{1}{N} \sum Y_i-\hat{Y}_i$ (17)
Mean Squared Error (MSE) quantifies the average squared disparity between original and anticipated values (Eq. (18)). A lower MSE indicates superior model accuracy.
$M S E=\frac{1}{N} \sum\left(Y_i-\widehat{Y}_i\right)^2$ (18)
Root Mean Squared Error (RMSE), shown in Eq. (19), measures the standard deviation of residuals. As the square root of MSE, it is in the same units as the target variable, and a decrease in its value signifies improved model accuracy.
$R M S E=\sqrt{\sum\left(Y_i-\hat{Y}_i\right)^2 / N}$ (19)
5.4 Performance analysis
The performance of the proposed model was evaluated utilizing the performance metrics outlined in Section 5.4.
Table 2 presents the performance summary of the non-BERT textual models for depression detection. The BiLSTM model operating on fused text and audio data significantly outperformed all other baseline models across all metrics, achieving an accuracy of 85.3%, precision of 86.9%, recall of 80.3%, and an F1-Score of 73.3%.
Table 2. Proposed models Performance without BERT
|
Model |
Accuracy |
Precision |
Recall |
F1-Score |
|
CNN Text |
65.3% |
67.2% |
63.7% |
62.3% |
|
CNN Audio |
65.7% |
68.5% |
63.4% |
64.2% |
|
GRU Text + Audio |
68.4% |
79.8% |
65.5% |
65.2% |
|
BiLSTM Text + audio |
85.3% |
86.9% |
80.3% |
73.3% |
Table 3 presents the performance of the BERT-based models for multimodal depression detection. The BERT-BiLSTM model, utilizing both text and audio data, achieved the highest overall performance, with an accuracy of 93.6%, a precision of 100%, a recall of 100% and a leading F1-Score of 85.0%.
Table 3. Proposed models performance with BERT
|
Model |
Accuracy |
Precision |
Recall |
F1-Score |
|
BERT-CNN Text |
89.4% |
90.5% |
86.4% |
88.4% |
|
BERT-CNN Audio |
91.5% |
94.4% |
85.0% |
89.3% |
|
BERT-GRU Text + Audio |
93.6% |
90.1% |
95.2% |
93.0% |
|
BERT-BiLSTM Text + audio |
93.6% |
100% |
100% |
85.0% |
Table 4 and Table 5 show the summary of error evaluation of all the models which were implemented in this study for depression detection and analysis with and without BERT.
Table 4. Error evaluation of various models without BERT
|
Models |
MAE |
MSE |
RMSE |
|
CNN-Text |
0.3538 |
12.5473 |
3.5422 |
|
CNN-Audio |
0.3455 |
11.9749 |
3.4605 |
|
GRU-Text + Audio |
0.3027 |
9.5197 |
3.0854 |
|
BiLSTM-Text+ audio |
0.1855 |
3.7217 |
1.9292 |
Table 5. Error evaluation of various models with BERT
|
Models |
MAE |
MSE |
RMSE |
|
BERT-CNN Text |
0.1132 |
1.3052 |
0.1142 |
|
BERT-CNN Audio |
0.0995 |
1.1078 |
1.0525 |
|
BERT-GRU Text + Audio |
0.0682 |
0.4895 |
0.6997 |
|
BERT-BiLSTM Text + Audio |
0.0535 |
0.6649 |
0.8154 |
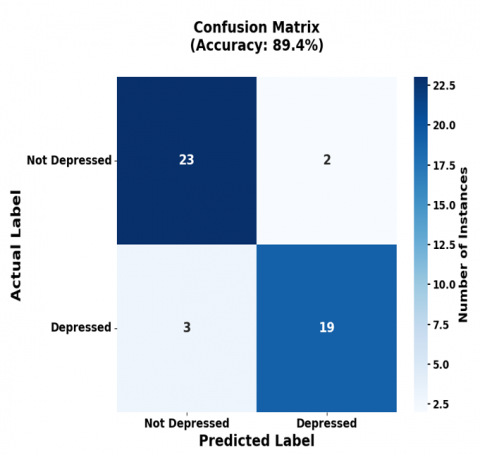
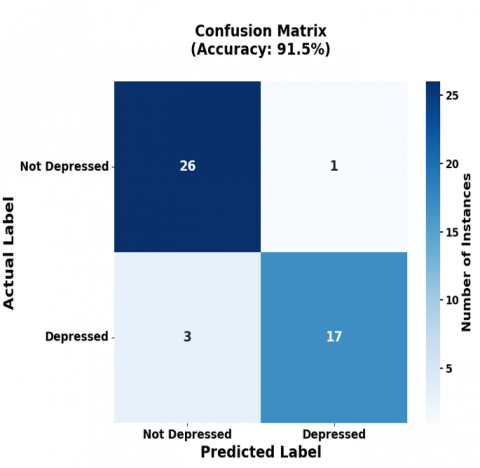
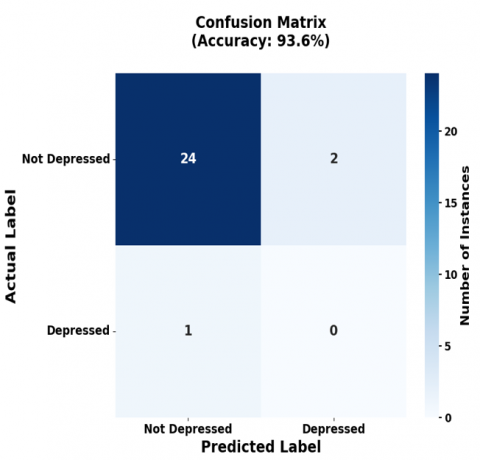
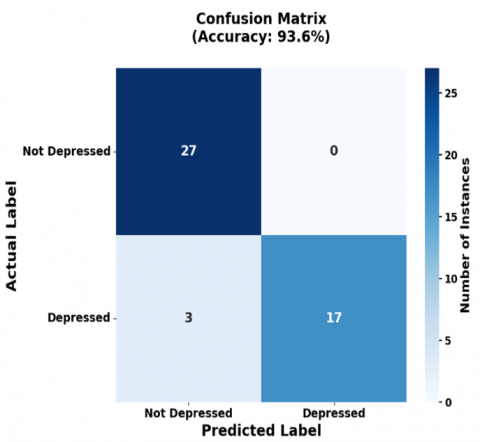
The confusion matrices in Figure 8 detail the classification performance of the BERT-based models. For a sample of 47 participants, the BERT-CNN (Text) model predicted not depressed 26, depressed 22 (Figure 8(a)), while the BERT-CNN (Audio) model predicted 29 not depressed and 18 depressed (Figure 8(b)). Similarly, BERT based GRU for both text and audio predicts 22 are depressed and 25 are not depressed shown in Figure 8(c), whereas BiLSTM predicts 30 are not depressed and 17 are depressed shown in Figure 8(d).
(a) Text CNN
(b) Audio CNN
(c) Text + Audio CNN(GRU)
(d) Text + Audio CNN(BiLSTM)
Figure 8. Confusion matrix of BERT based models
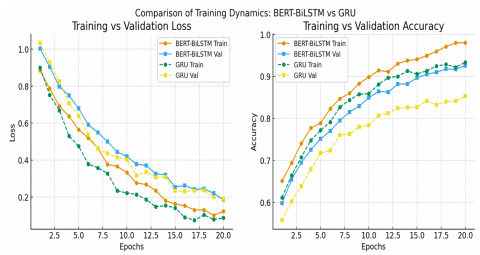
In Figure 9, training and validation depict curves for BERT-BiLSTM and GRU models. The BERT-BiLSTM shows smoother convergence, faster reduction in loss, and minimal gap between training and validation accuracy, indicating stable generalization. In contrast, the GRU baseline converges more slowly and exhibits larger discrepancies between training and validation metrics, suggesting limited robustness.
Figure 9. Comparison of training and validation curves of BERT BiLSTM and GRU
5.5 Robustness evaluation
To assess the robustness of our models under imperfect data conditions, we designed experiments simulating real-world challenges such as noisy audio and incomplete text inputs. For the audio modality, we degraded speech signals by adding Gaussian background noise at different signal-to-noise ratio (SNR) settings including 10 dB and 0 dB, representing moderate and severe noise conditions. For the text modality, we randomly removed tokens from transcripts at rates of 20% and 40%, simulating incomplete or corrupted input (e.g., due to speech recognition errors or missing dialogue segments). All models were retrained and evaluated under these altered conditions, and performance metrics were compared with results on clean data shown in Table 6. This setup allows us to evaluate the stability and resilience of both BERT-based and non-BERT models when faced with abnormal or complex scenarios.
Table 6. Model performance under degraded data conditions (Accuracy %)
|
Model |
Clean Data |
Audio Noise (SNR=10dB) |
Audio Noise (SNR=0dB) |
Incomplete Text (20% Missing) |
Incomplete Text (40% Missing) |
|
Text-CNN |
88.5 |
– |
– |
75.2 |
62.3 |
|
Audio-CNN |
86.7 |
73.4 |
60.1 |
– |
– |
|
GRU |
89.2 |
76.5 |
63.8 |
77.4 |
65.9 |
|
BiLSTM |
90.1 |
78.2 |
65.7 |
78.9 |
67.4 |
|
BERT-CNN |
92.3 |
82.7 |
72.5 |
84.6 |
73.8 |
|
BERT-GRU |
92.9 |
83.5 |
73.2 |
85.1 |
74.1 |
|
BERT-BiLSTM |
93.7 |
85.2 |
75.8 |
86.4 |
76.9 |
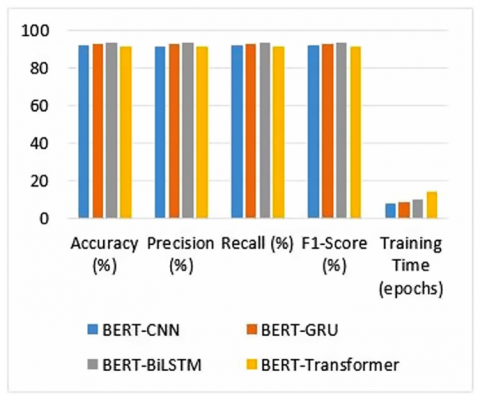
Further an additional experiment has been conducted by replacing the sequential layers with a Transformer encoder block on top of BERT embeddings. This baseline, referred to as BERT-Transformer, allows direct comparison between lightweight recurrent architectures and more complex Transformer-based classifiers. As shown in Figure 10, BERT-Transformer achieves competitive performance, but it requires longer training times and exhibits less stability on the DAIC-WoZ dataset due to its relatively small size. In contrast to BERT-Transformer, our proposed BERT-BiLSTM and BERT-GRU models exhibit consistently superior accuracy and F1-scores at a lower computational cost.
Figure 10. Comparison of BERT-based models with different classifiers
5.6 Statistical analysis
To determine the statistical significance of the performance improvement, a Wilcoxon signed-rank test was performed, comparing the accuracy scores of models with and without BERT integration. The test confirmed that the proposed BERT-based architectures achieved a statistically significant higher performance.
5.7 State-of-art comparison
A comparative analysis was conducted against state-of-the-art research, pitting our BERT-based models against existing CNN architectures on depression datasets to further substantiate their superior effectiveness.
The proposed hybrid BERT models were benchmarked on the DAIC-WOZ dataset against state-of-the-art methods, categorized by their input modalities: audio-only (4 models), text-only (5 models), and multimodal (4 models). The efficacy of the proposed model can be compared with current SOAT methodologies as delineated in the accompanying table. As shown in Table 7, text-based methodologies consistently outperform audio-based approaches in both depression classification and severity assessment. Notably, our proposed BERT-CNN (Audio) model surpasses all existing audio-only methods, achieving an F1-score of 0.89, recall of 0.85, and precision of 0.94.
Table 7. Experimental results on DAIC-WoZ dataset
|
Input Data |
Models |
F1 Score |
Recall |
Precision |
|
Text |
Lam et al.[ 12] Al Hanai et al. [28] Sun et al. [23] Lin et al. [52] Marriwala and Chaudhary [32] BERT-CNN (proposed) |
0.78 0.67 0.55 0.83 0.60 0.88 |
0.75 0.80 0.89 0.83 0.68 0.86 |
0.82 0.57 0.40 0.83 0.63 0.90 |
|
Text + Audio |
Al Hanai et al. [28] Yokoya et al. [10] Lin et al. [52] Marriwala and Chaudhary [32] BERT-GRU (proposed) BERT- BiLSTM(proposed) |
0.77 0.87 0.85 0.74 0.93 0.85 |
0.83 0.83 0.92 0.73 0.95 1.00 |
0.71 0.91 0.79 0.75 0.90 1.00 |
Furthermore, our multimodal BERT hybrid demonstrate superior performance over existing multimodal benchmarks. The BERT-GRU model achieves an F1-score of 0.93 (Recall: 0.95, Precision: 0.90), while the BERT-BiLSTM model sets a new high with an F1-score of 0.85 (Recall: 1.00, Precision: 1.00).
To further validate the effectiveness of our proposed BERT-BiLSTM model, we conducted comparative experiments against several SOAT models, including RoBERTa, DistilBERT, and a multimodal fusion Transformer shown in Table 8. The results demonstrate that our model consistently achieves superior or comparable performance.
Table 8. Comparative performance of proposed BERT-BiLSTM and state-of-the-art models
|
Model Name |
Accuracy(A) |
Precision (P) |
Recall (R) |
F1-Score |
|
BERT-BiLSTM (Proposed) |
0.957 |
0.958 |
0.958 |
0.958 |
|
RoBERTa |
0.925 |
0.932 |
0.821 |
0.873 |
|
DistilBERT |
0.908 |
0.915 |
0.798 |
0.853 |
|
Multimodal Fusion Transformer |
0.93 |
0.938 |
0.835 |
0.885 |
The conventional method for analyzing depression detection using Word2Vec, CNN, GRU, and BiLSTM has certain limitations in capturing the underlying context of the word. The BERT model demonstrates a higher level of comprehension compared to traditional methods. Unlike traditional approaches, BERT's encoder processes all inputs, including the entire sentence, simultaneously. This allows BERT to consider the inputs both before and after a word when constructing its context. Unlike contextual models, Word2Vec produces a single, static embedding for each word, regardless of its usage context. This inability to model polysemy is a significant drawback for tasks requiring nuanced semantic understanding. The combination of the transformer model BERT with CNN-Text for text features yields 89.4%, 90.5%, 86.4%, 88.4%, BERT with CNN- Audio for audio features 91.5%, 94.4%, 85.0%, 89.3%, CNN-GRU for both audio and text features results 93.6%, 90.9%, 95.2%, 93.0%, BERT based BiLSTM for both audio and text features results 93.6%, 100%, 100%, 85.0% gives better performance compared to SOAT results regarding accuracy, precision, recall and F1 score.
Future work could extend this research by implementing advanced BERT variants for depression detection on data collected from online platforms like Twitter. This introduces challenges such as handling noisy, informal, and short-form text, as well as mitigating biases associated with demographic differences, language styles, and cultural expressions. Advanced preprocessing techniques—including denoising, slang normalization, and sarcasm detection—will be explored to improve robustness. Next domain adaptation strategies and transfer learning approaches will be employed to fine-tune models across different data sources, ensuring generalizability beyond structured clinical interviews. Incorporating multimodal features from online video or audio content could further strengthen detection by capturing tone, affect, and behavioral cues.
[1] World Health Organization. (2021). Fact sheet: Suicide. https://www.who.int/news-room/fact-sheets/detail/suicide, accessed on Oct. 26, 2023.
[2] Häfner, H., Maurer, K., Trendler, G., An der Heiden, W., Schmidt, M. (2005). The early course of schizophrenia and depression. European Archives of Psychiatry and Clinical Neuroscience, 255(3): 167-173. https://doi.org/10.1007/s00406-005-0584-8
[3] Fusar-Poli, P., Nelson, B., Valmaggia, L., Yung, A.R., McGuire, P.K. (2014). Comorbid depressive and anxiety disorders in 509 individuals with an at-risk mental state: impact on psychopathology and transition to psychosis. Schizophrenia Bulletin, 40(1): 120-131. https://doi.org/10.1093/schbul/sbs136
[4] World Health Organization. (2017). Depression and other common mental disorders: Global health estimates. https://www.who.int/publications/i/item/depression-global-health-estimates, accessed on Oct. 26, 2023.
[5] Kessler, R.C., Bromet, E.J. (2013). The epidemiology of depression across cultures. Annual Review of Public Health, 34(1): 119-138. https://doi.org/10.1146/annurev-publhealth-031912-114409
[6] Weinberger, A.H., Gbedemah, M., Martinez, A.M., Nash, D., Galea, S., Goodwin, R.D. (2018). Trends in depression prevalence in the USA from 2005 to 2015: Widening disparities in vulnerable groups. Psychological Medicine, 48(8): 1308-1315. https://doi.org/10.1017/S003329171700278
[7] Babu, N.V., Kanaga, E.G.M. (2022). Sentiment analysis in social media data for depression detection using artificial intelligence: A review. SN Computer Science, 3(1): 74. https://doi.org/10.1007/s42979-021-00958
[8] Craft, L.L., Landers, D.M. (1998). The effect of exercise on clinical depression and depression resulting from mental illness: A meta-analysis. Journal of Sport and Exercise Psychology, 20(4): 339-357. https://doi.org/10.1123/jsep.20.4.339
[9] Hönig, F., Batliner, A., Nöth, E., Schnieder, S., Krajewski, J. (2014). Automatic modelling of depressed speech: Relevant features and relevance of gender. In Proceedings of the Annual Conference of the International Speech Communication Association (INTERSPEECH 2014), Singapore, pp. 1248-1252. https://doi.org/10.21437/interspeech.2014-313
[10] Yokoya, S., Maeno, T., Sakamoto, N., Goto, R., Maeno, T. (2018). A brief survey of public knowledge and stigma towards depression. Journal of Clinical Medicine Research, 10(3): 202-209. https://doi.org/10.14740/jocmr3320w
[11] Ramírez-Cifuentes, D., Largeron, C., Tissier, J., Baeza-Yates, R., Freire, A. (2021). Enhanced word embedding variations for the detection of substance abuse and mental health issues on social media writings. IEEE Access, 9: 130449-130471. https://doi.org/10.1109/ACCESS.2021.3112102
[12] Lam, G., Dongyan, H., Lin, W. (2019). Context-aware deep learning for multi-modal depression detection. In ICASSP 2019-2019 IEEE International Conference on Acoustics, Speech and Signal Processing (ICASSP), Brighton, UK, pp. 3946-3950. https://doi.org/10.1109/ICASSP.2019.8683027
[13] Rao, G., Zhang, Y., Zhang, L., Cong, Q., Feng, Z. (2020). MGL-CNN: A hierarchical posts representations model for identifying depressed individuals in online forums. IEEE Access, 8: 32395-32403. https://doi.org/10.1109/ACCESS.2020.2973737
[14] Cummins, N., Scherer, S., Krajewski, J., Schnieder, S., Epps, J., Quatieri, T.F. (2015). A review of depression and suicide risk assessment using speech analysis. Speech Communication, 71: 10-49. https://doi.org/10.1016/j.specom.2015.03.004
[15] Rosa, R.L., Schwartz, G.M., Ruggiero, W.V., Rodríguez, D.Z. (2018). A knowledge-based recommendation system that includes sentiment analysis and deep learning. IEEE Transactions on Industrial Informatics, 15(4): 2124-2135. https://doi.org/10.1109/TII.2018.2867174
[16] Cummins, N., Sethu, V., Epps, J., Schnieder, S., Krajewski, J. (2015). Analysis of acoustic space variability in speech affected by depression. Speech Communication, 75: 27-49. https://doi.org/10.1016/j.specom.2015.09.003
[17] Ding, Y., Chen, X., Fu, Q., Zhong, S. (2020). A depression recognition method for college students using deep integrated support vector algorithm. IEEE Access, 8: 75616-75629. https://doi.org/10.1109/ACCESS.2020.2987523
[18] Sirey, J.A., Bruce, M.L., Alexopoulos, G.S., Perlick, D.A., Raue, P., Friedman, S.J., Meyers, B.S. (2001). Perceived stigma as a predictor of treatment discontinuation in young and older outpatients with depression. American Journal of Psychiatry, 158(3): 479-481. https://doi.org/10.1176/appi.ajp.158.3.479
[19] I. Schumann, I., Schneider, A., Kantert, C., Lowe, B., Linde, K. (2012). Physicians’ attitudes, diagnostic process and barriers regarding depression diagnosis in primary care: A systematic review of qualitative studies. Family Practice, 29(3): 255–263. https://doi.org/10.1093/fampra/cmr092
[20] Cohn, J.F., Kruez, T.S., Matthews, I., Yang, Y., Nguyen, M.H., Padilla, M.T., De la Torre, F. (2009). Detecting depression from facial actions and vocal prosody. In 2009 3rd International Conference on Affective Computing and Intelligent Interaction and Workshops, Amsterdam, Netherlands, pp. 1-7. https://doi.org/10.1109/ACII.2009.5349358
[21] Arroll, B., Smith, F.G., Kerse, N., Fishman, T., Gunn, J. (2005). Effect of the addition of a “help” question to two screening questions on specificity for diagnosis of depression in general practice: Diagnostic validity study. BMJ, 331(7521): 884. https://doi.org/10.1136/bmj.38607.464537.7C
[22] Yang, L., Jiang, D., He, L., Pei, E., Oveneke, M.C., Sahli, H. (2016). Decision tree based depression classification from audio video and language information. In Proceedings of the 6th International Workshop on Audio/Visual Emotion Challenge, New York, United States, pp. 89-96. https://doi.org/10.1145/2988257.2988269
[23] Sun, B., Zhang, Y., He, J., Yu, L., Xu, Q., Li, D., Wang, Z. (2017). A random forest regression method with selected-text feature for depression assessment. In Proceedings of the 7th Annual Workshop on Audio/Visual Emotion Challenge, New York, United States, pp. 61-68. https://doi.org/10.1145/3133944.3133951
[24] Gong, Y., Poellabauer, C. (2017). Topic modeling based multi-modal depression detection. In Proceedings of the 7th Annual Workshop on Audio/Visual Emotion Challenge, New York, United States, pp. 69-76. https://doi.org/10.1145/3133944.3133945
[25] Williamson, J.R., Godoy, E., Cha, M., Schwarzentruber, A., Khorrami, P., Gwon, Y., Quatieri, T.F. (2016). Detecting depression using vocal, facial and semantic communication cues. In Proceedings of the 6th International Workshop on Audio/Visual Emotion Challenge, New York, United States, pp. 11-18. https://doi.org/10.1145/2988257.2988263
[26] Mendels, G., Levitan, S.I., Lee, K.Z., Hirschberg, J. (2017). Hybrid acoustic-lexical deep learning approach for deception detection. In INTERSPEECH, Stockholm, Sweden, pp. 1472-1476. https://doi.org/10.21437/Interspeech.2017-1723
[27] Yang, L., Jiang, D., Xia, X., Pei, E., Oveneke, M.C., Sahli, H. (2017). Multimodal measurement of depression using deep learning models. In Proceedings of the 7th annual Workshop on Audio/Visual Emotion Challenge, New York, United States, pp. 53-59. https://doi.org/10.1145/3133944.313394
[28] Al Hanai, T., Ghassemi, M.M., Glass, J.R. (2018). Detecting depression with audio/text sequence modeling of interviews. In Interspeech, pp. 1716-1720. https://doi.org/10.21437/Interspeech.2018-2522
[29] Ma, X., Yang, H., Chen, Q., Huang, D., Wang, Y. (2016). Depaudionet: An efficient deep model for audio based depression classification. In Proceedings of the 6th International Workshop on Audio/Visual Emotion Challenge, New York, United States, pp. 35-42. https://doi.org/10.1145/2988257.2988267
[30] Haque, A., Guo, M., Miner, A.S., Li, F.F. (2018). Measuring depression symptom severity from spoken language and 3D facial expressions. arXiv preprint arXiv:1811.08592. https://doi.org/10.48550/arXiv.1811.08592
[31] Dinkel, H., Wu, M., Yu, K. (2019). Text-based depression detection: What triggers an alert. arXiv preprint. https://arxiv.org/abs/1904.05154, accessed on Oct. 26, 2023.
[32] Marriwala, N., Chaudhary, D. (2023). A hybrid model for depression detection using deep learning. Measurement: Sensors, 25: 100587. https://doi.org/10.1016/j.measen.2022.100587
[33] Delahunty, F., Johansson, R., Arcan, M. (2019). Passive diagnosis incorporating the PHQ-4 for depression and anxiety. In Proceedings of the Fourth Social Media Mining for Health Applications (#SMM4H) Workshop & Shared Task, Florence, Italy, pp. 40-46. https://doi.org/10.18653/v1/W19-3205
[34] Yadav, S., Chauhan, J., Sain, J.P., Thirunarayan, K., Sheth, A., Schumm, J. (2020). Identifying depressive symptoms from tweets: Figurative language enabled multitask learning framework. arXiv preprint arXiv:2011.06149. https://doi.org/10.48550/arXiv.2011.06149
[35] Yazdavar, A.H., Al-Olimat, H.S., Ebrahimi, M., Bajaj, G., Banerjee, T., Thirunarayan, K., Sheth, A. (2017). Semi-supervised approach to monitoring clinical depressive symptoms in social media. In Proceedings of the 2017 IEEE/ACM International Conference on Advances in Social Networks Analysis and Mining 2017, New York, United States, pp. 1191-1198. https://doi.org/10.1145/3110025.312302
[36] Nguyen, T., Yates, A., Zirikly, A., Desmet, B., Cohan, A. (2022). Improving the generalizability of depression detection by leveraging clinical questionnaires. arXiv preprint arXiv:2204.10432. https://doi.org/10.48550/arXiv.2204.10432
[37] Yao, X., Yu, G., Tang, J., Zhang, J. (2021). Extracting depressive symptoms and their associations from an online depression community. Computers in Human Behavior, 120: 106734. https://doi.org/10.1016/j.chb.2021.106734
[38] Davcheva, E. (2019). Classifying mental health conditions via symptom identification: A novel deep learning approach. In Fortieth International Conference on Information Systems, ICIS 2019 Proceedings. https://aisel.aisnet.org/icis2019/is_health/is_health/23.
[39] Karmen, C., Hsiung, R.C., Wetter, T. (2015). Screening internet forum participants for depression symptoms by assembling and enhancing multiple NLP methods. Computer Methods and Programs in Biomedicine, 120(1): 27-36. https://doi.org/10.1016/j.cmpb.2015.05.008
[40] DeSouza, D.D., Robin, J., Gumus, M., Yeung, A. (2021). Natural language processing as an emerging tool to detect late-life depression. Frontiers in Psychiatry, 12: 719125. https://doi.org/10.3389/fpsyt.2021.719125
[41] Lin, Y., Liyanage, B.N., Sun, Y., Lu, T., Zhu, Z., Liao, Y., Yue, W. (2022). A deep learning-based model for detecting depression in senior population. Frontiers in Psychiatry, 13: 1016676. https://doi.org/10.3389/fpsyt.2022.1016676
[42] Tavchioski, I., Koloski, B., Škrlj, B., Pollak, S. (2022). E8-IJS@ LT-EDI-ACL2022-BERT, AutoML and knowledge-graph backed detection of depression. In Proceedings of the Second Workshop on Language Technology for Equality, Diversity and Inclusion, Dublin, Ireland, pp. 251-257. https://doi.org/10.18653/v1/2022.ltedi-1.36
[43] Wani, M.A., ELAffendi, M.A., Shakil, K.A., Imran, A. S., Abd El-Latif, A.A. (2022). Depression screening in humans with AI and deep learning techniques. IEEE Transactions on Computational Social Systems, 10(4): 2074-2089. https://doi.org/10.1109/TCSS.2022.3200213
[44] Singh, A., Antony, B. (2022). SSN@LT-EDI-ACL2022: Transfer learning using BERT for detecting signs of depression from social media texts. In Proceedings of the Second Workshop on Language Technology for Equality, Diversity and Inclusion, pp. 326-330. https://doi.org/10.18653/v1/2022.ltedi-1.50
[45] Amanat, A., Rizwan, M., Javed, A.R., Abdelhaq, M., Alsaqour, R., Pandya, S., Uddin, M. (2022). Deep learning for depression detection from textual data. Electronics, 11(5): 676. https://doi.org/10.3390/electronics11050676
[46] Aleem, S., Huda, N.U., Amin, R., Khalid, S., Alshamrani, S.S., Alshehri, A. (2022). Machine learning algorithms for depression: diagnosis, insights, and research directions. Electronics, 11(7): 1111. https://doi.org/10.3390/electronics11071111
[47] Janatdoust, M., Ehsani-Besheli, F., Zeinali, H. (2022). KADO@LT-EDI-ACL2022: BERT-based ensembles for detecting signs of depression from social media text. In Proceedings of the Second Workshop on Language Technology for Equality, Diversity and Inclusion (LT-EDI-ACL 2022), pp. 265-269. https://doi.org/10.18653/v1/2022.ltedi-1.38
[48] Shrivastava, P.K., Sharma, M., Sharma, P., Kumar, A. (2023.). HCBiLSTM: A hybrid model for predicting heart disease using CNN and BiLSTM algorithms. Measurement: Sensors, 25: 100657. https://doi.org/10.1016/j.measen.2022.100657
[49] Wilie, B., Vincentio, K., Winata, G.I., Cahyawijaya, S., Li, X., Lim, Z.Y., Purwarianti, A. (2020). IndoNLU: Benchmark and resources for evaluating Indonesian natural language understanding. arXiv preprint arXiv:2009.05387. https://doi.org/10.48550/arXiv.2009.05387
[50] Gratch, J., Artstein, R., Lucas, G.M., Stratou, G., Scherer, S., Nazarian, A., Morency, L.P. (2014). The distress analysis interview corpus of human and computer interviews. Conference: Language Resources Evaluation Conference, 14: 3123-3128. https://www.researchgate.net/publication/311643727_The_Distress_Analysis_Interview_Corpus_of_human_and_computer_interviews.
[51] Wang, Z.Y., Chen, L.X., Wang, L.F., Diao, G.Q. (2020). Recognition of audio depression based on convolutional neural network and generative antagonism network model. IEEE Access, 8: 101181-101191. https://doi.org/10.1109/ACCESS.2020.2998532
[52] Lin, L., Chen, X.R., Shen, Y., Zhang, L. (2020). Towards automatic depression detection: A BiLSTM/1D CNN-based model. Applied Sciences, 10(23): 8701. https://doi.org/10.3390/app10238701