M. Brindha![]() | Poruran Sivakumar*
| Poruran Sivakumar*![]()
© 2025 The authors. This article is published by IIETA and is licensed under the CC BY 4.0 license (http://creativecommons.org/licenses/by/4.0/).
OPEN ACCESS
This paper presents an automated system named GWOESCA-SVM, which integrates the hybrid Grey Wolf Optimizer-Enhanced Sine Cosine Algorithm (GWOESCA) with Support Vector Machine (SVM) to differentiate between abnormal and healthy speech samples. First, the extracted features from speech and Electroglottography (EGG) signals are integrated. Second, GWOESCA was employed to choose relevant features, reducing dimensionality and boosting system performance. Third, the selected features were inputted into the GWOESCA-SVM framework to discern between healthy and pathological voice samples. The effectiveness of speech and EGG signals in classifying voice pathology, specifically using voice samples of /a/ for both men and women, was investigated. The GWOESCA-SVM obtains a maximum classification accuracy of 92.75% for male data, 89.80% for female data and 96.08% for merged data, enhancing robustness in detecting voice pathologies. A comparative analysis was conducted to validate the effectiveness of GWOESCA-SVM compared with previous approaches.
electroglottography, speech signal, support vector machine, voice pathology
Speech signals play a pivotal role in human communication, serving as the primary means of conveying information. Nevertheless, voice disorders present a barrier to effective social interaction among individuals. Voice issues are becoming more common everywhere in the world, with approximately 18 million people in India reporting voice problems each year [1]. One in every 12 children has speech, voice, and language issues, according to the NIDCD [2]. While the precise causes of voice problems remain elusive, factors such as vocal cord shutting, vocal cord paralysis, swelling on the vocal cords, brain injury, drug abuse, and neurological issues are recognized as significant contributors. [3, 4]. Further to this, some individual may encounter temporary voice problems due to factors such as tonsils, respiratory infections, allergies, and adenoids.
Professionals in teaching, singing, acting and law, extensively use their voices and they have a higher chance of experiencing voice issues. Around 25% of workers worldwide are impacted by voice issues [5]. People with voice pathology may encounter feelings of depression, anxiety and lonely, leading to various social and personal complications. There are invasive and non-invasive methods of detecting voice pathology. Laryngoscopy, stroboscope and laryngeal electromyography are a few invasive techniques that need skilled personnel and specific tools to provide an accurate diagnosis [6, 7]. These surgical procedures can be traumatic and painful for patients. Therefore the challenges are addressed using voice signal processing techniques.
Recently, strategies for addressing vocal pathology identification challenges have incorporated Machine Learning (ML), Deep Learning (DL), and their amalgamations [8-12]. In ML techniques, patient speech samples are obtained, analyzed and characteristics are retrieved. Based on the features, voice signals are categorized into healthy and pathological voices. There are problems in ML methods such as selecting a suitable feature selection algorithm, classifier and parameter optimization. DL methods automatically extract features for a better classification rate. However, DL methods must be trained by large number of samples to achieve better result. To overcome these drawbacks networks use metaheuristic algorithms for parameter optimization and improved performance.
This focuses on developing an automated voice pathology technique by integrating HNIA and SVM. In the proposed framework, features extracted from speech and Electroglottography (EGG) signals are utilized to distinguish between healthy and pathological voice samples, the contributions are as follows:
(1) A HNIA is proposed by combining GWO and GWOESCA for feature selection and SVM parameter optimization.
(2) An automated voice pathology detection system, named GWOESCA-SVM, by integrating HNIA and ML is introduced.
(3) The introduced framework can compute the salient features from speech and EGG signals, thus preserving pathological data within the datasets. SVD is used in several experiments to verify the developed system's efficacy.
(4) To evaluate and correlate each signal's contribution the new developed method uses speech and EGG signals individually.
This section presents the methodologies used in the identification of speech pathology focusing on ML and DL techniques. The common voice sample features utilized for voice pathology detection are MFCC [5], Jitter, LPCC [7], glottal signal features [8], shimmer, Wavelet entropy [9] and HNR. For categorization, KNN [6], RF [9], SVM [10], DL [11] and MLP [13] models are preferred.
Martínez et al. [14] built a voice pathology detection system using GMM. Four voice attributes such as MFCC, HNR, NNE and GNER were used as features. This system yielded an accuracy of 67%. El Emary et al. [15] focused on the categorization of voice samples into healthy and pathological samples based on MFCC, jitter, and shimmer. The GMM was employed to identify affected voices in a small subset of the SVD database. This subset consisted of 38 healthy and 63 pathological voice samples. This approach reported an accuracy of 82.37%.
In the study conducted by Souissi and Cherif [16], to categorize speech samples into healthy and pathology, the SVM classifier was used and MFCC was used as a feature, while LDA served as the dimension reduction tool. A total of 40 samples of healthy voices and 70 pathological sounds were obtained from the SVD database to evaluate the model. This approach achieved an accuracy of 86%. Amara et al. [17] reported a high accuracy of 95.5% by applying ML classifier to analyse specific /a/ vowel sound. The dataset used for analysis comprised of 45 pathological and 55 healthy voice samples. The above methods used only a small number of speech samples for evaluation. NBN was employed to identify pathological voice samples using MFCC, jitter, shimmer and F [18]. The results showed a highest classification rate of 90%.
Verde et al. [19] selected four features namely MFCC, HNR, jitter and shimmer for voice pathology detection. These features were calculated for each sample, consisting of 685 healthy and 685 pathological voice samples and subsequently used in four different classifiers to assess their classification rate. With a classification accuracy of 85.77%, the SVM classifier had the greatest performance. Lee [13] presented ML models, MFCC, LPCC, NS, and NK for identification of abnormal voices using MLP and CNN. A total of 518 samples consisted of 259 healthy and 259 pathological were obtained, from the SVD database for experimentation.
Table 1. (a) Overview of recent studies on SVD database (b) Strengths and limitations of existing approaches pertaining to voice pathology detection
|
(a) |
||||||||
|
Authors |
Year |
Features |
Classifier |
Accuracy (%) |
Selected Vowels |
Limitations |
||
|
Martínez et al [14] |
2012 |
HNR, MFCC, NNR, GNER |
GMM |
67 |
/a/ at normal pitch |
Lower classification rate |
||
|
El Emary et al. [15] |
2014 |
MFCC, jitter, shimmer |
GMM |
82.37 |
/a/ at normal pitch |
Small data set was used |
||
|
Souissi and Cherif [16] |
2015 |
Temporal derivatives |
SVM |
86 |
/a/ at normal pitch |
Needs parameter optimization |
||
|
Amara et al. [17] |
2016 |
MFCC |
GMM |
95.5 |
/a/ at normal pitch |
Tested on small data |
||
|
Dahmani and Guerti [18] |
2017 |
MFCC, jitter, shimmer, F |
NBN |
90 |
/a/ at normal pitch |
Only male samples were used |
||
|
Verde et al. [19] |
2018 |
MFCC, HNR, jitter, shimmer |
SVM |
85.77 |
/a/ at normal pitch |
Only speech signals were analysed |
||
|
Lee [13] |
2021 |
MFCC, LPCC, NS, NK |
CNN |
82.77 |
/a/ at normal pitch |
More training time |
||
|
Omeroglu et al. [20] |
2022 |
MFCC, LPCC, pitch, slope |
SVM |
90.10 |
/a/ at normal pitch |
Need parameter tuning |
||
|
Ksibi et al. [21] |
2023 |
MFCC, ZCR, RMSE |
CNN-RNN |
88.83 |
/a/ at normal pitch |
More training time |
||
|
(b) |
||||||||
|
Approach / Study |
Key Features / Classifier |
Strengths |
Limitations |
|||||
|
Martínez et al. [14], El Emary et al. [15] |
MFCC, HNR, GMM |
Simple models; low computational cost |
Low accuracy (67–82%); limited to speech features; no feature optimization |
|||||
|
Souissi and Cherif [16], Verde et al. [19] |
MFCC + Temporal features, SVM |
Moderate accuracy; good generalization on small datasets |
Manual parameter tuning; no hybrid signal use; dimensionality not reduced |
|||||
|
Amara et al. [17], Dahmani and Guerti [18] |
MFCC, jitter, shimmer; GMM, NBN |
High accuracy in limited settings; effective for vowel /a/ |
Small datasets; only male data or speech-only signals considered |
|||||
|
Lee [13], Xie et al. [22], Islam et al. [23] |
MFCC, CNN / DNN |
Learns complex representations; DL handles nonlinearity well |
Requires large datasets; high training time; lacks interpretability |
|||||
|
Omeroglu et al. [20], Ksibi et al. [21] |
CNN-RNN; combined features |
Better modeling with temporal fusion; moderate gains |
Still lacks optimization; performance varies; not tailored to EGG data |
|||||
|
Proposed: GWOESCA-SVM |
MFCC, spectral, ZCR, STE + EGG; Hybrid optimization |
Integrates speech + EGG signals; auto-optimized feature selection + SVM tuning; high accuracy (up to 96.08%) |
Slightly increased algorithmic complexity; reliant on signal quality |
|||||
Another very recent research work [20] proved the usefulness of merged features to detect pathological voices. The authors combined speech and EGG signal elements to improve accuracy in comparison to prior methods. SVM was trained using features extracted from both speech and Electroglottography (EGG), while AlexNet was employed for further analysis. The results indicated that employing the combined features as input yielded a higher classification rate in comparison to solely utilizing EGG or speech signals. Ksibi et al. [21] created for precise identification of abnormal speech on the SVD database, a deep learning model based on CNN-RNN. Signal attributes, MFCC, ZCR, and RMSE were extracted from the input voice samples and then the features were fed as input to the CNN-RNN to perform classification. This approach attained classification rate of 88.83%. Ding et al. [24] created a model for voice pathology detection using ResNet. In this model, features were computed from voice signals, and then fed to deep connected attention-ResNet to predict voice pathology. Table 1(a) provides a summary of recent works on SVD database.
To synthesize the strengths and limitations of the major existing works in the literature, we present a comparative summary in Table 1(b). This highlights the need for an integrated and optimized approach, which our proposed GWOESCA-SVM aims to address effectively.
An optimized framework is created by ML and GWOESCA to detect voice pathology. Figure 1 illustrates the overall operations of the proposed system and the stages are listed below.
Data collection: Involves collecting voice samples, from the SVD database, including pathological cases.
Feature extraction: Extracted from the speech and EGG signals.
Feature fusion: To consolidate a cohesive feature matrix, the extracted features are amalgamated.
Feature selection: GWOESCA is employed to choose the most effective features.
Classification: The classifier receives its input from the chosen features. To distinguish healthy and pathological speech samples, an improved SVM is used.
Figure 1. Pipeline of the developed framework for GWOESCA-SVM system
3.1 Data gathering
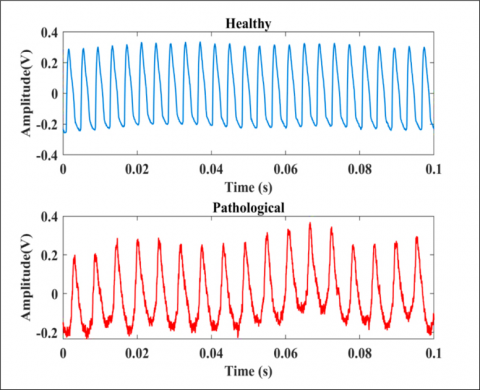
This study uses voice samples from the SVD database are used for experimentation [26]. The voice samples were recorded for three vowel sounds, namely /a/, /i/, /u/, at several pitch levels including normal, low, high and low-high. The duration of the samples ranges from 1 to 3 seconds, with a sampling rate of 50 kHz and a resolution of 16 bits. The present study included the utilization of a sustained vowel sound, namely the phoneme /a/, produced at a typical pitch level. During /a/ sound creation, a person may keep a consistent frequency and loudness [13, 20]. The data consists of 250 healthy and 260 pathological male samples of /a/ and 429 healthy and 437 pathological female samples of /a/ (Table 2). Figure 2 and Figure 3 show sample speech and EGG signals for both male and female, respectively. For enhanced clarity, signals are segmented into intervals of 0.1 seconds. The figures show notable differences between male and female speech signals, as well as in the corresponding EGG signals and effectiveness in voice pathology detection.
Table 2. Dataset information of male and female voice samples
|
Analysis |
Quantity of Voice Samples |
||
|
Male |
Female |
||
|
Healthy |
250 |
429 |
|
|
Pathology |
Functional dysphonia |
45 |
79 |
|
Granuloma |
1 |
1 |
|
|
Hyperfunctional |
52 |
80 |
|
|
Hypofunctional dysphonia |
9 |
5 |
|
|
Laryngitis |
62 |
61 |
|
|
Leucoplakia |
24 |
44 |
|
|
Psychogene dysphonia |
15 |
48 |
|
|
Rhinkeodem |
7 |
43 |
|
|
Rhinophonie aperta |
11 |
20 |
|
|
Stim polyp |
21 |
31 |
|
|
Voxsenilis |
13 |
25 |
|
|
Total |
510 |
866 |
|
(a)
(b)
Figure 2. Male healthy and pathological voice signals (a) Speech signals and (b) EGG signals
(a)
(b)
Figure 3. Female healthy and pathological voice signals (a) Speech signals and (b) EGG signals [25]
3.2 Feature extraction
Features namely MFCC, pitch, ZCR, HNR, STE and spectral features like Spectral centroid (SE), spectral kurtosis, spectral skewness and spectral slope are separately derived from both speech and EGG signals.
3.2.1 Mel-frequency Cepstral Coefficients
MFCCs are widely employed in speech recognition owing to their capacity to convey crucial information about the signal's structure [14, 16, 20, 21]. The MFCCs are standard technique for extracting features from speech signal. To compute MFCCS from the audio signals, several preprocessing steps are typically used. Primarily, audio signal a(n) is converted into several frames, ai(n), where i shows the number of frames. The Discrete Fourier transform of the frame is represented in Eq. (1):
$A_i(k)=\sum_{n=0}^{M-1} a_i(n) h(n) e^{-j 2 \pi k n / M} \quad 1 \leq k \leq K$ (1)
where, Ai(k) - DFT of the ith frame, h(n)- hamming window of M sample length, k-DFT length. The periodogram estimate of the power spectrum, pi(k) of ai(n) can be defined by Eq. (2):
${{P}_{i}}\left( k \right)=\frac{1}{M}{{\left| {{A}_{i}}\left( k \right) \right|}^{2}}$ (2)
The Mel-scale filter bank is computed. To derive MFCCs, the logarithmic Mel spectrogram is inverted back into the time domain. The Discrete Cosine Transform is employed to convert them back into the time domain, effectively removing pitch contribution.
3.2.2 Pitch
Pitch, which reflects the rate at which vocal cords vibrate while producing voiced sounds, establishes the fundamental frequency of the voiced signal. Various approaches exist for calculating pitch, including spectral-based methods [27] and autocorrelation-based methods [20]. Here, pitch is estimated using normalized correlation function with a window length of 53ms.
3.2.3 Spectral centroid
Spectral centroid represents the weighted mean of the signal frequency components, where each frequency is weighted by its magnitude. It can be represented as:
$Centroid=\frac{\mathop{\sum }_{n=0}^{M-1}f\left( n \right)x\left( n \right)}{\mathop{\sum }_{n=0}^{M-1}x\left( n \right)}$ (3)
where, x(n)-magnitude of the Fourier transform at bin number (n), f-center frequency of the bin and n-bin number.
3.2.4 Spectral entropy
Spectral entropy measures the spectral power distribution. It can be computed in Eq. (4):
Entropy $=-\sum_{n=0}^{M-1} x(n) \log _2 x(n)$ (4)
3.2.5 Spectral skewness
Spectral skewness measures symmetry around the centroid. Spectral skewness of the audio signal can be expressed in Eq. (5):
$\begin{gathered}\text { Skewness }=\frac{\sum_{n=0}^{M-1}(f(n)-\text {centroid})^3 x(n)}{(\text {spread})^3 \sum_{n=0}^{M-1} x(n)} \\ \text {centroid}=\frac{\sum_{n=0}^{M-1} f(n) x(n)}{\sum_{n=0}^{M-1} x(n)} \\ \text { spread }=\sqrt{\frac{\sum_{n=0}^{M-1}(f(n)-\text { centroid })^2 x(n)}{\sum_{n=0}^{M-1} x(n)}}\end{gathered}$ (5)
3.2.6 Spectral kurtosis
Spectral kurtosis measures the flatness of the spectrum around its centroid. It is defined by Eq. (6):
$Kurtosis=\frac{\mathop{\sum }_{n=0}^{M-1}{{\left( f\left( n \right)-centroid \right)}^{4}}x\left( n \right)}{{{\left( spread \right)}^{4}}\mathop{\sum }_{n=0}^{M-1}x\left( n \right)}$ (6)
3.2.7 Zero crossing rate
The ZCR of an audio signal can be computed by Eq. (7) and Eq. (8):
$\mathrm{ZCR}=\frac{1}{2 w} \sum_{n=1}^w\left|\operatorname{sgn}\left(a_i(n)\right)-\operatorname{sgn}\left(a_i(n-1)\right)\right|$ (7)
$\operatorname{sgn}\left(a_i(n)\right)=\left\{\begin{array}{c}1, a_i(n) \geq 0 \\ -1, a_i(n)<0\end{array}\right.$ (8)
3.2.8 Spectral slope
Spectral slope estimates the amount of decrease of the spectrum and measured by Eq. (9):
$Slope=\frac{\mathop{\sum }_{n=0}^{M-1}\left( f\left( n \right)-{{\mu }_{f}} \right)\left( x\left( n \right)-{{\mu }_{s}} \right)}{\mathop{\sum }_{n=0}^{M-1}{{\left( f\left( n \right)-{{\mu }_{f}} \right)}^{2}}}$ (9)
where, ${{\mu }_{f}}$ -Mean frequency, ${{\mu }_{s}}$-Mean spectral value
3.2.9 Harmonic noise ratio
The HNR is determined as the maximum of the normalized autocorrelation within given range. It is represented by Eq. (10):
$HNR=\max \left( autocorrelation \right)$ (10)
3.2.10 Short time energy
Mathematically, the STE can be expressed by Eq. (11):
$S T E=\sum_{m=0}^M[x(m) w(n-m)]^2$ (11)
where, x-signal, w(n-m)-window
3.3 Feature fusion
Speech features, denoted as SF = {x1,x2,x3………xP} and EGG features, represented as EF={y1,y1,y3,….yR}, may have different lengths. To integrate features extracted from speech and EGG signals, we employed an early fusion strategy. Feature vectors were first standardized and, if unequal length, zero-padding was applied to the shorter vector to match dimensions. The speech and EGG vectors were then concatenated to form a combined feature matrix, denoted as FF = [SF || EF]. This fused feature representation was used as input for feature selection and classification.
In the current implementation, simple early fusion technique is adopted, where the extracted features from speech and EGG signals were concatenated to form a unified feature matrix. This was chosen for its computational simplicity and compatibility with the GWOESCA-based feature selection framework. Furthermore, such direct concatenation may lead to feature redundancy or imbalanced contribution from each modality. To mitigate this, (a) applied feature normalization and dimensional alignment prior to concatenation, and (b) more importantly, the GWOESCA optimization process is responsible for selecting only the most discriminative features from the combined pool. As a result, redundant or less informative features were automatically excluded during the optimization phase.
Although alternative fusion strategies such as weighted fusion or decision-level fusion may offer more explicit control over the relative contribution of each modality, these approaches were not adopted in the current study for well-considered reasons. Weighted fusion typically requires the assignment or learning of weight coefficients for each feature stream (e.g., speech vs. EGG), which can introduce additional hyperparameters, require larger datasets for stable learning, and pose a risk of overfitting in high-dimensional settings with moderate sample sizes. In contrast, proposed method employs a straightforward early fusion strategy through feature-level concatenation, followed by optimization using the GWOESCA algorithm, which serves a dual purpose: it selects only the most discriminative features and eliminates redundant or weakly informative ones. This approach maintains computational efficiency, simplifies the model pipeline, and is well-suited to the hybrid structure of our dataset.
3.4 Feature selection using GWOESCA
In this study, the proposed hybrid optimization algorithm, GWOESCA, employs a population of 30 agents and allows up to 500 iterations. In GWO the parameter `a` linearly reduced from 2 to 0 across iterations to balance between exploration and exploitation. Coefficients A and C are randomly initialized in the range [0, 1]. In ESCA, a control parameter D is introduced to enhance global search capability. Classification accuracy is used as the fitness function and is evaluated using 10-fold cross-validation during each iteration.
To minimize dimensionality and enhance the classification rate, a feature selection algorithm is applied to identify the optimal informative features from the combined feature set. Here, GWOESCA is suggested for selecting the features which have high discriminative power between healthy and pathological voice samples. The GWO component of the proposed method is directly inspired by the social hierarchy and hunting behaviors observed in grey wolfs. In nature, grey wolves exhibit a structured social hierarchy, with alpha, beta, delta and omega individuals. The hunting behavior of grey wolves, including the cooperative encircling and attacking the prey, serves as a model for the optimization process for GWO [28]. The SCA aspect of the method is rooted in the mathematical principles of sine and cosine functions, which have cyclic patterns like many natural phenomena. The proposed GWOESCA combines the hierarchical leadership structure of GWO with the cyclic exploration patterns of SCA. This hybridization enables a balance between exploration and exploitation, similar to the adaptive strategies employed by natural systems to thrive in changing environments. By synergizing these two nature-inspired components, the proposed algorithm endeavors to attain resilient and effective optimization performance.
3.4.1 Social hierarchy
In the establishment of the social hierarchy, grey wolves maintain a prominent position in the food chain and adhere to defined dominance structure. Within this structure, the most optimal solution is designated as the leader, alpha (α), followed by subsequent optimal solutions labeled as beta (β) and delta (δ). Different methods are categorized as omega (ω).
3.4.2 Encircling the prey
During the hunting process, grey wolf optimizer [28] adopts a circular formation around the prey. The encircling behavior of each hunt agent is represented by Eqs. (12)-(25).
$\vec{D}=\left| \vec{C}.{{{\vec{W}}}_{p}}\left( t \right)-\vec{W}\left( t \right) \right|$ (12)
$\vec{W}\left( t+1 \right)={{\vec{W}}_{p}}\left( t \right)-\vec{A}.\vec{D}$ (13)
The vectors $\vec{A}$ and $\vec{C}$ can be computed as,
$\vec{A}=2.\vec{a}.r1-\vec{a}$ (14)
$\vec{C}=2.r2$ (15)
where, t-current iteration, ${{\vec{W}}_{p}}$-position vector of the prey, $\vec{W}$-position of a grey wolf, and $\vec{A}$, $\vec{C}$-coefficients vectors, $r1$, $r2$ are random values [0, 1] and a is a linear function of the number of iterations, decreasing from 2 to 0 over time. Choose the top hunt agent ${{\vec{W}}_{\alpha }}$, the second-best hunt agent ${{\vec{W}}_{\beta }}$, and the third-best hunt agent ${{\vec{W}}_{\delta }}$.
${{\vec{D}}_{\alpha }}=\left| {{{\vec{C}}}_{1}}.{{{\vec{W}}}_{\alpha }}-\vec{W} \right|$ (16)
${{\vec{D}}_{\beta }}=\left| {{{\vec{C}}}_{2}}.{{{\vec{W}}}_{\beta }}-\vec{W} \right|$ (17)
${{\vec{D}}_{\delta }}=\left| {{{\vec{C}}}_{3}}.{{{\vec{W}}}_{\delta }}-\vec{W} \right|$ (18)
${{\vec{W}}_{1}}={{\vec{W}}_{\alpha }}-{{\vec{A}}_{1}}.\left( {{{\vec{D}}}_{\alpha }} \right)$ (19)
${{\vec{W}}_{2}}={{\vec{W}}_{\beta }}-{{\vec{A}}_{2}}.\left( {{{\vec{D}}}_{\beta }} \right)$ (20)
${{\vec{W}}_{3}}={{\vec{W}}_{\delta }}-{{\vec{A}}_{3}}.\left( {{{\vec{D}}}_{\delta }} \right)$ (21)
Update position of current hunt agent,
$\vec{W}\left( t+1 \right)=\frac{{{{\vec{W}}}_{1}}+{{{\vec{W}}}_{2}}+{{{\vec{W}}}_{3}}}{3}$ (22)
Hunting the prey involves both exploration and exploitation. The exploration phase entails searching the prey within a range of [-2a, 2a], while the exploitation phase involves attacking the prey when a condition is met. When $\underset{\text{A}}{\mathop{\to }}\,$ < 1, the wolves are compelled to initiate the attack. Conversely, when $\underset{\text{A}}{\mathop{\to }}\,$ > 1, the wolves are directed to move away from the prey.
SCA, classified as a type of NIA algorithm [29], leverages sine and cosine formulas to enable both exploration and exploitation in optimization problems. However, it has a limitation of poor global search capability. To solve such an issue, ESCA is proposed. In ESCA, the exploration process is improved by introducing an additional parameter, D in the position formula,
$\vec{d}_\alpha=\left\{\begin{array}{l}\text { D. } \operatorname{rand}() \times \sin (\operatorname{rand}()) \times\left|\vec{c}_1 \times \vec{x}_\alpha-\vec{x}\right| \text { rand }<0.5 \\ \text { D. } \operatorname{rand}() \times \cos (\operatorname{rand}()) \times\left|\vec{c}_1 \times \vec{x}_\alpha-\vec{x}\right| \text { rand } \geq 0.5\end{array}\right.$ (23)
$D=\left( 1-{{\left( \frac{t}{T} \right)}^{e1}} \right)\left( 1+e2{{\left( \frac{t}{T} \right)}^{e2}} \right)$ (24)
${{\vec{W}}_{1}}={{\vec{W}}_{\alpha }}-{{\vec{A}}_{1}}.\left( {{{\vec{d}}}_{\alpha }} \right)$ (25)
To maximize fitness function, GWOESCA is used for feature selection as well as SVM parameter optimization. Classification accuracy is used as fitness function. Throughout training, the model is refined on the available date through the use of the specified fitness function. Based on the input features it learns to make predictions and the corresponding labels in the training set. After each training iteration, the model’s performance is evaluated on the validation set using the classification accuracy. As a preventive measure overfitting is monitored early stopping is ensured. Early stopping entails halting the training process once the performance on the validation set starts to deteriorate, even if the performance on the training data continues to advance.
The algorithm, depicted in Algorithm 1, describes the pseudocode, that is the step-by-step procedure used to optimize both feature selection and SVM parameters using the hybrid GWOESCA approach:
Initialization: A population of search agents (grey wolves) is initialized with random positions representing potential solutions (i.e., feature subsets + SVM parameters).
Fitness Evaluation: Each agent’s fitness is computed using classification accuracy via 10-fold cross-validation on the selected features.
GWO Updates: The agents positions are adjusted according to the leadership hierarchy (α, β, δ wolves) using Grey Wolf Optimizer equations to mimic the social behaviour of wolves during hunting.
ESCA Refinement: Each solution is further refined using sine and cosine updates to enhance global exploration and avoid premature convergence.
Best Solution Selection: The solution yielding the highest classification accuracy is selected, and the corresponding features and SVM parameters are retained.
Final Model Training: The final SVM classifier is trained using the optimal features and parameters for voice pathology classification.
|
Algorithm 1: GWOESCA-SVM Optimization Framework |
|
Input: Combined feature matrix FF = [SF || EF], labels Y Output: Optimized SVM classifier 1. Initialize: population of search agents (wolves), max_iter, parameters a, A, C, D 2. While (t < max_iter): a. Evaluate fitness (classification accuracy via 10-fold CV) for each agent b. Identify α (best), β (second-best), δ (third-best) solutions c. Update positions using GWO equations (Eqs. 12–22) d. Apply ESCA-based update using sine-cosine perturbations (Eqs. (23-25)) e. Update best fitness and store corresponding features and SVM parameters 3. Train final SVM on selected features with optimized parameters 4. Return trained classifier |
3.5 Classification
Due to the SVM classifier's high generalization abilities, the chosen features are given as input for classification tasks [30]. To identify the speech samples, the SVM with Radial basis kernel function is used. The SVM has two parameters, namely regularization parameter, C and gamma. These two parameters are usually fixed via experimentation, which can be time-consuming and may negatively impact the classifier’s performance. To overcome this issue, the SVM classifier's parameters are optimized using GWOESCA.
4.1 Experimental setup
Using MATLAB 2022a platform on an Intel Core i5 CPU, 2.9GHz, 16GB RAM the entire system is implemented. In this investigation, an automated GWOESCA-SVM system is used to distinguish between healthy and pathological voice samples based on merged features from speech and EGG signals, the parameters are listed below:
GWOESCA Parameters are as follows:
SVM Tuning Process – parameters are as follows:
It is important to note that no data augmentation techniques were applied during this study. As the proposed work relies on a SVM optimized through feature selection, the model architecture does not require the volume of training data typically associated with deep learning models. The feature optimization performed via GWOESCA mitigates overfitting by selecting highly discriminative features from a moderate-sized dataset.
4.2 Evaluation metrics
To evaluate the classification performance, 10-fold cross-validation is employed, wherein the data is divided into 10 smaller sets. Nine sets are utilized for training the system, leaving the tenth set exclusively for testing purposes. Each set takes turns as the testing set, and the process is repeated ten times. As a result, the system’s performance is evaluated based on the average performance obtained over the 10 iterations. The utilization of cross-fold validation effectively prevents the occurrence of data leakage through the experimental procedure, ensuring the reliability of results. The metrics used for assessment are listed in Table 3. True positive samples are those with pathology, whereas True negative samples are those without pathology.
Table 3. Performance metrics
|
Measures |
Equation |
|
Classification accuracy |
$A=\frac{TP+TN}{TP+TN+FP+FN}$ |
|
Specificity |
$SP=\frac{TN}{TN+FP}$ |
|
Recall |
$R=\frac{TP}{TP+FN}$ |
|
Precision |
$P=\frac{TP}{TP+FP}$ |
|
F1-score |
$F1=2X\frac{\left( P~X~R \right)}{\left( P+R \right)}$ |
|
GM |
$GM=\sqrt{SP~X~R}$ |
|
MCR |
$MCR=1-A$ |
4.3 Results and discussion
In the developed system, feature selection is conducted to diminish the quantity of features while preserving maximum information within the dataset, where GWOESCA is suggested for selecting pertinent features. The simulation parameters of GWOESCA are as follows: number of search agents is set to 30, maximum number of iterations is set at 500 and fitness function used is classification accuracy. Additionally, GWOESCA is used for tuning the parameters of SVM. In optimized SVM parameters, c is 0.3 and gamma is 0.001. The healthy and pathological voice signals for male and female at vowel /a/ are more clearly seen in Figure 4 by showing a box plot of a few selected characteristics.
|
Male |
Female |
|
(a) Spectral centroid |
|
|
(b) MFCC |
|
|
(c) Skewness |
|
|
(d) STE |
|
|
(e) ZCR |
|
Figure 4. Distribution of selected features
Effectiveness of the system is analysed in three cases:
Case 1: Classify the data using speech signal features
Case 2: Categorize the data using EGG signal features and
Case 3: Data classification using combined features (Speech + EGG)
The performance metrics of introduced system (Table 3) are calculated and reported in Table 4. In Table 4, first row consisting of 43-dimensional speech features are extracted from the male and female samples. Second row has 43-dimensional EGG features computed from the male and female samples. Third row features are created by adding speech and EGG signals features and it has 48-dimensions. Features are separately computed for male and female samples.
Table 4. Classification outcomes obtained by different features and GWOESCA-SVM focused on gender and individual features
|
Features |
Type |
Accuracy (%) |
Specificity (%) |
Recall (%) |
Precision (%) |
GM (%) |
F1-score (%) |
MCR |
|
Speech |
Male |
83.14 |
81.60 |
84.62 |
82.71 |
83.09 |
83.65 |
0.17 |
|
Female |
78.82 |
76.80 |
80.77 |
78.36 |
78.76 |
79.55 |
0.21 |
|
|
Male and Female |
88.82 |
89.20 |
88.46 |
89.49 |
88.83 |
88.97 |
0.11 |
|
|
EGG |
Male |
74.90 |
72.80 |
76.92 |
74.63 |
74.83 |
75.76 |
0.25 |
|
Female |
70.78 |
68.40 |
73.08 |
70.63 |
70.70 |
71.83 |
0.29 |
|
|
Male and Female |
84.71 |
88.80 |
80.77 |
88.24 |
84.69 |
84.34 |
0.15 |
|
|
Combined |
Male |
92.75 |
92.40 |
93.08 |
92.72 |
92.74 |
92.90 |
0.07 |
|
Female |
89.80 |
89.20 |
90.38 |
89.69 |
89.79 |
90.04 |
0.10 |
|
|
Male and Female |
96.08 |
96.00 |
96.15 |
96.15 |
96.08 |
96.15 |
0.04 |
4.3.1 Analysis based on speech features
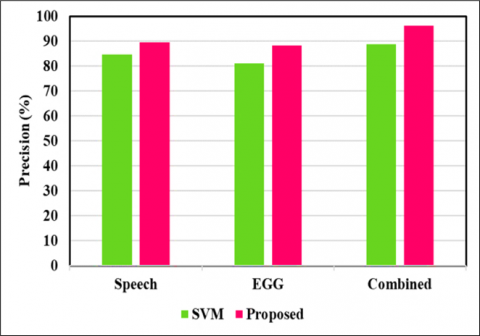
For males, the classification accuracy was 81.43%, with specificity, recall, precision, GM and F1-score ranging between 81.60% to 84.64%. For females, the accuracy was slightly lower at 78.82% with similar performance metrics. When considering both genders, the classifier achieved higher performance with an accuracy of 88.82%, indicating a slight improvement across all metrics compared to individual gender-based classification.
4.3.2 Analysis based on EGG features
The classification performance using EGG features was slightly lower compared to speech features. For males, the accuracy was 74.90%, and for females, it was 70.78%, both exhibiting similar trends in other metrics. When considering both genders, the accuracy improved to 84.71%, indicating better performance in gender-agnostic classification compared to individual gender-based classification.
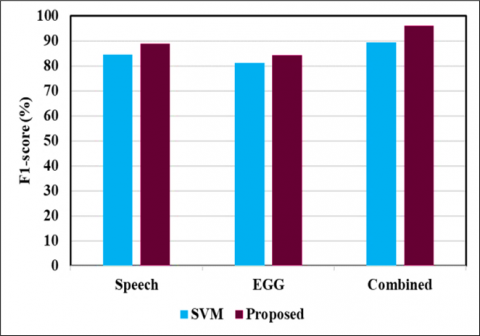
4.3.3 Analysis based on combined features
Combined speech and EGG features resulted in significantly improved classification results. The result analysis indicated that combining both speech and EGG features resulted in superior classification performance, especially when considering both genders simultaneously, highlighting the importance of feature fusion for effective voice pathology detection. For males, the accuracy surged to 92.75% with excellent performance across all metrics. Similarly, for females, the accuracy increased to 89.80% with notable improvements in other performance indicators. The classifier achieved remarkable accuracy of 96.08% when considering both genders, with excellent performance across all metrics, indicating the performance of the combined feature set in gender-agnostic classification.
The classifier performed well in detecting voice pathology disorders, showing high accuracy, specificity, recall, precision, and F1-score. These findings suggested that integrating multiple features can significantly enhance the accuracy and reliability of voice pathology detection. The classification model's consistent low MCR across all feature types underscored its robustness. Moreover, the utilization of GWOESCA-SVM demonstrated its efficacy in optimizing classifier performance across different feature sets and gender categories.
4.4 Performance comparison with standard SVM
To confirm the developed characteristics of GWOESCA, a typical SVM is used to compare the system's classification effectiveness. The results are shown in Table 5 without feature selection and parameter tuning.
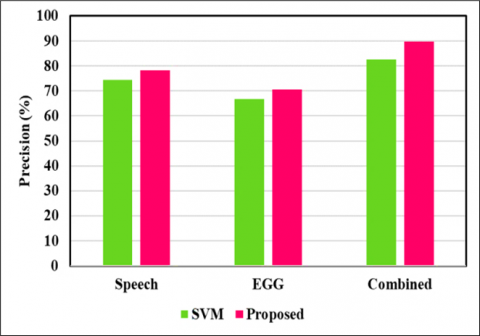
4.4.1 Speech features
For males, classification accuracy was 79.22%, with moderate specificity, recall, precision, GM, F1-score and MCR. For females, the accuracy was slightly lower compared to males, with similar performance in specificity, recall, precision, GM, F1-score and MCR. Combined features demonstrated higher accuracy compared to individual genders, indicating a potential synergistic effect.
Table 5. Performance of the developed system without feature selection and parameter optimization
|
Features |
Type |
Accuracy (%) |
Specificity (%) |
Recall (%) |
Precision (%) |
GM (%) |
F1-Score (%) |
MCR |
|
Speech |
Male |
79.22 |
77.20 |
81.15 |
78.73 |
79.15 |
79.92 |
0.21 |
|
Female |
74.71 |
72.40 |
76.92 |
74.35 |
74.63 |
75.61 |
0.25 |
|
|
Male and Female |
84.35 |
84.08 |
84.62 |
84.68 |
84.35 |
84.65 |
0.16 |
|
|
EGG |
Male |
71.18 |
69.20 |
73.08 |
71.16 |
71.11 |
72.11 |
0.29 |
|
Female |
66.75 |
64.16 |
69.23 |
66.77 |
66.65 |
67.98 |
0.33 |
|
|
Male and Female |
80.78 |
80.40 |
81.15 |
81.15 |
80.78 |
81.15 |
0.19 |
|
|
Combined |
Male |
83.92 |
77.60 |
90.00 |
80.69 |
83.57 |
85.09 |
0.16 |
|
Female |
81.96 |
82.00 |
81.92 |
82.56 |
81.96 |
82.24 |
0.18 |
|
|
Male and Female |
89.22 |
88.00 |
90.38 |
88.68 |
89.18 |
89.52 |
0.11 |
4.4.2 EGG features
For males, the system attained an accuracy of 71.18%, with specificity and recall values around 69.20% and 73.08%, respectively. Other metrics are moderate. For females, lower performance compared to males, with an accuracy of 66.75% and similar specificity and recall rates. Combined features demonstrated improved accuracy compared to individual genders, achieving 80.78%.
4.4.3 Combined features
Combined male features exhibited increase in accuracy compared to individual feature types, with 83.92%. However, the specificity is lower, while recall and precision were higher. Combined female feature gave a high accuracy of 81.96%, with balanced specificity and recall rates. Combined male and female features demonstrated better results compared to individual genders, with an accuracy of 89.22%.
From the analysis, it can be noted that system without feature selection and parameter optimization showed moderate performance across all feature types and genders categories. However, there is room for improvement, particularly in optimizing parameters and selecting relevant features, which could potentially enhance the performance metrics.
Empirical findings demonstrate that the GWOESCA-SVM gave an excellent outcome exceeding that of standard SVM classifier, by registering classification accuracy of 88.82% for speech features, 84.71% for EGG features and 96.08% for combined features and for all cases of 10-cross fold validation with feature selection and parameter optimization. The efficacy of the introduced framework employing HNIA and ML has been demonstrated to yield superior results, affirming that GWOESCA-SVM adeptly discriminates between healthy and pathological voice samples. Pictorial representation of the developed SVM and GWOESCA-SVM is depicted in Figure 5, Figure 6 and Figure 7 for male, female and combined samples, respectively.
(a) Accuracy
(b) Specificity
(c) Recall
(d) Precision
(e) GM
(f) F1-Score
Figure 5. Performance comparison of the proposed system with standard SVM for male samples
(a) Accuracy
(b) Specificity
(c) Recall
(d) Precision
(e) GM
(f) F1-Score
Figure 6. Performance comparison of the proposed system with standard SVM for female samples
(a) Accuracy
(b) Specificity
(c) Recall
(d) Precision
(e) GM
(f) F1-score
Figure 7. Performance comparison of the proposed system with standard SVM for mixed samples
4.5 Performance comparison with other optimization algorithms
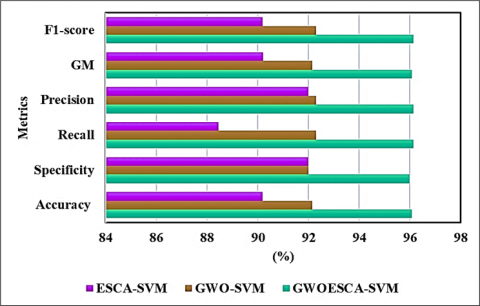
To verify the property of developed GWOESCA-SVM, the model’s performance was compared with that of the ESCA-SVM and GWO-SVM is shown in Figure 8. The GWOESCA-SVM method outperformed both GWO-SCA and ESCA-SVM in terms of all metrics, indicating its superiority in classification performance. While GWO-SVM closely followed GWOESCA-SVM, showing strong performance across all metrics, the ESCA-SVM demonstrated lower performance compared to both the GWOESCA-SVM and GWO-SVM across various metrics.
Figure 8. Performance compared with other optimization algorithms
To further validate the effectiveness of the proposed GWOESCA-SVM framework, we extended the experimental comparison by incorporating two additional nature-inspired optimization-based classifiers, namely, Particle Swarm Optimization (PSO)-SVM and Genetic Algorithm (GA)-SVM. These models were implemented using the same dataset and fusion strategy, with parameter tuning and feature selection optimized via PSO and GA, respectively. The experimental setup maintained consistent parameters for fair comparison: a population size of 30 and a maximum of 500 iterations. The classification accuracy was used as the fitness function evaluated using 10-fold cross-validation.
Table 6 presents the classification accuracy, F1-score, and MCR for all three models. As shown, GWOESCA-SVM outperformed both PSO-SVM and GA-SVM, achieving a maximum accuracy of 96.08% and the lowest MCR of 0.04. While PSO-SVM showed moderate performance, GA-SVM trailed slightly behind. This indicates that the hybrid exploration–exploitation behaviour embedded in GWOESCA is more effective in optimizing both the feature subset and SVM parameters for this complex, high-dimensional voice pathology dataset. These results are further visualized in Figure 9, which graphically compares the key performance indicators across all three optimization strategies.
Table 6. Performance comparison with other optimization algorithms
|
Model |
Accuracy (%) |
F1-score (%) |
MCR |
|
GWOESCA-SVM |
96.08 |
96.15 |
0.040 |
|
PSO-SVM |
91.72 |
91.60 |
0.080 |
|
GA-SVM |
90.45 |
90.21 |
0.100 |
Figure 9 presents a comparative view of three optimization-based classifiers, namely, proposed GWOESCA-SVM, PSO-SVM, and GA-SVM, evaluated on core performance metrics. From the graph, depicted in Figure 9, it is evident that GWOESCA-SVM outperforms the other two techniques across all indicators. Specifically, it achieves the highest accuracy (96.08%), along with a near-perfect F1-score (96.15%), and maintains the lowest MCR (0.04). In contrast, both PSO-SVM and GA-SVM perform reasonably well, but with relatively lower precision and slightly higher error rates. This comparison confirms the superiority of the hybrid GWOESCA optimization approach, particularly in handling fused speech and EGG features, which are high-dimensional and heterogeneous. The result demonstrates that GWOESCA offers a more balanced and effective search strategy, leading to better model generalization. These findings strengthen the claim that the proposed method provides a more robust solution for voice pathology classification, suitable for real-world diagnostic applications.
Figure 9. Comparison of optimization-based classifiers
4.6 Comparison with the past approaches
In using HNIA with ML, the project seeks to develop an automated approach for detecting speech pathology. As reported in Table 4, the introduced framework, GWOESCA-SVM has attained a highest classification accuracy for all cases when compared to standard SVM. Nevertheless, the performance is remarkably boosted when merged features are used, features are chosen by GWOESCA and parameters of the SVM is tuned by GWOESCA. The GWOESCA-SVM evidences its robustness and generalization capabilities considering all metrics in discriminating healthy from pathological voice samples.
Table 7 provides a comparative outcome of the simulation results for voice pathology detection between the introduced system and the former methods considering classification accuracy. To ensure a fair and genuine comparison of findings, only earlier approaches that utilized SVD data and focus on the /a/ vowel for investigation are considered. Voice pathology detection using GMM attained a classification rate of 67% [14]. El Emary et al. [15] categorized voice samples into healthy and pathological one using SVM, yielded an accuracy of 82.37%. Voice pathological detection system based on temporal derivatives and SVM classifier gave an accuracy of 86% [16]. Amara et al. [17] differentiated healthy from pathological voice samples using MFCC and SVM and obtained 95.5% accuracy. An accuracy of 90% was attained using NBN classifier [18]. Verde et al. [19] utilized four signal features and SVM classifier, attaining a classification accuracy of 85.77%. Mohammed et al. [31] adopted Resnet 34 for differentiating healthy from pathological samples, yielding a classification accuracy of 93.72%. Voice pathology classification approach using MLP achieved a classification rate of 82,77% [13]. Omeroglu et al. [20] investigated the power of standard SVM in categorizing voices samples into healthy and pathological ones and obtained 90.10% accuracy. Islam et al. [23] used CNN for voice categorization and yielded classification accuracy of 80.3%. Deep learning method-based voice detection methods yielded 73.83% accuracy [22]. Ksibi et al. [21] designed a hybrid approach by combining CNN-RNN for voice classification and reached an accuracy of 88.33%. The relevant features chosen by the GWOESCA tuned SVM resulted in a highest classification rate of 92.75% for male speech features, 89.80% for female features and 96.08% for combined male and female data.
The proposed method outperformed previous models by classification accuracy for both individual genders and the combined dataset. Several methods achieved moderate accuracy, as reported by Ahmed et al. [17], Mohammed et al. [31], and Hossain et al. [32]. Methods proposed by Martínez et al. [14] and Xie et al. [22] showed relatively lower accuracy compared to the others. The proposed GWOESCA-SVM method demonstrated significant advancement in accuracy compared to previous approaches, making it promising technique for voice pathology detection.
The current experimental design is limited to the Saarbruecken Voice Database (SVD), which was chosen due to its high-quality recordings, availability of both speech and Electroglottography (EGG) signals, and extensive labelling of multiple pathological classes across gender.
However, the cross-dataset validation plays a critical role in confirming the robustness and applicability of any machine learning system in real-world scenarios. Unfortunately, as of this study, publicly available databases with synchronized speech and EGG signal recordings are limited, and most alternatives (e.g., MEEI, AVPD) do not provide both modalities or are restricted in terms of pathological diversity or demographic distribution. That said, to partially address this limitation and are as follows:
• We performed extensive 10-fold cross-validation within the SVD dataset across three different conditions: male-only, female-only, and combined gender samples, using speech-only, EGG-only, and hybrid features. This layered evaluation framework was designed to simulate variability and ensure the model generalizes across gender and feature types.
• Additionally, we compared our model’s performance against several prior state-of-the-art methods (depicted in Table 7), many of which also relied on the SVD database. This fair benchmarking allows direct assessment of improvements brought by the GWOESCA-SVM framework.
Table 7. Performance comparative study of GWOESCA-SVM with former methods
|
Contributors |
Year |
Accuracy (%) |
|
Martínez et al. [14] |
2012 |
67.00 |
|
El Emary et al.[15] |
2014 |
82.37 |
|
Souissi and Cherif [16] |
2015 |
86.00 |
|
Amara et al. [17] |
2016 |
95.50 |
|
Dahmani and Guerti [18] |
2017 |
90.00 |
|
Hossain et al. [32] |
2017 |
92.80 |
|
Verde et al. [19] |
2018 |
85.77 |
|
Mohammed et al. [31] |
2020 |
93.72 |
|
Lee [13] |
2021 |
82.77 |
|
Omeroglu et al. [20] |
2022 |
90.10 |
|
Islam et al. [23] |
2022 |
80.30 |
|
Xie et al. [22] |
2022 |
73.83 |
|
Ksibi et al. [21] |
2023 |
88.83 |
|
Proposed |
Male |
92.75 |
|
Female |
89.80 |
|
|
Combined |
96.08 |
4.7 Performance variations between genders
This subsection analyses the difference in classification outcomes between male and female voice samples, based on both numeric metrics and confusion matrices.
Figure 10. Confusion matrix for male samples
Figure 11. Confusion matrix for female sample
To further investigate the performance variations between genders, we analysed the confusion matrices for male and female samples, as shown in Figures 10 and 11, respectively. In the male dataset (Figure 10), the system correctly identified 117 pathological and 115 healthy samples, with only 18 misclassifications. This reflects the relatively higher uniformity and clarity of acoustic patterns in male voices, making pathological deviations more detectable. In contrast, the confusion matrix for female samples (Figure 11) reveals a slightly lower classification accuracy, with 30 healthy samples misclassified as pathological and 24 false negatives. This increase in misclassification can be attributed to the greater variability in pitch, voice modulation, and EGG signals in female subjects, which tends to blur the decision boundaries between healthy and pathological classes. These visual insights reinforce the numeric performance metrics and highlight the importance of considering gender-specific signal characteristics when designing robust voice pathology detection systems.
4.8 Computational efficiency and practical feasibility
To address the computational efficiency and real-world applicability, quantitative measurements of training and inference times for the proposed GWOESCA-SVM model is determined. These measurements were conducted on the same hardware configuration used for all experiments.
(a) Training Time: For the combined feature set (speech + EGG), the average training time per 10-fold cross-validation cycle was approximately 135 seconds. This includes time for feature selection and SVM parameter optimization using GWOESCA (population = 30, iterations = 500).
(b) Inference Time: Once trained, the average classification time per test sample was approximately 0.012 seconds, indicating suitability for near-real-time deployment in diagnostic tools.
(c) Discussion: While the hybrid nature-inspired optimization phase introduces some computational overhead during training, this cost is acceptable given the one-time offline training requirement. The inference phase remains lightweight, making the system practical for real-time or embedded voice assessment scenarios in clinical or telemedicine environments.
4.9 Robustness to noise and clinical deployment considerations
(a) Robustness to Noisy or Low-Quality Signals: Although the SVD used in the proposed study comprises clean, high-quality recordings, real-world voice data, especially from clinical or remote environments, is often subject to background noise, recording artifacts, or variable microphone quality. While our current system does not explicitly include noise-handling mechanisms, it maintains a degree of robustness due to the following:
(b) Clinical Deployment Feasibility: The proposed GWOESCA-SVM framework was designed with low inference cost and lightweight deployment potential in mind. Once trained, the classifier operates with an average inference time of 0.012 seconds per sample, as discussed in Section 4.8. This makes it well-suited for real-time screening applications, including, (i) Outpatient voice clinics, (ii) Telemedicine consultations, and (iii) Smartphone-based remote voice analysis tools.
This paper undertook an exhaustive and meticulous examination of speech and EGG signals, aiming to differentiate between healthy and pathological voices through binary categorization, exploring their diverse origins and unique characteristics.
The data samples employed were recording of vowel /a/. The dataset consisted of healthy records obtained from 250 men and 429 women, while the pathological group comprised 260 pathological men and 437 pathological women whose recordings are taken at normal pitch. From these recordings, voice-related data’s are computed using multiple feature extractions techniques such as MFCC, spectral descriptors, zero crossing rate and short time energy, were employed. GWOESCA is proposed to select salient features. Additionally, GWOESCA is used for tuning the parameters of SVM classifier.
The maximum classification rate of 96.08% is obtained by the GWOESCA-SVM with combined features. The second-best accuracy of 92.75% is attained by using combined men data. The third best accuracy of 89.80% is achieved using merged women data. The efficacy of conducting experiments using mixture of male and female samples proved to be more successful than using either male or female samples. Additionally, there is a valuable advantage in incorporating MFCC with spectral descriptors to enhance categorization task, as both contribute crucial information. The finding’s revealed that employing a combination of ML and HNIA was beneficial in distinguishing between normal and pathological voices. In future, this study will be focussed on the development of pathological voice detection systems capable of classifying both the severity of a certain illness and the voice quality. Additionally, we plan to validate the proposed GWOESCA-SVM system on additional datasets to further examine its generalizability across varied recording conditions and population groups, as well.
|
CNN |
Convolutional Neural Network |
|
DFT |
Discrete Fourier Transform |
|
DL |
Deep Learning |
|
EGG |
Electroglottography |
|
ESCA |
Enhanced Sine Cosine Algorithm |
|
F |
Frequency |
|
FN |
False Negative |
|
FP |
False Positive |
|
GM |
Geometric Mean |
|
GMM |
Gaussian Mixture Model |
|
GNER |
Glottal-to-Noise Excitation Ratio |
|
GWO |
Grey Wolf Optimizer |
|
HNIA |
Hybrid Nature Inspired Algorithm |
|
HNR |
Harmonic-to-Noise Ratio |
|
KNN |
K-Nearest Neighbors |
|
LDA |
Linear Discriminant Analysis |
|
LPCC |
Linear Prediction Cepstral Coefficients |
|
MCR |
Miss Classification Rate |
|
MFCC |
Mel-frequency Cepstral Coefficients |
|
ML |
Machine Learning |
|
MLP |
Multilayer Perceptron |
|
NBN |
Nave Bayes Network |
|
NIDCD |
National Institute on Deafness and Other Communication Disorder |
|
NK |
Normalized Kurtosis |
|
NNE |
Normalised Noise Energy |
|
NS |
Normalized Skewness |
|
RF |
Random Forest |
|
RMSE |
Root Mean Squared Error |
|
RNN |
Recurrent Neural Network |
|
SE |
Spectral Entropy |
|
STE |
Short Time Energy |
|
SVD |
Saarbruecken Voice Database |
|
SVM |
Support Vector Machine |
|
TN |
True Negative |
|
TP |
True Positive |
|
ZCR |
Zero Crossing Rate |
[1] Thomas, P.M., Nayak, S., Devadas, U. (2022). Prevalence and voice characteristics in an Indian treatment-seeking population for voice disorders. An International Journal of Otorhinolaryngology Clinics, 13(3): 110-117. https://doi.org/10.5005/jp-journals-10003-1391
[2] National Institute of Deafness and other Communication Disorders. https://www.nidcd.nih.gov/news/2015/about-1-12-children-has-disorder-related-voice-speech-language-or-swallowing#:~:text=Nearly%201%20in%2012% 20children,children%20in%20the%20United%20States, accessed on June 01, 2023.
[3] Islam, R., Tarique, M. (2022). A novel convolutional neural network based dysphonic voice detection algorithm using chromagram. International Journal of Electrical & Computer Engineering, 12(5): 5511-5518. https://doi.org/10.11591/ijece.v12i5.pp5511-5518
[4] Speech and Language Impairment, National dissemination center for children with disability. https://eric.ed.gov/?id=ED572698, accessed on March 1, 2023.
[5] Al-Nasheri, A., Muhammad, G., Alsulaiman, M., Ali, Z., Malki, K.H., Mesallam, T.A., Ibrahim, M.F. (2017). Voice pathology detection and classification using auto-correlation and entropy features in different frequency regions. IEEE Access, 6: 6961-6974. https://doi.org/10.1109/ACCESS.2017.2696056
[6] Dahmani, M., Guerti, M. (2018). Glottal signal parameters as features set for neurological voice disorders diagnosis using K-Nearest Neighbors (KNN). In 2018 2nd International Conference on Natural Language and Speech Processing (ICNLSP), Algiers, Algeria, pp. 1-5. https://doi.org/10.1109/ICNLSP.2018.8374384
[7] Mittal, V., Sharma, R.K. (2021). Deep learning approach for voice pathology detection and classification. International Journal of Healthcare Information Systems and Informatics (IJHISI), 16(4): 1-30. https://doi.org/10.4018/IJHISI.20211001.oa28
[8] Kadiri, S.R., Alku, P. (2019). Analysis and detection of pathological voice using glottal source features. IEEE Journal of Selected Topics in Signal Processing, 14(2): 367-379. https://doi.org/10.1109/JSTSP.2019.2957988
[9] Muhammad, G., Alhamid, M.F., Hossain, M.S., Almogren, A.S., Vasilakos, A.V. (2017). Enhanced living by assessing voice pathology using a co-occurrence matrix. Sensors, 17(2): 267. https://doi.org/10.3390/s17020267
[10] Muhammad, G., Alhamid, M.F., Alsulaiman, M., Gupta, B. (2018). Edge computing with cloud for voice disorder assessment and treatment. IEEE Communications Magazine, 56(4): 60-65. https://doi.org/10.1109/MCOM.2018.1700790
[11] Syed, S.A., Rashid, M., Hussain, S., Zahid, H. (2021). Comparative analysis of CNN and RNN for voice pathology detection. BioMed Research International, 2021(1): 6635964. https://doi.org/10.1155/2021/6635964
[12] Harar, P., Alonso-Hernandezy, J.B., Mekyska, J., Galaz, Z., Burget, R., Smekal, Z. (2017). Voice pathology detection using deep learning: A preliminary study. In 2017 International Conference and Workshop on Bioinspired Intelligence (IWOBI), Funchal, Portugal, pp. 1-4. https://doi.org/10.1109/IWOBI.2017.7985525
[13] Lee, J.Y. (2021). Experimental evaluation of deep learning methods for an intelligent pathological voice detection system using the Saarbruecken voice database. Applied Sciences, 11(15): 7149. https://doi.org/10.3390/app11157149
[14] Martínez, D., Lleida, E., Ortega, A., Miguel, A., Villalba, J. (2012). Voice pathology detection on the Saarbrücken voice database with calibration and fusion of scores using MultiFocal Toolkit. Advances in Speech and Language Technologies for Iberian Languages, 328: 99-109. https://doi.org/10.1007/978-3-642-35292-8_11
[15] El Emary, I.M.M., Fezari, M., Amara, F. (2014). Towards developing a voice pathologies detection system. Journal of Communications Technology and Electronics, 59(11): 1280-1288. https://doi.org/10.1134/S1064226914110059
[16] Souissi, N., Cherif, A. (2015). Dimensionality reduction for voice disorders identification system based on Mel Frequency Cepstral Coefficients and support vector machine. In 2015 7th International Conference on Modelling, Identification and Control (ICMIC), Sousse, Tunisia, pp. 1-6. https://doi.org/10.1109/ICMIC.2015.7409479
[17] Amara, F., Fezari, M., Bourouba, H. (2016). An improved GMM-SVM system based on distance metric for voice pathology detection. Applied Mathematics & Information Sciences, 10(3): 1061-1070. http://doi.org/10.18576/amis/100324
[18] Dahmani, M., Guerti, M. (2017). Vocal folds pathologies classification using Naïve Bayes Networks. In 2017 6th International Conference on Systems and Control (ICSC), Batna, pp. 426-432. https://doi.org/10.1109/ICoSC.2017.7958686
[19] Verde, L., De Pietro, G., Sannino, G. (2018). Voice disorder identification by using machine learning techniques. IEEE Access, 6: 16246-16255. https://doi.org/10.1109/ACCESS.2018.2816338
[20] Omeroglu, A.N., Mohammed, H.M., Oral, E.A. (2022). Multi-modal voice pathology detection architecture based on deep and handcrafted feature fusion. Engineering Science and Technology, an International Journal, 36: 101148. https://doi.org/10.1016/j.jestch.2022.101148
[21] Ksibi, A., Hakami, N.A., Alturki, N., Asiri, M.M., Zakariah, M., Ayadi, M. (2023). Voice pathology detection using a two-level classifier based on combined CNN–RNN architecture. Sustainability, 15(4): 3204. https://doi.org/10.3390/su15043204
[22] Xie, X.P., Cai, H., Li, C., Wu, Y., Ding, F. (2023). A voice disease detection method based on MFCCs and shallow CNN. Journal of Voice. https://doi.org/10.48550/arXiv.2304.08708
[23] Islam, R., Abdel-Raheem, E., Tarique, M. (2022). Voice pathology detection using convolutional neural networks with electroglottographic (EGG) and speech signals. Computer Methods and Programs in Biomedicine Update, 2: 100074. https://doi.org/10.1016/j.cmpbup.2022.100074
[24] Ding, H., Gu, Z., Dai, P., Zhou, Z., Wang, L., Wu, X. (2021). Deep connected attention (DCA) ResNet for robust voice pathology detection and classification. Biomedical Signal Processing and Control, 70: 102973. https://doi.org/10.1016/j.bspc.2021.102973
[25] Rehman, M.U., Shafique, A., Azhar, Q.U.A., Jamal, S.S., Gheraibia, Y., Usman, A. (2024). Voice disorder detection using machine learning algorithms: An application in speech and language pathology. Engineering Applications of Artificial Intelligence, 133(A): 108047. https://doi.org/10.1016/j.engappai.2024.108047
[26] Saarbrücken Voice Database, University of Saarland. https://stimmdb.coli.uni-saarland.de/, accessed on 23 Aug 2025.
[27] Jothilakshmi, S. (2014). Automatic system to detect the type of voice pathology. Applied Soft Computing, 21: 244-249. https://doi.org/10.1016/j.asoc.2014.03.036
[28] Mirjalili, S., Mirjalili, S.M., Lewis, A. (2014). Grey wolf optimizer. Advances in Engineering Software, 69: 46-61. https://doi.org/10.1016/j.advengsoft.2013.12.007
[29] Mirjalili, S. (2016). SCA: A sine cosine algorithm for solving optimization problems. Knowledge-Based Systems, 96: 120-133. https://doi.org/10.1016/j.knosys.2015.12.022
[30] Abe, S. (2005). Support Vector Machines for Pattern Classification. London: Springer London. https://doi.org/10.1007/1-84628-219-5_2
[31] Mohammed, M.A., Abdulkareem, K.H., Mostafa, S.A., Khanapi Abd Ghani, M., Maashi, M.S., Garcia-Zapirain, B., Oleagordia, I., Alhakami, H., Al-Dhief, F.T. (2020). Voice pathology detection and classification using convolutional neural network model. Applied Sciences, 10(11): 3723. https://doi.org/10.3390/app10113723
[32] Hossain, M.S., Muhammad, G., Alamri, A. (2019). Smart healthcare monitoring: A voice pathology detection paradigm for smart cities. Multimedia Systems, 25(5): 565-575. https://doi.org/10.1007/s00530-017-0561-x