Shrishti Jain![]() | Dhruv Rastogi
| Dhruv Rastogi![]() | Preeti Nagrath*
| Preeti Nagrath*![]() | Gabriel Stoian
| Gabriel Stoian![]() | Daniela Danciulescu
| Daniela Danciulescu![]() | Jude Hemanth
| Jude Hemanth![]()
© 2025 The authors. This article is published by IIETA and is licensed under the CC BY 4.0 license (http://creativecommons.org/licenses/by/4.0/).
OPEN ACCESS
Depression has become a significant medical concern nowadays. It is characterized by deviations from the norm, manifesting as mood swings and transient emotional reactions to daily challenges. When persistent and coupled with severe symptoms, depression becomes a significant medical concern. This paper works on the detection of depression and presents FVM (Facial & verbal features and motion detection) Depression Assessment Model, which is an effective technique for identifying psychological depression, leveraging information extracted from motion activity, speech, and facial features. The proposed method employs a three-step detection framework to detect depression in individuals by employing classifiers to assess facial expressions, analyze speech, and incorporate motion activity. The ensemble classifier model, including a CNN-based model for facial expression and speech analysis, along with various machine learning techniques and the LSTM (Long Short-Term Memory) model have been implemented for motion activity analysis. A CNN model designed to capture facial features exhibited remarkable proficiency with a test accuracy of 99.47%, verbal data achieved a commendable test accuracy of 70.4 %, and human motion activity data yielded the highest accuracy of 72% with the LSTM model. The results from these individual models are combined using a soft voting ensemble technique. Thus, integrates the strengths of all three models to detect depression in individuals more effectively. Therefore, the proposed model offers a novel and effective approach to detecting depression, leveraging facial, verbal, and motion data. By combining the results of these analyses, the model facilitates a more comprehensive understanding of an individual's mental health.
depression detection, CNN, Random Forest, KNN, XGBoost, LSTM
Depression, commonly referred to as major depressive disorder (MDD), is one of the most common psychiatric diseases in the world. As per the WHO’s Comprehensive Mental Health Action Plan 2013-2020 [1], depression ranks among the primary causes of disability globally, particularly affecting women, with an annual impact on over 300 million individuals. WHO [2] states that approximately 3.8% of the global population, encompassing 5.0% of adults and 5.7% of individuals aged 60 and above, is affected by depression, amounting to a staggering 280 million people worldwide. It is projected that by 2030, depression will surpass cardiovascular disease as the leading cause of illness burden in high-income nations, where it currently contributes to 4.3% of the worldwide disease burden. This number has significantly increased due to the emergence of the COVID-19 pandemic. A systematic review [3], a study examined the mental health repercussions of COVID-19, revealing a substantial 27.6% rise in cases of depressive disorder on a global scale.
The Institute of Medicine Committee on the Prevention of Mental Disorders named depression as the most avoidable mental condition, and numerous studies have shown that treating depression early can lessen its detrimental effects. Identifying individuals experiencing depression promptly is crucial for responding swiftly and alleviating the strain on public health systems, potentially slowing the progression of the condition. However, options and services for the treatment and early diagnosis of depression and other mental health disorders remain limited. For detecting depression some established methods includes, The Beck Depression Inventory-II, the Center for Epidemiologic Studies Depression Scale (CES-D) [4], the Geriatric Depression Scale [5], and the Hospital Anxiety and Depression Scale are a few established laboratory tests for the diagnosis of depression. Most diagnoses are made based on self or family-reported information from the Patient Health Questionnaire-9 and the Hamilton Rating Scale for Depression and a combination of numerous markers is used while making allowances for a larger budget.
However, numerous individuals grappling with depression encounter challenges in obtaining psychological healthcare assistance due to financial and geographical obstacles. According to the World Health Organization (WHO) [6], more than 75% of people with depression in low and middle-income nations fail to access accredited psychotherapy.
Therefore, in response to the current situation, innovative methods for assessing depression have emerged, such as utilizing hyperspectral imaging, analyzing human voice patterns, employing visible spectrum cameras, measuring pupil diameter, and integrating stereo thermal and visible sensors.
Thus we have utilized these cues and propose:
• The FVM Depression Assessment Model (FVMDAM), integrates motion activity, facial, and speech characteristics to detect depression. This model operates at the forefront of technological advancement, enhancing its applicability and effectiveness in diverse contexts, including real-world situations.
• By comprehensively analyzing these modalities, the research adds to a deeper comprehension of the complex nature of this mental illness.
• The study rigorously evaluates different machine learning and deep learning methods to determine their effectiveness in detecting depression, thereby advancing the understanding and application of these advanced technologies in addressing complex mental health challenges.
There are 5 sections in the research article. The introduction is in Section 1. The literature reviews and relevant works on the subject of depression detection are described and addressed in Section 2. Different research approaches that have been used and put into practice are covered in detail in Section 3. The experimental design and findings are discussed and analyzed in Section 4. Section 5 offers a conclusion of the entire study and some recommendations for further research on the topic.
Depression has started to appear in studies on occasion due to its growing importance in modern society and over the years, numerous studies have been done utilizing deep learning techniques and machine learning to detect depression, leveraging various markers including facial expressions, body language, and other behavioral cues. For instance, Kong et al. [7] developed a Python-based system utilizing Theano, which focuses on the position of the eyebrows as a marker for depression detection. Many such innovative approaches highlight the significance of physical cues in discerning mental health conditions. Such studies are pivotal in advancing our understanding of depression detection and have the potential to significantly impact clinical practice and intervention strategies.
2.1 Facial image-based approaches
Face recognition is a fascinating technique that extracts from an image meaningful characteristic. The Haar cascade classifier from the OpenCV library performs high-performance face detection [8]. To pinpoint the specific features of the face associated with depression, numerous research has been conducted. Such as Venkataraman and Parameswaran [9] utilized an SVM classifier to distinguish between a sad face and a depressed face since they share similar characteristics. Tufail et al. [10] offers a brief introduction to convolutional neural networks [11] that beautifully build models of image recognition. Likewise, The Neurology Department at Shandong University of Traditional Chinese Medicine gathered data from 1132 healthy volunteers [12] and utilized five deep CNN models, to diagnose depression after preprocessing, namely Fully Connected Convolutional Neural Network (FCN), Visual Geometry Group 11 (VGG11), Visual Geometry Group 19 (VGG19), Deep Residual Network 50 (ResNet50), and Inception version 3 (V3). Meanwhile, Zhang et al. [13] applied user visibility and action to the video and introduced a dual compression network (TSDNet). The authors developed a library of movies containing video clips with 2092 labels to test the effectiveness of TSDNet. The findings of the built-in data demonstrate that TSDNet outperforms contemporary engineering approaches with 85.42% accuracy and F1- 85.28% points.
2.2 Audio-based approaches
Similarly, a lot of work has been done on audio and textual data such as using the DAIC-WOZ dataset, Yang et al. [14] demonstrated a decision tree-based model that was intended for the categorization of depression and achieved an accuracy of 72.4%. In the meanwhile, the AVEC2017 depression sub-challenge dataset [15] was used to train and test the deep convolutional neural network (DCNN) and deep neural network (DNN) models that make up the multi-modal fusion architecture presented by Yang et al. [16]. Likewise in a study, Shen et al. [17] proposed the first Chinese depression dataset and a method for detecting depression. This approach combined text and audio representations with a BiLSTM model featuring an attention layer and a GRU model. A fully linked network was then used to process and concatenate these representations. Similarly, Thati et al. [18] collected real-time facial and verbal data from users, employing multimodalities and machine learning classifiers such as Logistic Regression and Support Vector Machines (SVM) for depression classification.
Ma et al. [19] in a work present a new deep model, DepAudioNet that is intended to capture vocal channel features related to sadness. To create a more thorough representation of audio features, DepAudioNet combines the architectures of Convolutional Neural Network (CNN) and Long Short-Term Memory (LSTM) and random sampling techniques for uniform sampling. In a paper [20] following 142 participants in a depression screening, the author gathered text and audio features data and created a model using Long Short-Term Memory (LSTM). Li et al. [21] describe a technique termed Global Information Embedding (GIE), which extracts high-level data from long-term features and thus improves an LSTM model's capacity to represent long-term features. The suggested method is tested using two well-known datasets: AVEC 2013 [22] and AVEC 2014 [23].
Vandana et al. [24] suggested a three-part approach: a textual CNN model trained only with text characteristics; an audio CNN model trained only with audio information; and a hybrid model that combines textual and audio features while utilizing LSTM techniques.
2.3 Motion activity-based approaches
Several investigations have explored the analysis of patients' motion activity, such as the study by Zanella-Calzada et al. [25], which proposed a methodology for detecting motor activity signals in depressive subjects, utilizing a Random Forest classifier and achieving an accuracy of 86.7%. Similarly, Zakariah and Alotaibi [26] collected data from a group comprising 32 healthy controls and 23 depressive patients. They applied various machine learning classification algorithms, including k-nearest neighbors, SVM, Random Forest, and Gaussian Processor depression detection.
In another publication [27], the author worked with data from 55 subjects, and after preprocessing, the information was input into a 2D-CNN. In this approach, each minute's motor activity record was depicted as a pixel within an image. The developed model demonstrated proficiency in real-time depression detection, offering a low computational burden and achieving an accuracy rate of 76.72%. The analysis is given in Table 1.
These studies emphasize the diversity of approaches in Depression detection, showcasing methods ranging from Data collection techniques to multi-modular approaches by utilizing a wide range of machine learning algorithms for depression detection. However, while many studies have focused on singular indicators, our approach advocates the integration of data from multiple physical indicators holds promise for enhancing the accuracy of depression detection and offers deeper insights into the individual's mental state. Such multi-modal approaches not only provide a more holistic understanding of depression but also offer significant potential for refining diagnostic processes and informing personalized interventions.
Table 1. Comparative analysis on basis of datasets used
|
Ref |
Dataset used |
Features Analysed |
Model Description |
Results |
|
[9] |
JAFFE database |
Facial Features |
SVM classifier |
- |
|
[10] |
FER2013 Dataset |
Facial Features |
2D-CNN architecture |
Accuracy: 76.83% |
|
[14] |
DAIC-WOZ dataset |
Verbal features |
Decision tree-based model |
Accuracy: 72.4% |
|
[16] |
AVEC2017 depression sub-challenge dataset |
Verbal features |
DCNN and DNN model |
RMSE: 4.653 MAE: 3.980 |
|
[17] |
DAIC-WoZ and EATD-Corpus |
Verbal Features |
BiLSTM model featuring attention layer and GRU model |
F1 score: 0.71 Recall: 0.84 |
|
[18] |
Collect data at real time |
Facial and verbal features |
Logistic Regression and SVM |
Accuracy: 86% |
|
[19] |
DAIC-WoZ dataset |
Verbal Features |
LSTM and CNN |
F1 Score: 0.52 |
|
[20] |
Collected data from 142 participants |
Verbal Features |
LSTM |
|
|
[21] |
AVEC 2013 and AVEC 2014 |
Verbal Features |
LSTM |
RMSE on AVEC 2013 dataset: 9.63 RMSE on AVEC 2014 dataset: 9.40 |
|
[21] |
Collect data at real time |
Facial Features |
Fully Connected Convolutional Neural Network (FCN), Visual Geometry Group 11 (VGG11), Visual Geometry Group 19 (VGG19), Deep Residual Network 50 (ResNet50), and Inception version 3 (V3) |
Accuracy: 90% |
|
[23] |
DAIC-WoC dataset |
Verbal Features |
CNN and LSTM |
Accuracy: 88% |
|
[24] |
Collected videos containing 2092 labeled video clips |
Facial Features |
TSDNet |
Accuracy: 85.42% |
|
[26] |
Collected data from a group comprising 32 healthy controls and 23 depressive patients |
Motion activity |
k-nearest neighbors, SVM, Gaussian process, and Random Forest |
- |
|
[27] |
Collect data from 55 subjects |
Motion activity |
CNN |
Accuracy: 76.72% |
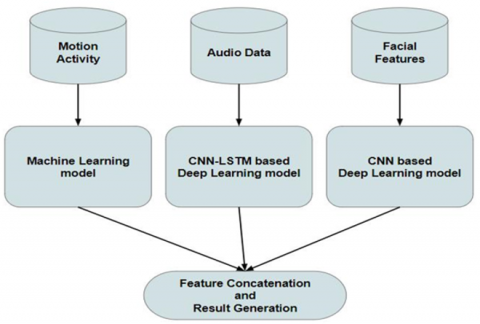
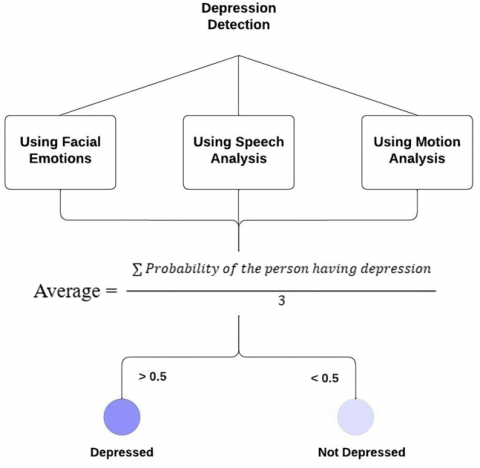
This study emphasizes the ensemble results derived from three distinct models as shown in Figure 1, each targeting specific data modalities: facial expressions, speech, and motion. Our rationale for employing separate models lies in the distinctive characteristics inherent to each type of data. By utilizing specialized models optimized for facial expressions, speech, and motion, we aim to comprehensively capture and accurately analyze the information pertinent to each modality. This approach enhances the effectiveness of our depression detection system by ensuring thorough assessment across multiple dimensions of data.
Figure 1. Workflow of the proposed three-stage detector framework
3.1 Data collection
Data for each of the three individual models have been collected from publicly available sources. The nature of the collected data is elucidated below.
3.1.1 Speech analysis
Distress Analysis Interview Corpus-Wizard of Oz Interviews, or DAIC-WOZ [24, 28-30] for short, is a sizable corpus that includes replies from people who are depressed. The purpose of this database is to aid in the treatment of mental health conditions such as depression, anxiety, and stress. It includes a sizable amount of data in the form of patient text responses, voice or audio recordings, and video recordings.
The University of Southern California (USC) website requires an application in order to access the DAIC-WOZ Database. If accepted, access to download the dataset is granted. The 189 sessions that make up the dataset are downloadable as zip files. Answers to questions from 130 people without depression and 59 people with depression are included in these sessions.
Table 2. Training set of DAIC-WOZ dataset
|
Participant ID |
PHQ8Binary |
PHQ8 Depressed |
Gender (1:female, 0:male) |
PHQ8_Score |
|
301 |
0 |
1 |
1 |
8 |
|
302 |
1 |
2 |
0 |
14 |
|
303 |
1 |
1 |
0 |
10 |
|
304 |
0 |
0 |
1 |
1 |
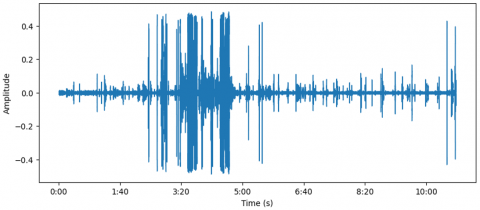
Figure 2. Sample waveform of an audio file from the DAIC-WOZ dataset
Three folders comprise the DAIC-WOZ database: dev_data, train_data, and test_data, including various AUDIO.wav files, as depicted in Figure 2, and Patient IDs, PHQ8 scores, gender information, binary labels, and responses to all questionnaire questions for the training dataset included in the CSV file, as depicted in the Table 2, that serves as the training set.
3.1.2 Emotion classification
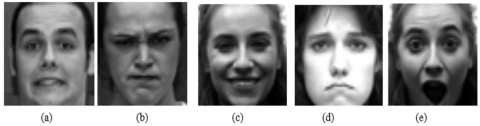
This study utilized the CK+48 dataset, which is a downscaled version of the Extended Cohn-Kanade Dataset (CK+). The CK+ dataset comprises 593 video sequences featuring 123 different subjects aged between 18 and 50, representing various genders and ethnic backgrounds. Each video depicts a transition from a neutral facial expression to a specific peak expression, captured at 30 frames per second (FPS) and with resolutions of 640x480 pixels. Among these videos, 327 are categorized into one of seven expression classes: disgust, happiness, surprise, anger, fear, sadness, contempt, as shown in Figure 3. The CK+ database is well recognised as one of the most popular controlled laboratory datasets for facial expression classification research.
Figure 3. CK+48 dataset consists of images of 5 different emotions namely (a) Fear (b) Anger (c) Happy (d) Sad (e) Surprise [31]
3.1.3 Motion activity
The initial aim of data collection was to investigate the motor changes associated with schizophrenia and severe depression. The dataset utilized for this study is sourced from Kaggle, known as The Depression Dataset [32]. It is organized into two folders, one for control subjects and the other for individuals with the condition. Actigraph data is gathered over time and is given to each patient in the form of a CSV file with columns for the timestamp (at one-minute intervals), date (the measurement date), and activity (measurements from the actigraph watch). Additionally, there is a file named "scores.csv" which includes the MADRS scores, with Table 3 presenting the columns found within this file.
Table 3. Sample motion activity dataset
|
No. |
Days |
Gender |
Age |
Aff |
Melaunch |
Impatient |
Edu |
Marriage |
Work |
Mdrs1 |
Mdrs2 |
|
1 |
13 |
2 |
35-39 |
2 |
2 |
1 |
06-Oct |
2 |
2 |
26 |
21 |
|
2 |
14 |
1 |
65-69 |
2 |
2 |
1 |
|
2 |
2 |
29 |
28 |
|
3 |
16 |
1 |
30-34 |
2 |
2 |
1 |
16-20 |
2 |
2 |
29 |
23 |
|
4 |
8 |
2 |
25-29 |
NA |
NA |
NA |
|
NA |
NA |
NA |
NA |
|
5 |
20 |
1 |
30-34 |
NA |
NA |
NA |
|
NA |
NA |
NA |
NA |
|
6 |
12 |
2 |
30-34 |
NA |
NA |
NA |
|
NA |
NA |
NA |
NA |
3.2.1 Motion activity data
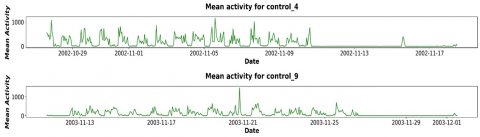
Time series analysis is a method of examining a dataset consisting of data points collected over a period of time. Unlike sporadic or arbitrary data collection, time series analysis records data points at regular intervals over a predefined time frame. This approach emphasizes the importance of time as a variable, revealing how the data evolves over time and its ultimate outcomes. Time series analysis provides a distinct source of information and establishes a predetermined hierarchy of data relationships. To ensure reliability and consistency, time series analysis normally requires a large number of data points. A large dataset ensures that the analysis can filter out erratic data and that the sample size is representative. Moreover, it guarantees that any patterns or trends found are normal and can take seasonal variations into account. Time-series data can also be utilized for forecasting, which involves making predictions based on past data. Given that the dataset includes activity data with date and time values collected at regular intervals, applying resampling allows for the generation of mean activity plots for both individuals with depression and healthy subjects.
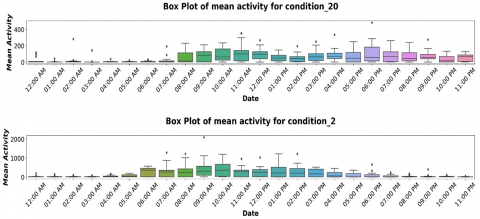
The analysis conducted on the Depression Dataset examined various features to distinguish between depressed and healthy patients. Figures 4-6 illustrate this analysis, presenting insights into the characteristics or variables that may differentiate between the two groups.
Figure 4. Mean activity for healthy patients
Figure 5. Box plots for mean activity of depressed patients
Figure 6. Box plots for mean activity of healthy patients
3.3 Data preprocessing
3.3.1 Speech data
The DAIC-WOZ dataset consists of recordings at varying emotional states or scenarios, and each audio file has been processed by computing the Short-Time Fourier Transform (STFT) to capture the time-frequency representation of the emotional speech signals using the “librosa” library with the specified sample rate of 11025 Hertz during the loading of audio files. The librosa library plays a pivotal role in this process, as it provides functionalities for loading audio files, computing the Short-Time Fourier Transform (STFT), and facilitating the conversion of the STFT to decibels. The STFT allows the extraction of the frequency-time representation of the emotional speech signals, capturing variations in frequency content over short time intervals. The magnitude of the STFT is converted to decibels, facilitating a logarithmic scale for more effective visualization of the dynamic range, crucial for discerning the dynamic range of emotional expressions. The resulting spectrogram is visualized as shown in Figure 7, where the y-axis represents frequency, x-axis denotes time, and color indicates amplitude. The generated spectrogram plot is then saved as a PNG image in the specified output directory.
Figure 7. Example of spectrogram plots generated
This pre-processing facilitates the analysis and visualization of the frequency characteristics of emotional speech signals within the context of the DAIC-WOZ dataset.
3.4 Feature selection
3.4.1 Motion activity
The dataset for predicting depression based on motor activity was preprocessed and transformed to generate the required columns as mentioned above. The activity value in the dataset was converted to a logarithm value.
To calculate the mean log activity, standard deviation log activity, minimum log activity, maximum log activity, and zero proportion activity, the activity value for a given date was filtered out.
This was calculated for all the datasets for every patient in the condition and control group.
Out of these, the source column does not hold any significance concerning the prediction. Thus, it will be removed from training and testing datasets before feeding to the model.
3.5 Classification models
In this section, detailed descriptions of the models employed for each data modality are provided, along with their respective training and testing processes.
3.5.1 Facial features
A CNN-based model has been employed in this paper to research and identify the user's facial expressions which has been depicted in Figure 8. There are various layers to the model architecture. A succession of convolution layers using the elu activation function and a max-pooling layer that returns the greatest value in each patch of the feature map follow the input layer, which starts with the pixel array of the input layer. The Flatten layer then flattens the resultant feature mapping before being sent to the Dense layers. Finally, the SoftMax function activates the Dense layer to categorize the images into 7 emotion classes.
Figure 8. CNN architecture utilized to detect depression using facial features n: negative emotion p: positive emotion
As shown in Figure 8, the model architecture contains the following types of layers:
3.5.2 Speech analysis
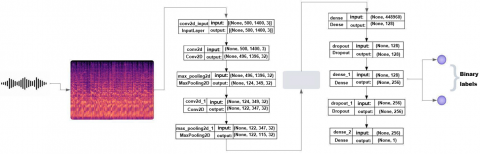
The analysis of spectrograms derived from preprocessing voice data in the DIAC-WOZ dataset involves the utilization of a deep neural network architecture, as depicted in Figure 9. This architecture comprises two convolution layers, each featuring 32 filters and a 3x3 kernel size, followed by a flattened layer, and ultimately, three dense layers. Adjacent to each convolution layer, there are batch normalization, dropout, and max pooling layers.
Within the convolution layers, the rectified linear units (ReLU) activation function is applied, while the sigmoid activation function is used in the output layer. The convolution layer uses a 3x3 kernel size, and the max pooling layer employs a 2x2 kernel size. This design aims to effectively process voice data through the extraction of pertinent features from spectrograms, employing specific activation functions and kernel sizes within a deep neural network framework.
Figure 9. CNN architecture for speech analysis
3.5.3 Motion activity
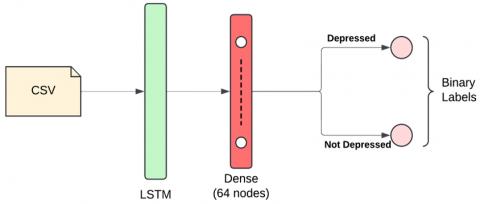
Multiple machine learning algorithms, namely XGBoost, K-Nearest Neighbors (KNN), and Random Forest, were developed to predict depression based on the extracted features. Additionally, Recurrent Neural Network (RNN) models, particularly Long Short-Term Memory (LSTM), were explored to exploit the sequential nature of motion activity data as shown in Figure 10. The LSTM architecture consists of recurrent units with memory cells that can retain information over time, allowing the model to learn long-range dependencies in the sequential data. This capability enables LSTM networks to effectively capture the dynamic nature of motion activity patterns associated with depression, such as changes in activity levels or sleep patterns over time.
Model performance was assessed using standard evaluation metrics, with hyperparameters fine-tuned to enhance predictive accuracy.
Figure 10. LSTM architecture for motion activity analysis
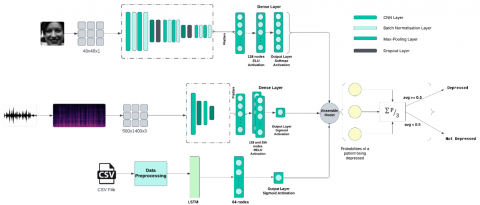
Figure 11. Detailed architecture of the proposed FVM Depression Assessment Model (FVMDAM)
3.5.4 Ensemble model
To ensemble the above-mentioned model, as shown in Figure 11, the soft voting ensemble technique has been employed. This ensemble approach, exemplified in Table 4, meticulously integrates the output set derived from individual models, culminating in a refined synthesis of results.
It allows the ensemble to leverage the uncertainty estimates provided by individual models, potentially leading to more robust and accurate predictions.
Table 4. Ensemble model
|
Facial Feature |
Speech Features |
Motion Features |
Average |
Result |
|
0.1675 |
0.059 |
0.4605 |
0.229 |
Not Depressed |
|
0.648 |
0.2274 |
0.1173 |
0.3309 |
Not Depressed |
|
0.6904 |
0.4605 |
0.7790 |
0.6433 |
Depressed |
|
0.5815 |
0.9563 |
0.6924 |
0.7434 |
Depressed |
3.6 Hyperparameter tuning
Hyperparameter tuning was conducted using a combination of grid search and Bayesian optimization. For the CNN-based facial recognition model, parameters such as a number of filters (32, 64, 128), kernel size ((3×3), (5×5)), and dropout rate (0.2–0.5) were explored using 5-fold cross-validation. The optimal configuration—64 filters, 3×3 kernels, and 0.3 dropout—was chosen based on the highest validation F1 score. For the LSTM model analyzing motion activity, Bayesian optimization via Optuna was employed to fine-tune the number of units, batch size, and learning rate. This strategy yielded a model with 64 units and 0.001 learning rate, providing the best balance between performance and training time.
4.1 Evaluation metrics
The study employs various quantitative measures to assess the testing performance of multiple classification algorithms. These techniques are evaluated using metrics such as F1 score, accuracy, recall value, and precision, derived from the confusion matrix. This matrix includes assessment variables such as True Positive (TP), identifying individuals correctly with depression; False Positive (FP), erroneously diagnosing depression due to prediction errors; True Negative (TN), accurately excluding depression; and False Negative (FN), incorrectly rejecting depression. Precision, also known as positive predictive value, signifies the percentage of correctly predicted positive outcomes by classifier algorithms.
Precision, serves as a rapid means of identifying depression in patients, predominantly emphasizing successful test outcomes.
Precision = TP/(TP + FP) (1)
Recall, calculated as the ratio of True Positives to the sum of True Positives and False Negatives, offers insight into the model's ability to identify positive instances correctly.
Recall = TP/(TP + FN) (2)
F1 score, combines accuracy and recall, provides a measure of the model's precision by considering both False Positives and False Negatives proportions.
F1-score = 2*(Precision*Recall) / (Precision+Recall) (3)
4.2 Analysis of results
4.2.1 Motion activity
Three machine learning algorithms and one deep learning algorithm were examined for the classification of a depression detection dataset throughout this study, utilizing various approaches.
Table 5. Random Forest classifier
|
|
Precision |
Recall |
F1-Score |
Support |
|
Not Depressed |
0.88 |
0.65 |
0.75 |
43 |
|
Depressed |
0.35 |
0.67 |
0.46 |
12 |
|
Accuracy |
|
|
0.65 |
55 |
|
Macro avg |
0.61 |
0.66 |
0.60 |
55 |
|
Weighted avg |
0.76 |
0.65 |
0.68 |
55 |
Table 6. KNN classifier
|
|
Precision |
Recall |
F1-Score |
Support |
|
Not Depressed |
0.91 |
0.67 |
0.77 |
43 |
|
Depressed |
0.39 |
0.75 |
0.51 |
12 |
|
Accuracy |
|
|
0.69 |
55 |
|
Macro avg |
0.65 |
0.71 |
0.64 |
55 |
|
Weighted avg |
0.79 |
0.69 |
0.72 |
55 |
Table 7. XGBoost
|
|
Precision |
Recall |
F1-Score |
Support |
|
Not Depressed |
0.88 |
0.67 |
0.76 |
42 |
|
Depressed |
0.39 |
0.69 |
0.50 |
13 |
|
Accuracy |
|
|
0.67 |
55 |
|
Macro avg |
0.63 |
0.68 |
0.63 |
55 |
|
Weighted avg |
0.76 |
0.67 |
0.70 |
55 |
Table 8. LSTM
|
|
Precision |
Recall |
F1-score |
Support |
|
Not Depressed |
0.71 |
1.00 |
0.83 |
157 |
|
Depressed |
1.00 |
0.10 |
0.18 |
72 |
|
Accuracy |
|
|
0.72 |
229 |
|
Macro avg |
0.85 |
0.55 |
0.50 |
229 |
|
Weighted avg |
0.80 |
0.72 |
0.62 |
229 |
Table 9. Comparative analysis of all models
|
Models |
Accuracy |
|
Random Forest |
0.65 |
|
KNN |
0.69 |
|
XGBoost |
0.67 |
|
LSTM |
0.72 |
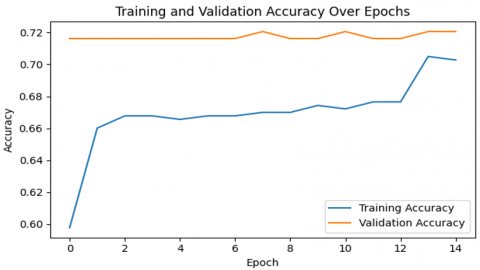
As for the algorithm's accuracy, feasibility, and efficiency, LSTM had the highest accuracy score (72%) among all algorithms, as presented in Table 5, as well as outperforming state-of-the-art accuracy standards in depression prediction tasks. As for its ability to process data in parallel, it is quick, whereas Random Forest performed the poorest, as displayed in Table 6. In terms of precision, LSTM scored the highest (80%), as shown in Table 7, and XGBoost performed the lowest (76%), depicted in Table 8. LSTM obtained the highest value (72%), while Random Forest obtained the lowest value (65%) when the recall score was considered. KNN outperformed LSTM in terms of the F1 parameter portrayed in Table 9, scoring 72% as opposed to 62% for LSTM. LSTM outperforms traditional machine learning classifiers for predicting depression, as illustrated in Figure 12.
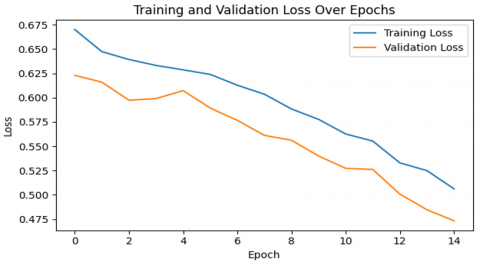
Figure 12. (a) Validation and training accuracy curve of LSTM and (b) Validation and training loss curve of LSTM
4.2.2 Facial features
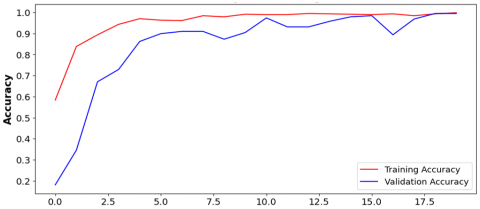
The model's performance in classifying depression based on facial features is highly notable, attaining an exceptional accuracy of 99.47%, in Figure 13. This performance surpasses state-of-the-art methodologies, which typically achieve an accuracy of around 77% [10]. This remarkable accuracy underscores the efficacy and reliability of the CNN model in effectively discerning patterns and subtle cues within facial data associated with depression.
Figure 13. (a) Validation and training accuracy and (b) Validation and training loss curve for CNN model for depression detection using facial features
4.2.3 Speech analysis
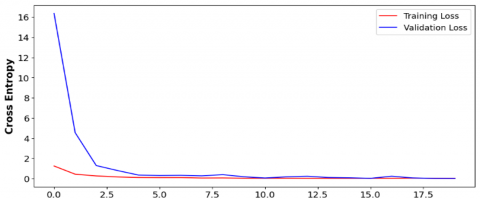
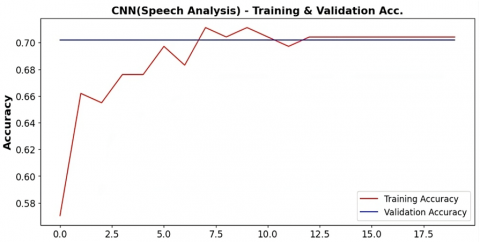
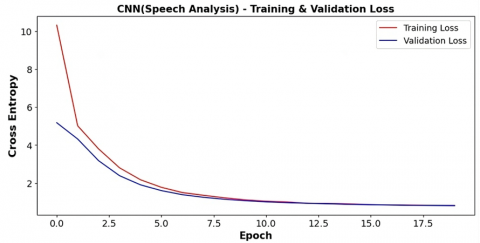
CNN models have been proposed for examining verbal data, yielding a commendable accuracy of 70.4% in Figure 14. As shown in Table 10, the model's performance is further characterized by an F1 score of 0.58, a precision reaching 0.49, and a recall rate of 0.70.
These metrics collectively indicate a reasonably effective capability of the CNN models in capturing patterns and features within verbal data, showcasing their potential utility for accurate and balanced assessments in the context of depression analysis.
Table 10. Confusion matrix for CNN model
|
|
Precision |
Recall |
F1-Score |
Support |
|
Not Depressed |
0.70 |
1.00 |
0.82 |
33 |
|
Depressed |
0.0 |
0.0 |
0.0 |
14 |
|
Accuracy |
|
|
0.70 |
47 |
|
Macro avg |
0.35 |
0.50 |
0.41 |
47 |
|
Weighted avg |
0.49 |
0.70 |
0.58 |
47 |
Figure 14. (a) Validation and training accuracy and (b) Validation and training loss curve for the CNN model for depression detection using verbal features
4.2.4 Ensemble model
The ensemble model, which integrates the outputs from the CNN-based model for facial emotion recognition, the CNN-based model for speech analysis, and the LSTM based model for motion analysis, has demonstrated impressive capabilities in classifying individuals into depressed and not depressed categories, portrayed in Figure 15. The decision to set a threshold of 50% for classification adds a practical dimension to the ensemble's performance.
Figure 15. The architecture of ensemble model
Figure 16. Classification of individuals in depressed and not depressed classes
When the combined predictions from the three individual models surpass the 50% threshold, the ensemble model classifies the individual as depressed, indicating a collective agreement among the facial, speech, and motion analysis components that the person is exhibiting signs of depression. Conversely, if the ensemble prediction falls below the 50% threshold, the individual is classified as not depressed, suggesting a consensus among the models that the emotional state does not align with depressive patterns.
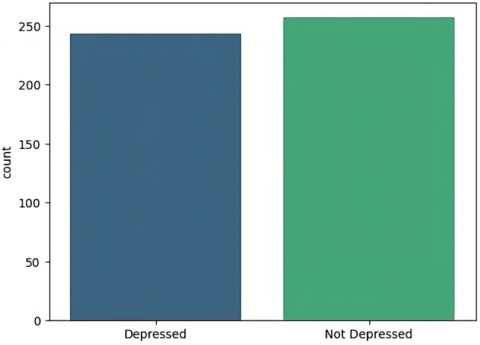
The ensemble model has been run on a combination of datasets. This process has generated predictions regarding the classification of individuals as either depressed or not, leveraging the cumulative information available in the combined data. Figure 16 illustrates the outcomes or results of this prediction process.
4.3 Temporal feature enhancement in motion activity (addressing long-term dependencies)
While Long Short-Term Memory (LSTM) networks are inherently capable of modeling long-range dependencies in sequential data, the current implementation could be further enhanced by incorporating attention mechanisms to better capture and prioritize relevant temporal features.
In future work, we propose extending the LSTM architecture to include Temporal Attention Layers. This enhancement would allow the model to dynamically weigh time steps based on their contribution to the prediction of depressive behavior. For instance, changes in activity levels during specific periods (e.g., sleep cycles, peak activity times) may be more indicative of depressive states than others. Integrating attention would improve the model’s interpretability and effectiveness by providing better temporal localization of critical behavioral patterns.
Additionally, positional encodings or transformers could also be explored as an alternative approach for extracting global dependencies across the time series data, thereby overcoming limitations inherent to recurrent architectures.
4.4 Misclassification analysis in motion activity data
Despite achieving a test accuracy of 72%, the LSTM model exhibited notable False Positives (FP) and False Negatives (FN), particularly in identifying depressed individuals. To investigate this, we analyzed misclassified cases and observed two key contributing factors:
Feature Overlap: Several non-depressed individuals displayed unusually low activity levels due to temporary inactivity (e.g., illness, lifestyle), which closely mimicked depressive motion patterns and led to False Positives. Data Noise: Inconsistent actigraph readings—such as sudden activity spikes or flatlines caused by device malfunctions or improper wear—may have contributed to false negatives (i.e., failures to detect true depressive states).
4.5 Justification and comparison of fusion strategies
In the proposed FVM Depression Assessment Model, a soft voting ensemble technique was employed to combine the outputs of three modality-specific models (facial, verbal, and motion). While this approach aggregates the predicted probabilities of each model to make the final decision, it is important to justify this choice over other fusion strategies such as feature-level fusion and model cascading.
4.5.1 Theoretical justification
Soft voting fusion:
Aggregates probabilistic outputs of individual models.
Allows each model to contribute based on its confidence level.
Useful when modalities differ in feature scale, representation, or data format (e.g., images vs. audio vs. time series).
Promotes modularity: models can be trained and updated independently.
Feature-level fusion:
Combines raw or intermediate feature representations from different modalities into a single vector.
While potentially more expressive, it introduces complexity in feature alignment and scaling.
Requires simultaneous availability of all modalities during training and inference.
Model cascading:
Uses outputs of one model as input features for another.
Can exploit inter-dependencies but may introduce propagation of errors.
May be computationally expensive and harder to debug due to entangled model behavior.
Given the heterogeneous nature of the input data (facial images, speech spectrograms, motion time series), soft voting provides a robust and interpretable fusion approach that simplifies training while preserving individual model strengths.
4.5.2 Justification summary
While soft voting is practical and effective for the current model design, the proposed comparative study in future work will ensure that the most suitable fusion strategy is adopted for maximum detection performance and real-world applicability.
4.6 Ethical considerations and data privacy
Given that this study involves highly sensitive health-related data, including facial imagery and voice recordings, ethical compliance, and data privacy are paramount.
To ensure ethical integrity:
(1) All datasets used in this research (DAIC-WOZ, CK+48, and the Depression Actigraphy Dataset) are publicly available, and data usage complies with their respective terms and licensing agreements.
(2) The DAIC-WOZ dataset requires users to submit a formal application, ensuring that access is granted only for legitimate research purposes.
(3) No personally identifiable information (PII) is used or exposed in this study. Furthermore, all data was pre-anonymized by the original data providers.
In the pursuit of advancing depression detection using diverse methodologies, the research harnessed the power of diverse machine learning and deep learning models by capturing different indicators, namely facial, verbal, and motion which together provide a better understanding of a person’s mental state, and ensemble approach to integrate the results of all three models and capitalize distinct strength of all models. A CNN model designed to capture facial features exhibited remarkable proficiency with a test accuracy of 99.47%. The CNN model for analyzing verbal data achieved a commendable test accuracy of 70.4%, and to analyze motion activity of a person, Random Forest, K- K-Nearest Neighbor, XGboost, and LSTM model architecture, strategically structured to process complex temporal information, achieved the highest accuracy using the LSTM model of 72%. The research work not only achieved comparable accuracy with the state-of-the-art referenced work in depression detection as shown in Table 1, but also emphasized the potential of collaborative model integration. In the trajectory of the research, several promising avenues emerge for future exploration. One compelling direction involves the deployment of the developed models onto embedded devices, paving the way for real-time inferences. The practical implementation could extend the applicability of depression detection to diverse scenarios, such as wearable devices or edge computing environments despite of having various practical challenges which need to addressed, such as computational resources, and latency requirements, for embedded devices evaluating the models in a real-time setting will not only test their efficiency in dynamic, everyday situations but also provide valuable insights for potential real-world applications.
[1] Woody, C.A., Ferrari, A.J., Siskind, D.J., Whiteford, H.A., Harris, M.G. (2017). A systematic review and meta-regression of the prevalence and incidence of perinatal depression. Journal of Affective Disorders, 219: 86-92. https://doi.org/10.1016/j.jad.2017.05.003
[2] Institute of Health Metrics and Evaluation. Global Health Data Exchange (GHDx). https://vizhub.healthdata.org/gbd-results/ (Accessed 4 March 2023).
[3] Santomauro, D.F., Herrera, A.M.M., Shadid, J., Zheng, P., Ashbaugh, C., Pigott, D.M., Ferrari, A.J. (2021). Global prevalence and burden of depressive and anxiety disorders in 204 countries and territories in 2020 due to the COVID-19 pandemic. The Lancet, 398(10312): 1700-1712. https://doi.org/10.1016/ S0140-6736(21)02143-7
[4] El-Ammari, A., El Malki, H., Moutawakkil, S.G., El Hilaly, J., El Houari, F., El Gnaoui, S., Ragala, M.E.A., El Rhazi, K., Zarrouq, B. (2023). Validation of the Arabic version of the Center for Epidemiologic Studies Depression Scale (CES-D) in patients with substance use disorders. BMC Psychiatry, 23: 723. https://doi.org/10.1186/s12888-023-05245-2
[5] Stone, L.E., Granier, K.L., Segal, D.L. (2019). Geriatric Depression Scale. In Encyclopedia of Gerontology and Population Aging, pp. 1-8. https://doi.org/10.1007/978-3-319-69892-2_736-1
[6] Evans-Lacko, S.A.G.S., Aguilar-Gaxiola, S., Al-Hamzawi, A., Alonso, J., Benjet, C., Bruffaerts, R., Thornicroft, G. (2018). Socio-economic variations in the mental health treatment gap for people with anxiety, mood, and substance use disorders: Results from the WHO World Mental Health (WMH) surveys. Psychological medicine, 48(9): 1560-1571. https://doi.org/10.1017/S0033291717003336
[7] Kong, X., Yao, Y., Wang, C., Wang, Y., Teng, J., Qi, X. (2022). Automatic identification of depression using facial images with deep convolutional neural network. Medical Science Monitor: International Medical Journal of Experimental and Clinical Research, 28: e936409. https://doi.org/10.12659/MSM.936409
[8] Garg, V., Garg, K. (2016). Face recognition using haar cascade classifier. Journal of Emerging Technologies and Innovative Research (JETIR), 3(12): 140-142. https://www.jetir.org/papers/JETIR1612019.pdf.
[9] Venkataraman, D., Parameswaran, N.S. (2018). Extraction of facial features for depression detection among students. Int. J. Pure Appl. Math, 118(7): 455-463.
[10] Tufail, H., Cheema, S.M., Ali, M., Pires, I.M., Garcia, N.M. (2023). Depression detection with convolutional neural networks: A step towards improved mental health care. Procedia Computer Science, 224: 544–549. https://doi.org/10.1016/j.procs.2023.09.079
[11] O’Shea, K., Nash, R. (2015). An introduction to convolutional neural networks. arXiv preprint arXiv:1511.08458. https://doi.org/10.48550/arXiv.1511.08458
[12] Kong, X., Yao, Y., Wang, C., Wang, Y., Teng, J., Qi, X. (2022). Automatic identification of depression using facial images with deep convolutional neural network. Medical Science Monitor: International Medical Journal of Experimental and Clinical Research, 28: e936409-1. https://doi.org/10.12659/MSM.936409
[13] Zhang, H., Feng, L., Li, N., Jin, Z., Cao, L. (2020). Video-based stress detection through deep learning. Sensors, 20(19): 5552. https://doi.org/10.3390/s20195552
[14] Yang, L., Jiang, D., He, L., Pei, E., Oveneke, M.C., Sahli, H. (2016). Decision tree based depression classification from audio video and language information. In Proceedings of the 6th International Workshop on Audio/Visual Emotion Challenge, New York, United States, pp. 89-96. https://doi.org/10.1145/2988257.2988269
[15] Ringeval, F., Schuller, B., Valstar, M., Gratch, J., Cowie, R., Scherer, S., Pantic, M. (2017). Avec 2017: Real-life depression, and affect recognition workshop and challenge. In Proceedings of the 7th Annual Workshop on Audio/Visual Emotion Challenge, New York, United States, pp. 3-9. https://doi.org/10.1145/3133944.3133953
[16] Yang, L., Jiang, D., Xia, X., Pei, E., Oveneke, M.C., Sahli, H. (2017). Multimodal measurement of depression using deep learning models. In Proceedings of the 7th Annual Workshop on Audio/Visual Emotion Challenge, New York, United States, pp. 53-59. https://doi.org/10.1145/3133944.3133948
[17] Shen, Y., Yang, H., Lin, L. (2022). Automatic depression detection: An emotional audio-textual corpus and a gru/bilstm-based model. In ICASSP 2022-2022 IEEE International Conference on Acoustics, Speech and Signal Processing (ICASSP), Singapore, pp. 6247-6251. https://doi.org/10.1109/ICASSP43922.2022.9746569
[18] Thati, R.P., Dhadwal, A.S., Kumar, P., P, S. (2023). A novel multi-modal depression detection approach based on mobile crowd sensing and task-based mechanisms. Multimedia Tools and Applications, 82(4): 4787-4820. https://doi.org/10.1007/s11042-022-12315-2
[19] Ma, X., Yang, H., Chen, Q., Huang, D., Wang, Y. (2016). Depaudionet: An efficient deep model for audio based depression classification. In Proceedings of the 6th International Workshop on Audio/Visual Emotion Challenge, New York, United States, pp. 35-42. https://doi.org/10.1145/2988257.2988267
[20] Al Hanai, T., Ghassemi, M.M., Glass, J.R. (2018). Detecting depression with audio/text sequence modeling of interviews. Proc. Interspeech 2018, pp. 1716-1720. https://doi.org/10.21437/Interspeech.2018-2522
[21] Li, Y., Niu, M., Zhao, Z., Tao, J. (2022). Automatic depression level assessment from speech by long-term global information embedding. In ICASSP 2022-2022 IEEE International Conference on Acoustics, Speech and Signal Processing (ICASSP), Singapore, pp. 8507-8511. https://doi.org/10.1109/ICASSP43922.2022.9747292
[22] Valstar, M., Schuller, B., Smith, K., Eyben, F., Jiang, B., Bilakhia, S., Pantic, M. (2013). Avec 2013: The continuous audio/visual emotion and depression recognition challenge. In Proceedings of the 3rd ACM International Workshop on Audio/Visual Emotion Challenge, New York, United States, pp. 3-10. https://doi.org/10.1145/2512530.2512533
[23] Valstar, M., Schuller, B., Smith, K., Almaev, T., Eyben, F., Krajewski, J., Pantic, M. (2014). Avec 2014: 3D dimensional affect and depression recognition challenge. In Proceedings of the 4th International Workshop on Audio/Visual Emotion Challenge, New York, United States, pp. 3-10. https://doi.org/10.1145/2661806.2661807
[24] Vandana, Marriwala, N., Chaudhary, D. (2023). A hybrid model for depression detection using deep learning. Measurement: Sensors, 25: 100587. https://doi.org/10.1016/j.measen.2022.100587
[25] Zanella-Calzada, L.A., Galván-Tejada, C.E., Chávez-Lamas, N.M., Gracia-Cortés, M.D.C., Magallanes-Quintanar, R., Celaya-Padilla, J.M., Gamboa-Rosales, H. (2019). Feature extraction in motor activity signal: Towards a depression episodes detection in unipolar and bipolar patients. Diagnostics, 9(1): 8. https://doi.org/10.3390/diagnostics9010008
[26] Zakariah, M., Alotaibi, Y.A. (2023). Unipolar and bipolar depression detection and classification based on actigraphic registration of motor activity using machine learning and uniform manifold approximation and projection methods. Diagnostics, 13(14): 2323. https://doi.org/10.3390/diagnostics13142323
[27] Espino-Salinas, C.H., Galván-Tejada, C.E., Luna-García, H., Gamboa-Rosales, H., Celaya-Padilla, J.M., Zanella-Calzada, L.A., Tejada, J.I.G. (2022). Two-dimensional convolutional neural network for depression episodes detection in real time using motor activity time series of depresjon dataset. Bioengineering, 9(9): 458. https://doi.org/10.3390/bioengineering9090458
[28] Ringeval, F., Schuller, B., Valstar, M., Cummins, N., Cowie, R., Tavabi, L., Pantic, M. (2019). AVEC 2019 workshop and challenge: State-of-mind, detecting depression with AI, and cross-cultural affect recognition. In Proceedings of the 9th International on Audio/Visual Emotion Challenge and Workshop, New York, United States, pp. 3-12. https://doi.org/10.1145/3347320.3357688
[29] DeVault, D., Artstein, R., Benn, G., Dey, T., et al. (2014). SimSensei Kiosk: A virtual human interviewer for healthcare decision support. In Proceedings of the 2014 International Conference on Autonomous Agents and Multi-Agent Systems, Paris, France, pp. 1061-1068.
[30] Gratch, J., Artstein, R., Lucas, G.M., Stratou, G. et al. (2014). The distress analysis interview corpus of human and computer interviews. In LREC, 14: 3123-3128.
[31] Kong, X., Yao, Y., Wang, C., Wang, Y., Teng, J., Qi, X. (2022). Automatic identification of depression using facial images with deep convolutional neural network. Medical Science Monitor, 28: e936409-1. https://doi.org/10.12659/MSM.936409
[32] Singh, A., Kumar, D. (2022). Detection of stress, anxiety and depression (SAD) in video surveillance using ResNet-101. Microprocessors and Microsystems, 95: 104681. https://doi.org/10.1016/j.micpro.2022.104681