Hongwu Qin![]() | Ji Zou
| Ji Zou![]() | Binggao He
| Binggao He![]() | Yu Fu
| Yu Fu![]() | Lizheng Wang*
| Lizheng Wang*![]()
© 2023 IIETA. This article is published by IIETA and is licensed under the CC BY 4.0 license (http://creativecommons.org/licenses/by/4.0/).
OPEN ACCESS
In order to ensure the efficient operation of wind turbine generator system (WTGS) and the safety and stability of wind farms, it is necessary to promptly detect and repair the blade damage. The traditional methods of detecting WTGS blade damage mainly rely on manual inspection, which is time-consuming, laborious, and has low accuracy. Therefore, it is of important practical significance to study the damage identification method of WTGS blades based on image processing technology. Due to the drawbacks of existing methods, this research aimed to study the damage identification method of WTGS blades based on image processing technology. A method of expanding blade damage samples based on the improved Deep Convolutional Generative Adversarial Networks (DCGAN) was first proposed, which generated a high quality damage image sample set to improve the classification performance of the deep learning model. For the problem of damage images often affected by noise and environmental factors in practical scenarios, it was solved by morphology-based blade damage edge enhancement. In addition, the blade damage state evaluation and classification process based on multifractal spectrum (MFS) was provided. Finally, the experimental results verified that the proposed algorithm was effective.
image processing, wind turbine generator system (WTGS) blade, damage identification, sample expansion
With the increasingly serious global climate change and tense resources in recent years, the development and utilization of renewable energy have become the focus of global attention [1-6]. As a green and clean energy source, wind energy is important in the global renewable energy market. WTGS is the core equipment of wind power generation system, whose operating condition directly affects the whole benefits of wind farms [7-11]. Due to the impact of various factors, such as wind strength, temperature difference, humidity and so on, WTGS blades are susceptible to cracks, wear, and other damage during long-term operation, which negatively affect the performance of WTGS [12-15]. In order to ensure the efficient operation of WTGS and the safety and stability of wind farms, it is necessary to promptly detect and repair blade damage [16-19]. The traditional methods of detecting blade damage mainly rely on manual inspection, which is time-consuming, laborious, and has low accuracy. Therefore, it is of important practical significance to study the blade damage identification method based on image processing technology.
Yang et al. [20] proposed an image identification model based on deep learning network, which was used to automatically extract image features and accurately and efficiently detect fan blade damage. Blade images were segmented using the Otsu threshold segmentation method, which eliminated the impact of image background on the detection task. In order to improve the identification performance of the proposed deep learning model, the transfer and ensemble learning classifiers were used in the convolutional neural network (CNN) model. The unmanned aerial vehicle images of wind turbine blade (WTB) verified the performance of the proposed model. Hu et al. [21] proposed a method based on the variational image segmentation model, which was used to detect the surface damage of WTGS blades. At the beginning, it was believed that the objects in the image were left behind by the background detection, which was transformed into an optimization problem using the level set method and one-dimensional Heaviside function. Then the corresponding gradient descent minimization algorithm was derived. In the experimental section, a large number of blade images with surface damage were tested using the proposed method, which successfully detected the damage. Lv et al. [22] proposed a new efficient and accurate damage detector (EADD) for wind turbine cascade images, which used the Single Shot Multibox Detector (SSD) as the detection framework and provided an improved Residual Network (ResNet) as the backbone. The improved ResNet backbone first used the dense connection block, which was composed of Factorization Depthwise Separable Bottleneck (FDSB) and feature aggregation module (FAM), making the damage detection model more lightweight and detect more rapidly. Then the Bidirectional Feature Pyramid Network (BiFPN) was introduced into the proposed method to fully utilize multiscale features and own more feature expression. Peng et al. [23] proposed an image processing method to enhance images captured in non-uniform lighting conditions. First, cartoon and texture maps of WTB images were constructed using the cartoon texture decomposition. Second, an illumination model was established on the cartoon map in Gaussian scale space to remove non-uniform lighting. Third, the WTB images were enhanced using the multi-directional Gabor transform to increase the contrast between surface damage and image background. Finally, the gradient threshold segmentation method was used to detect the surface damage of WTB.
The damage identification method of WTGS blades based on image processing technology detects blade damage quickly and accurately. The damage location and degree can be quickly identified from the captured blade images using several techniques, such as computer vision, image segmentation, and feature extraction, which improves detection efficiency. The existing identification methods based on image processing technology mainly include several methods, such as edge detection-based method, texture feature-based method, deep learning-based method, and traditional machine learning-based method, which have several drawbacks, such as sensitivity to light and noise, susceptibility to false detection and misdetection, susceptibility to false identification of damaged and non-damaged areas with similar textures, demand for a large amount of labeled data for training, time-consuming training process, and large computational resource consumption. Therefore, this research studied the damage identification method of WTGS blades based on image processing technology. A sample expansion method based on the improved DCGAN was first proposed in Chapter 2, which generated a high quality damage image sample set to improve the classification performance of the deep learning model. For the problem of damage images often affected by noise and environmental factors in practical scenarios, it was solved by morphology-based blade damage edge enhancement in Chapter 3. In addition, the blade damage state evaluation and classification process based on MFS was provided in Chapter 4. Finally, the experimental results verified that the proposed algorithm was effective.
It is difficult to obtain WTGS blade damage images, which leads to a small number of samples. At the same time, traditional data expansion methods do not have sufficient ability to enhance the feature space of samples. In order to generate a high quality sample set of blade damage images to improve the classification performance of the deep learning model, an improved DCGAN-based sample expansion method was proposed in this study. The damage images were first reduced dimensionally and cleaned using the sliding window method in order to improve the training effects of subsequent Generative Adversarial Networks (GAN). Then the activation function was optimized and improved to improve the diversity of WTGS blade damage features, thus generating a high quality image sample set. In addition, spectral normalization was introduced for weight standardization, which enhanced the network structure stability and reduced the vanishing or exploding gradient during model training. Finally, the improved Alexnet was used for feature extraction and classification identification of the expanded sample set, thus improving the damage identification accuracy of WTGS blades. The constructed network model generated a variety of WTGS blade damage images, which was conducive to improving the generalization ability of the model and reducing the overfitting risk, thus expanding the damage images, and being suitable for expanding the damage samples.
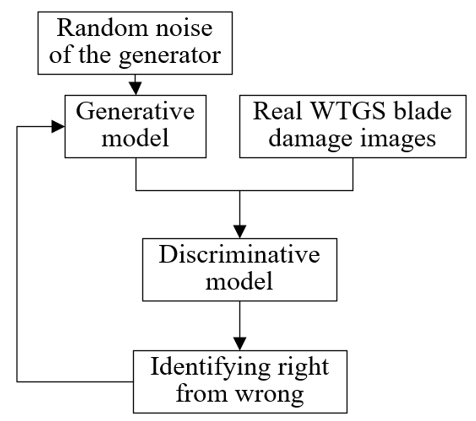
DCGAN added CNN on the basis of Generative Adversarial Networks (GAN). Figure 1 shows the basic structure of DCGAN. Let U(X,Z) be the cross entropy loss in the binary classification task, Yaupu(b) be the real data distribution, Yr(c) be the noise distribution, log(X(b) be the maximized training network X (the probability of correctly judging the data authenticity is maximized), and log(1-X(Z(c)) be the minimized training network Z (the loss function of discriminator X is maximized). The objective function expression was provided as follows:
$\min _Z \min _X U(X, Z)$$=F_{S \sim Y_{\text {aupu }}\,(x)}\left[\log (X(b)]+F_{G \sim Y_r(c)}[\log (1-X(c))]\right.$ (1)
Figure 1. Basic structure of DCGAN
Yr gradually converged to Yaupu during the training process, making the model tend to the Nash equilibrium state. DCGAN was used to generate new samples. The model training consisted of two parts: a generator and a discriminator, whose structure is shown in Figure 2. The loss function expression of the discriminator was given by the following formula:
$\min _X U(X, Z)$$=F_{S \sim Y_{\text {aupu }}\,(b)}\,\left[\log (X(b)]+F_{G \sim Y_r(c)}[\log (1-X(c))]\right.$ (2)
Figure 2. Structure of the generator and the discriminator
Parameters of the Z network were first fixed, and then parameters of the X network were optimized, which aimed to enable the discriminative network to obtain ideal discriminative ability. The expected discriminant results of real and generated samples approached 1 and 0, respectively. Similarly, the loss function expression of the generator was given by the following formula:
$\underset{Z}{\mathop{\min }}\,U\left( X,Z \right)=\left[ {{F}_{C\sim{{Y}_{c}}}}(C)\log (1-X(c))) \right]$ (3)
Sparsity of WTGS blade damage images led to the small proportion of damage targets in the entire image, making it difficult to manually extract features. Traditional feature extraction methods needed to consider all image information, while CNN was suitable for handling this problem because it had the characteristics of local perception and parameter sharing, which enabled CNN to learn local features of the image, and effectively extract the blade damage features. As the inverse process of CNN, deconvolution network mapped the low-dimensional feature space back to the high-dimensional image space, which generated sample images. Therefore, CNN was used to extract the blade damage features, and deconvolution network was used to generate damage sample images in this study. That is, samples were expanded based on the constructed DCGAN without manually designing the feature extractor, which was suitable for dealing with sparse targets like WTGS blade damage.
When traditional DCGAN was used to process WTGS blade damage images, the image sparsity easily led to several problems, such as vanishing gradient, and generation of unclear sample features. To address these problems, the traditional DCGAN was improved and a damage sample expansion method based on the improved DCGAN was proposed. Sliding window algorithm (SWA) was used, which effectively avoided the loss of target feature information when high-resolution blade damage images were input into the model, thus preserving key damage features. Activation function ReLU was replaced with SeLU to enrich the details of the generated blade damage images, which improved the quality of generated samples. Spectral normalization was introduced, which aimed to increase the stability of the training model, and reduce vanishing gradient and parametric oscillation, thus improving the training effects and identification accuracy of the model. Figure 3 shows the training model of DCGAN.
Due to the high resolution of WTGS blade damage images, use of high-resolution input images was limited by the network in the case of limited memory size. Although scaling alleviated the hardware limitations, image information was lost. Due to limited quantitative features occupied by blade damage targets, the number of pixels decreased along with the overall image scaling, making it difficult for the targets to be extracted and identified by the detection network. SWA, an image preprocessing method, was proposed to solve this problem. When processing a high-resolution input image, the subimage of the original image was used as the input image of the model, instead of scaling the original image. By sliding a fixed-size window on the original image, the image subregion in the window was used as the input to flexibly process blade damage images in various sizes, which improved the model’s adaptability and avoided the target information loss caused by image scaling, thus helping the target detection network extract and identify blade damage targets.
In SWA, a customized M*N fixed-size window was first used for sample data sliding slicing of bridge WTGS blade damage images. Let M and N be the width and height of the sliding window, Ob and Of be the upper left horizontal and vertical coordinates, Pb and Pf be the lower right horizontal and vertical coordinates, YSrm and YSrn be the width and height of the original WTGS blade damage image. The following formula provided the specific steps of the algorithm:
${{O}_{b}}=t*U,{{O}_{f}}=d*N$ (4)
${{P}_{x}}=\left( t+1 \right)*M,{{P}_{y}}=\left( d+1 \right)*N$ (5)
$t=YS{{r}_{m}}/M,d=YS{{r}_{n}}/N$ (6)
Activation function ReLU alleviated the vanishing gradient, improved the identification rate of the model, and reduced the network training time. However, it filtered the input less than 0, which may lead to the loss of some useful information. Activation function SeLU was used to solve this problem, because it automatically normalized the activation value to 0 average value and unit weight variance and provided rich features, instead of abandoning the part less than 0, which alleviated the vanishing gradient, helped the training of deep neural network, and was suitable for the sample expansion method of WTGS blade damage images. The formula was provided as follows:
$SeLU=\mu \left\{ \begin{align} & b,b>0 \\ & \gamma \left( {{e}^{b}}-1 \right),b\le 0 \\\end{align} \right.$ (7)
Mainly due to parametric oscillation in convolutional network, the traditional DCGAN had low stability during training, which was usually solved by restricting elements of the parameter matrix. However, this method may lead to instability of the parameter matrix. The core idea of spectral normalization was to divide each layer of network parameters by the spectral norm of the parameter matrix, which made the Lipschitz condition equal to 1. Therefore, the weight normalization technique of spectral normalization solved the above problem, and improved the stability of DCGAN during training. Spectral normalization of the parameter matrix limited the stretching degree of the input vector by the parameter matrix, thus reducing the risks of vanishing or exploding gradient. Let υ(J) be the second normal form of weight J, then the specific formula was provided as follows:
${{\bar{J}}_{SN}}(J):=\frac{J}{\upsilon (J)}$ (8)
Figure 3. Training model of DCGAN
Edge information in blade damage images reflected the contour and structural features of the damaged parts, which was of great significance for identifying and analyzing blade damage. However, the damage images in actual scenarios were often affected by noise and environmental factors, resulting in insufficient edge information. The edge enhancement method based on morphology was suitable for WTGS blade damage scenarios, because it was insensitive to noise, had a small amount of calculation, and overcame the noise impact by changing the size of structural elements and morphological scales. Compared with the traditional edge detection methods based on gradient or second derivative, the morphology-based edge enhancement method was not sensitive to noise, and was more suitable for processing blade damage images in actual scenes. At the same time, the morphology method had a small amount of calculation, which quickly processed images and improved the efficiency of damage identification and analysis. By changing the size of structural elements and morphological scales, the method flexibly coped with varying degrees of noises and environmental factors, and improved the reliability and accuracy of blade damage edge information.
Let k(b,f) be the input image grayscale function, h(b,f) be the given structural element, Xk and Xh be the definition domains of functions k(b,f) and h(b,f), then the grayscale expansion calculation formula of k(b,f) by h(b,f) was:
$\left( k\oplus h \right)\left( w,p \right)=\max \left\{ \begin{align} & k\left( w-b,p-f \right) \\ & +h(b,f)|(w-b), \\ & (p-f)\in {{X}_{k}};(b,f)\in {{X}_{h}} \\\end{align} \right\}$ (9)
The grayscale corrosion calculation formula of k(b,u) by h(b,u) was:
$\left( k\Theta h \right)\left( w,p \right)=\min \left\{ \begin{align} & k\left( w-b,p+f \right) \\ & -h(b,f)|(w+b), \\ & (p+f)\in {{X}_{k}};(b,f)\in {{X}_{h}} \\\end{align} \right\}$ (10)
Let Q(b,f) be the image edge function, then the expression of the edge detection operator of blade damage images, which was constructed based on morphological expansion, was provided as follows:
${{Q}_{a}}\left( b,f \right)=k\oplus h\left( b,f \right)-k\left( b,f \right)$ (11)
The expression of image edge detection operator, which was constructed based on morphological corrosion, was provided as follows:
${{Q}_{y}}\left( b,f \right)=k\left( b,f \right)-k\Theta h\left( b,f \right)$ (12)
The expression of the expansion corrosion type edge detection operator was provided as follows:
$Z\left( b,f \right)=\left( k\oplus h \right)-\left( k\Theta h \right)$ (13)
The edge detection algorithm of mathematical morphology only needed to multiply the corrosion (or expansion) operation results with itself, and the calculation process was simple and easy to implement, which realized rapid edge detection of damage images in practical applications, and improved the efficiency of damage identification and analysis. The algorithm made the image edge clearer through the multiplication, which was of great significance to the damage identification and analysis, because clear edge information helped extract damage features more accurately, thus improving the accuracy of damage detection.
WTGS blade damage images have complex textures and local changes, and traditional texture feature description methods are difficult to fully reveal their inherent laws. MFS describes the singularity distribution of images, which is suitable for describing such complex texture features. Various blade damage types and degrees require a method, which describes multi-scale and multi-level features, and MFS just meets this requirement. The MFS describes different local conditions in fractal structure using a set of infinite scaling exponents, which reflects the local texture features of images at multiple scales. Complex images are divided into many different small regions, with each region corresponding to a different singularity degree, which reveals the hierarchical and detailed features of images.
Combined with the real WTGS blade damage scenarios, the MFS image was obtained in the following steps:
1. Image preprocessing: the blade damage image was first preprocessed, such as denoising, gray processing, binarization and so on, for subsequent processing and analysis.
2. Calculation of the singularity exponent γ: the singularity exponent γ (holder exponent) of each pixel was calculated on the preprocessed image. Singularity exponent γ reflected the fractal dimension of certain small region in the image, and its numerical value reflected the growth probability of the small region.
3. Formation of a point set: pixels with the same singularity exponent γ were used as a point set, which represented the regions with similar texture features.
4. k(γ) calculation: the k(γ) value corresponding to each point set was calculated. k(γ) reflected the distribution of pixels with the same singularity exponent γ.
5. Constructing the MFS image: Steps 3 and 4 were repeated until all pixels with different singularity exponent γ were processed. These γ-k(γ) combinations were drawn into a MFS image, which revealed the different-scale texture feature distribution of blade damage images in different local conditions.
The MFS image of the WTGS blade damage image was obtained through the above steps. This image representation method helped reveal the texture features of damage regions at different scales and local conditions, thus providing valuable information for subsequent damage identification and analysis. Direct calculation method was used for MFS k(γ) and singularity exponent γ. Let gi(ε) be the probability of a pixel falling on the i-th box, h be the weight factor, and ∑j[gi(ε)]h be the sum of the h-th powers of the probabilities of all boxes, then the probability measure distribution was obtained by the following formula:
${{\nu }_{i}}\left( g,\varepsilon \right)={{{\left[ {{g}_{i}}\left( \varepsilon \right) \right]}^{h}}}/{\sum\limits_{j}{{{\left[ {{g}_{i}}\left( \varepsilon \right) \right]}^{h}}}}\;$ (14)
The value range of h was (-∞,+∞). When h was greater than 0, the subset with greater probability had a greater impact on fractal dimension. On the contrary, when h was less than 0, the subset with smaller probability had a greater impact on fractal dimension. Then the corresponding singularity exponent γ(h) was given by the following formula:
$\gamma \left( q \right)=\underset{\varepsilon \to 0}{\mathop{\lim }}\,\left\{ {\sum\limits_{j}{{{\nu }_{i}}\left( h,\varepsilon \right)\ln \left[ {{g}_{i}}\left( \varepsilon \right) \right]}}/{\ln \varepsilon }\; \right\}$ (15)
MFS k[γ(h)] was obtained by the following formula:
$k\left[ \gamma \left( h \right) \right]=\underset{\varepsilon \to 0}{\mathop{\lim }}\,\left\{ {\sum\limits_{j}{{{\nu }_{i}}\left( h,\varepsilon \right)\ln \left[ {{\nu }_{i}}\left( h,\varepsilon \right) \right]}}/{\ln \varepsilon }\; \right\}$ (16)
After selecting different h values and using them to calculate gi(ε) in the corresponding fractal space, the curves at different scales ε were drawn. The least square method was used to calculate the slope of the curve corresponding to the scale-free range in the graph, and the absolute values of γ(h) and k[γ(h)] equal to the slope under the given h-value condition.
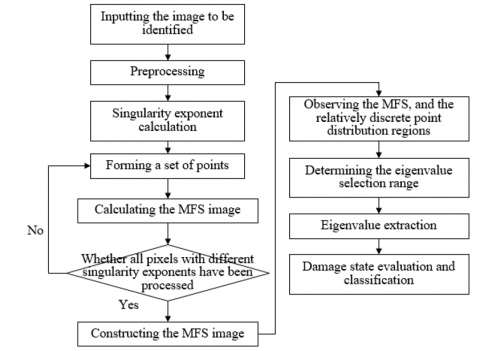
Figure 4. Damage state evaluation and classification process of WTGS blades
Figure 4 shows the damage state evaluation and identification process of WTGS blades. It can be seen from the figure that the MFS of blade images with different damage states has been analyzed through the following steps, and the eigenvalue of each damage stage image was obtained to complete the damage state evaluation and classification.
1. MFS observation: the MFS of blade images with different damage states obtained through calculation was observed, and the relatively discrete point distribution region was found. In the case used in this study, this region was within both the range of [3, 3.3] of singularity exponent γ(h), and the range of [0.35, 0.55] of MFS k[γ(h)].
2. Determining the eigenvalue selection range: a selection range was determined for the average eigenvalue points of each damage stage. Abscissa ±0.1 and ordinate ±0.25 were taken in this study, which were able to cover representative eigenvalue points.
3. Eigenvalue extraction: representative eigenvalue points within the selection range were found. If there was only one point within the range, then its singularity exponent γ and MFS k(γ) represented the image eigenvalue. If there were multiple points within the range, the averages of the abscissas and ordinates of these points were taken as the eigenvalue representing the image.
4. State evaluation and classification: the eigenvalue extracted through analysis was used to evaluate and classify the blade damage state. Images with similar eigenvalues may have similar damage states. These eigenvalues were used to train classifiers and then automatically identify and classify the blade damage states.
The eigenvalues of blade damage stages were extracted from the MFS through these steps, and were used to evaluate and classify the damage states, which helped improve the accuracy of WTGS blade damage identification, thus achieving more effective maintenance and management.
Based on the details of generative and discriminative networks of DCGAN in Tables 1 and 2, the construction features of the DCGAN of blade damage identification were summarized. In the generative network, SeLU (linear rectification unit with scalability index) activation function was used to adaptively adjust the scale and translation of the output features, which improved the quality of the generated image. Convolution kernels (e.g., 3×3 and 5×5) and step sizes (e.g., 1, 5, 3, and 2) of different sizes were used to capture and generate multi-scale features. Spectral normalization was used in multiple convolutional layers (Conv1, Conv2, Conv3, and Conv4) to improve the stability of network training. In the discriminative network, LeakyReLU (linear rectification unit with leakage) activation function was used to alleviate the vanishing gradient problem and improve network performance. Convolution kernels (e.g., 3×3 and 5×5) and step sizes (e.g., 1, 8, 5, 3, and 6) of different sizes were used for capturing of different-scale features and downsampling, thus reducing the amount of calculation. Spectral normalization was used in multiple convolutional layers (Conv1, Conv2, Conv3, and Conv4) to improve model stability, and solve the parameter oscillation problem, thus making the network training more stable.
Table 1. Generative network details of DCGAN
|
Network layer |
Convolution kernel |
Step size |
Activation function |
Whether spectral normalization existed |
|
Input layer |
5×5 |
1 |
SeLU |
No |
|
Conv1 |
3×3 |
5 |
SeLU |
Yes |
|
Conv2 |
5×5 |
3 |
SeLU |
Yes |
|
Conv3 |
3×3 |
2 |
SeLU |
Yes |
|
Conv4 |
3×3 |
4 |
SeLU |
Yes |
|
Input layer |
3×3 |
2 |
tanh |
No |
Table 2. Discriminative network details of DCGAN
|
Network layer |
Convolution kernel |
Step size |
Activation function |
Whether spectral normalization existed |
|
Input layer |
3×3 |
1 |
LeakyRelu |
No |
|
Conv1 |
3×3 |
8 |
LeakyRelu |
Yes |
|
Conv2 |
3×3 |
5 |
LeakyRelu |
Yes |
|
Conv3 |
3×3 |
3 |
LeakyRelu |
Yes |
|
Conv4 |
5×5 |
6 |
LeakyRelu |
Yes |
|
Input layer |
3×3 |
5 |
LeakyRelu |
No |
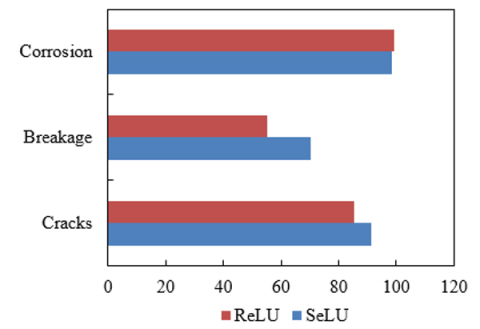
Figure 5. Damage identification rates of different activation functions
According to the damage identification rate data of different activation functions given in Figure 5, it can be seen that the identification rate using activation function SeLU is better than that using ReLU in the three damage types of cracks, breakage and corrosion. Specifically, the identification rate of crack damage using SeLU is 91.25%, while that using ReLU is 85.47%, indicating that SeLU has significantly improved crack identification compared with ReLU. The identification rate of breakage damage using SeLU is 70.36%, while that using ReLU is 55.38%, indicating SeLU has significantly improved in breakage identification compared with ReLU. The identification rate of corrosion damage using SeLU is 98.58%, while that using ReLU is 99.36%. Although the identification rate of corrosion damage using ReLU is slightly higher than that using SeLU, the difference is very small. After comprehensively analyzing the identification rates of these three damage types, it was concluded that use of activation function SeLU achieved a higher identification rate in the WTGS blade damage identification task compared with ReLU, which verified the effectiveness of using SeLU. The SeLU activation function adaptively adjusted the scale and translation of the output features, which helped improve the network performance and increased the damage identification rate.
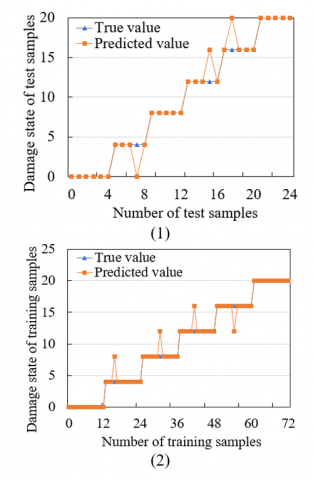
Figure 6 shows the damage state identification and classification results of WTGS blades. It can be observed that the classification results have shown good overall performance as the number of test samples increases. When the number of test samples is 0, all predicted values are 0, indicating that the model has not learned any effective feature information and cannot effectively classify the damage states. When the number of test samples is 4, the model has good performance in the classification of damage states 4 and 8, but there is an error prediction of state 0 in one sample of damage state 4. When the number of test samples is 8, the model performs well in the classification of damage states 4, 8, and 12, but there is an error prediction of state 16 in one sample of damage state 12. When the number of test samples was 12, 16, 20, and 24, respectively, the model has shown a certain degree of confusion in the classification of damage states 16 and 20, but the overall performance is still good.
Figure 6. Damage state identification and classification results of WTGS blades
After comprehensively analyzing the classification results of blade damage states with different training sample sizes, it was concluded that the overall classification results showed good performance as the number of test samples increased. Overall, the method of expanding WTGS blade damage samples helped improve the classification accuracy of the model.
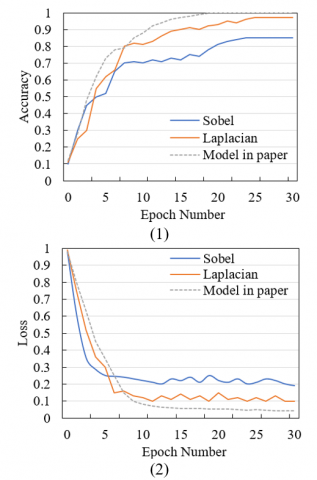
Figure 7. Accuracy and loss curves of different edge detection algorithms
Figure 7 shows the accuracy and loss curves of different edge detection algorithms. The identification accuracies of the Sobel and Laplacian algorithms, and the model in this study with different thresholds can be observed. When the threshold is low (0-15), the identification accuracy of the Sobel algorithm gradually increases, but the growth is relatively slow. When the threshold is high (15-30), its identification accuracy shows a rapid upward trend, and ultimately reaches an accuracy of 0.85. The identification accuracy of the Laplacian algorithm increases rapidly in the low threshold (0-10), continues to increase in the high threshold (10-30) with a slow growth rate, and ultimately achieves an accuracy of 0.97. The identification accuracy of the model in this study shows a rapid upward trend throughout the entire threshold range, and reaches a very high accuracy of 0.995 after the threshold of 15, almost approaching perfect identification. The loss value of the Sobel algorithm is high in the low threshold (0-5), gradually decreases with a relatively slow decline rate as the threshold increases, and remains within the range from 0.19 to 0.98 throughout the entire threshold range. The loss value of the Laplacian algorithm is high in the low threshold (0-5), then rapidly decreases throughout the entire threshold range, and remains at a low level (0.1-0.3) in the high threshold (10-30). The loss value of the model in this study generally shows a rapid downward trend within the entire threshold range, and drops to a lower level (0.041-0.15) in the high threshold (15-30). After comprehensively analyzing the identification accuracies of various edge detection algorithms, it was concluded that the identification accuracy of the model in this study was generally higher than that of the Sobel and Laplacian algorithms with different thresholds, and was close to perfect especially at a higher threshold. In addition, the loss values of the model in this study at different thresholds were generally lower than that of the Sobel and Laplacian algorithms, indicating that the model proposed in this study had high performance and superiority in the WTGS blade damage identification task. In contrast, the Sobel and Laplacian algorithms had lower identification accuracies and higher loss values, which may not meet practical application requirements in some cases.
Both Sobel and Laplacian algorithms were edge detection-based methods, which were sensitive to light and noise and were prone to false detection and misdetection. Table 3 shows the classification and identification results of different edge detection algorithms. According to the table, the accuracy of the algorithm in this study is 97.48% in the train set and 95.68% in the test set, which are superior to that of Sobel and Laplacian algorithms, and the loss value in the train and test sets is 0.058 and 0.174, respectively, which are low, indicating that the algorithm proposed in this study has high performance and superiority in WTGS blade damage identification task. In contrast, the Sobel and Laplacian algorithms have relatively low performance and cannot meet practical application requirements in some cases.
Table 3. Classification and identification results of different edge detection algorithms
|
Network type |
Accuracy (%) |
Loss value |
||
|
Train set |
Test set |
Train set |
Test set |
|
|
Sobel |
85.24 |
88.16 |
0.151 |
0.184 |
|
Laplacian |
93.62 |
81.27 |
0.136 |
0.136 |
|
Algorithm in this study |
97.48 |
95.68 |
0.058 |
0.174 |
Table 4. Objective evaluation index results of different identification models
|
Method |
Evaluation index (unit: dB) |
|||||
|
PSNR |
SSIM |
Edge retention |
RMSE |
Average gradient |
EME |
|
|
Canny |
41.02 |
0.51 |
7.14 |
72.41 |
11.63 |
25.18 |
|
GLCM |
46.39 |
0.69 |
7.69 |
43.62 |
18.57 |
27.61 |
|
LBP |
48.52 |
0.73 |
6.15 |
38.19 |
8.26 |
19.58 |
|
CNN |
41.25 |
0.68 |
6.38 |
35.52 |
11.58 |
13.52 |
|
GAN |
48.37 |
0.64 |
6.27 |
31.24 |
16.95 |
24.17 |
|
Model in this study |
46.15 |
0.75 |
7.78 |
27.19 |
17.31 |
35.68 |
Table 4 presents the objective evaluation index results of different identification models. Based on the data in the table, the performance of the Canny, Gray Level Co-occurrence Matrix (GLCM), Local Binary Pattern (LBP), CNN, and GAN algorithms, and the model in this study in various objective evaluation indexes can be observed. The model in this study (46.15 dB) and the LBP algorithm (48.52 dB) perform well in the Peak Signal to Noise Ratio (PSNR) index, indicating that these two methods have good performance in image quality restoration. The model in this study has the highest score (0.75) in the Structural Similarity (SSIM) index, indicating that the model performs best in maintaining image structural similarity. The model in this study (7.78) performs best in terms of edge retention and Root Mean Square Error (RMSE) indexes, indicating that the model has good performance in error control. The GLCM algorithm (18.57) performs best in terms of average gradient, and the model in this study ranks second (17.31). The model in this study has the highest score (35.68) in the Enhancement Measure Evaluation (EME) index, indicating that the model performs best in edge enhancement.
By comprehensively analyzing the objective evaluation index results of each identification model, it was concluded that the model in this study performed well in multiple objective evaluation indexes (e.g., SSIM and EME), and also had good performance in other indexes, indicating that the model proposed in this study had high performance and superiority in the WTGS blade damage identification task. At the same time, the LBP and GLCM algorithms also performed well in certain indexes, but their performance in other indexes was slightly inferior to the model in this study. In contrast, the performance of the Canny, CNN, and GAN algorithms was relatively low.
This research studied the damage identification method of WTGS blades based on image processing technology. A method for expanding blade damage samples based on the improved DCGAN was first proposed, which generated a high quality damage image sample set to improve the classification performance of the deep learning model. For the problem of WTGS blade damage images often affected by noise and environmental factors in practical scenarios, it was solved by the morphology-based blade damage edge enhancement. In addition, the MFS-based blade damage state evaluation and classification process was provided. Combined with experiments, the details of the generative and discriminative networks of DCGAN were provided, and the construction features of DCGAN of blade damage identification were summarized. According to the damage identification rate data of given different activation functions, it was verified that the identification rate using activation function SeLU was better than that using ReLU in the three damage types of cracks, breakage and corrosion. The identification and classification results of blade damage states were provided, verifying that the method of expanding WTGS blade damage samples improved the classification accuracy of the model. Then the accuracy and loss curves of different edge detection algorithms were given, indicating that the identification accuracy of the model in this study was generally higher than that of the Sobel and Laplacian algorithms at different thresholds, and was close to perfect especially at a higher threshold. In addition, the objective evaluation index results of different identification models were provided, indicating that the model in this study performed well in multiple objective evaluation indexes (e.g., SSIM and EME), and also had good performance in other indexes, verifying that the model had high performance and superiority in the WTGS blade damage identification task.
This work was supported by the Project of Jilin Provincial Science and Technology Department (Grant No.: 20210402081GH); the Project of Jilin Provincial Development and Reform Commission (Grant No.:2023C042-4); and the Innovation and Entrepreneurship Talent Funding Project of Jilin Province (Grant No.: 2023RY17).
[1] Lamei, A., Hayatdavoodi, M., Riggs, H.R. (2023). Motion and elastic response of wind-tracing floating offshore wind turbines. Journal of Ocean Engineering and Marine Energy, 9(1): 43-67. https://doi.org/10.1007/s40722-022-00250-1
[2] Dangi, N.S., Nikam, S.R. (2023). Design and CFD analysis of multi rotor wind turbines. In Fluid Mechanics and Fluid Power (Vol. 1), Pilani, India, pp. 1-6. https://doi.org/10.1007/978-981-19-7055-9_1
[3] Lipian, M., Dobrev, I., Massouh, F., Jozwik, K. (2020). Small wind turbine augmentation: Numerical investigations of shrouded-and twin-rotor wind turbines. Energy, 201: 117588. https://doi.org/10.1016/j.energy.2020.117588
[4] Shiraz, M.Z., Dilimulati, A., Paraschivoiu, M. (2020). Wind power potential assessment of roof mounted wind turbines in cities. Sustainable Cities and Society, 53: 101905. https://doi.org/10.1016/j.scs.2019.101905
[5] Deng, X., Wu, L., Wang, X., Li, Y. (2023). An equivalent method of wind farms considering correlation difference of wind turbines in different time periods. In The Proceedings of the 17th Annual Conference of China Electrotechnical Society: Volume II, Beijing, China, pp. 190-199. https://doi.org/10.1007/978-981-99-0451-8_19
[6] Pereira, S., Pacheco, J., Pimenta, F., Moutinho, C., Cunha, Á., Magalhães, F. (2023). Contributions for enhanced tracking of (onshore) wind turbines modal parameters. Engineering Structures, 274: 115120. https://doi.org/10.1016/j.engstruct.2022.115120
[7] Zoucha, J., Crespo, C., Wolf, H., Aboy, M. (2023). Review of recent patents on vertical-axis wind turbines (VAWTs). Recent Patents on Engineering, 17(4): 3-15. https://doi.org/10.2174/1872212117666220829143132
[8] Cai, W., Hu, Y., Fang, F., Yao, L., Liu, J. (2023). Wind farm power production and fatigue load optimization based on dynamic partitioning and wake redirection of wind turbines. Applied Energy, 339: 121000. https://doi.org/10.1016/j.apenergy.2023.121000
[9] Zhang, Y., Zhang, X. (2020). Statistic analysis of lightning transients on wind turbines. Journal of Renewable and Sustainable Energy, 12(6): 063302. https://doi.org/10.1063/5.0031506
[10] Chen, W., Liu, H., Lin, Y., Li, W., Sun, Y., Zhang, D. (2020). LSTM-NN yaw control of wind turbines based on upstream wind information. Energies, 13(6): 1482. https://doi.org/10.3390/en13061482
[11] Zhao, X., Zhou, P., Liang, X., Gao, S. (2020). The aerodynamic coupling design and wind tunnel test of contra-rotating wind turbines. Renewable Energy, 146: 1-8. https://doi.org/10.1016/j.renene.2019.06.118
[12] Papi, F., Cappugi, L., Salvadori, S., Carnevale, M., & Bianchini, A. (2020). Uncertainty quantification of the effects of blade damage on the actual energy production of modern wind turbines. Energies, 13(15): 3785. https://doi.org/10.3390/en13153785
[13] Gao, F., Wu, X., Liu, Q., Liu, J., Yang, X. (2019). Fault simulation and online diagnosis of blade damage of large-scale wind turbines. Energies, 12(3): 522. https://doi.org/10.3390/en12030522
[14] Qadri, B.A., Ulriksen, M. D., Damkilde, L., Tcherniak, D. (2020). Cointegration for detecting structural blade damage in an operating wind turbine: An experimental study. In Dynamics of Civil Structures, Volume 2: Proceedings of the 37th IMAC, A Conference and Exposition on Structural Dynamics 2019, pp. 173-180. https://doi.org/10.1007/978-3-030-12115-0_23
[15] Chen, B., Yu, S., Yu, Y., Zhou, Y. (2020). Acoustical damage detection of wind turbine blade using the improved incremental support vector data description. Renewable Energy, 156: 548-557. https://doi.org/10.1016/j.renene.2020.04.096
[16] Ingersoll, B., Ning, A. (2020). Efficient incorporation of fatigue damage constraints in wind turbine blade optimization. Wind Energy, 23(4): 1063-1076. https://doi.org/10.1002/we.2473
[17] Ullah, H., Ullah, B., Silberschmidt, V.V. (2020). Structural integrity analysis and damage assessment of a long composite wind turbine blade under extreme loading. Composite Structures, 246: 112426. https://doi.org/10.1016/j.compstruct.2020.112426
[18] Liu, P., Xu, D., Li, J., et al. (2020). Damage mode identification of composite wind turbine blade under accelerated fatigue loads using acoustic emission and machine learning. Structural Health Monitoring, 19(4): 1092-1103. https://doi.org/10.1177/1475921719878259
[19] Xu, D., Liu, P.F., Chen, Z.P., Leng, J.X., Jiao, L. (2020). Achieving robust damage mode identification of adhesive composite joints for wind turbine blade using acoustic emission and machine learning. Composite Structures, 236: 111840. https://doi.org/10.1016/j.compstruct.2019.111840
[20] Yang, X., Zhang, Y., Lv, W., Wang, D. (2021). Image recognition of wind turbine blade damage based on a deep learning model with transfer learning and an ensemble learning classifier. Renewable Energy, 163: 386-397. https://doi.org/10.1016/j.renene.2020.08.125
[21] Hu, B., Li, W., Song, C., Yuan, K., Zhao, F., Wei, D. (2020). Surface damage detection method for blade of wind turbine based on image segmentation. In 2020 5th International Conference on Communication, Image and Signal Processing (CCISP), Chengdu, China, pp. 154-158. https://doi.org/10.1109/CCISP51026.2020.9273461
[22] Lv, L., Yao, Z., Wang, E., Ren, X., Pang, R., Wang, H., Zhang, Y., Wu, H. (2022). Efficient and accurate damage detector for wind turbine blade images. IEEE Access, 10: 123378-123386. https://doi.org/10.1109/ACCESS.2022.3224446
[23] Peng, Y., Wang, W., Tang, Z., Cao, G., Zhou, S. (2022). Non-uniform illumination image enhancement for surface damage detection of wind turbine blades. Mechanical Systems and Signal Processing, 170: 108797. https://doi.org/10.1016/j.ymssp.2021.108797