Srikanth Cherukuvada![]() | R. Kayalvizhi*
| R. Kayalvizhi*![]()
© 2023 IIETA. This article is published by IIETA and is licensed under the CC BY 4.0 license (http://creativecommons.org/licenses/by/4.0/).
OPEN ACCESS
Approximately 50 million people worldwide suffer from Epileptic Seizure (ES), a persistent neurological disorder that cannot spread from person to person. Electroencephalography (EEG) is a tool that is often used to identify and diagnose epilepsy by observing how the brain works. However, analyzing EEG recordings to identify epileptic activity can be difficult, time-consuming, and requires specialist expertise. However, a precise and early diagnosis of epilepsy is necessary to start anti-seizure medication treatment and reduce the risk of consequences from recurrent episodes. In this paper, a modified Gorilla Troops Optimization with a Deep Learning based ES Prediction model (MGTODL-ESP) using EEG signals is implemented. The proposed MGTODL-ESP model comprises two main processes: feature selection and prediction. The MGTODL-ESP model uses a modified gorilla troops optimization (MGTO) based feature selection algorithm to select the optimal subset of features. The MGTO-based Gated Recurrent Unit (GRU) model predicts different types of ES. Finally, the Grey Wolf Optimizer (GWO) algorithm was used to tune the parameters of the MGTODL model. The outline of the MGTO-ESP-based feature selection and Grey Wolf Optimizer (GWO)-based parameter tuning indicates the novelty of this research. A comprehensive empirical study was conducted using a benchmark CHB-MIT scalp EEG database from IEEE DataPort to investigate the improved prediction performance of the MGTODL-ESP model. A comparison of the different methods showed that the MGTODL-ESP approach was the most accurate, with an accuracy rate of 98.50%.
biomedical data, EEG signals, seizure prediction, feature selection, deep learning
Epilepsy is a common neurological condition categorized by ES and ranks second among common neurological disorders after stroke, as per a report by the World Health Organization (WHO) [1]. Seizures can occur irrespective of the host attributes or circumstances. Patients affected by epilepsy suffer from unforeseen and sudden seizures; at the time, they cannot safeguard themselves and are susceptible to injury, suffocation, or death due to traffic accidents and fainting [2]. However, this disease can be treated with surgery and medications, no cure exists, and treatments with anticonvulsants are ineffective for different epilepsy types [3]. EEG plays a significant role in epilepsy identification because it measures variances in voltage changes among electrodes on the subject's scalp by sensing ionic current flows within brain neurons and offers spatial and temporal data regarding the brain [4]. Detection using EEG requires direct investigation by a doctor, along with a significant amount of effort and time [5]. Additionally, specialists with different levels of diagnostic experience occasionally have contradictory views on diagnostic outcomes [6]. Thus, developing an automated computer-aided technique for detecting epilepsy is urgently required. Several seizure-predictive studies divide successive epileptic EEG signals into three states: ictal (period of seizure), interictal (interval among seizures), and preictal (before seizure onset). Generally, ES prediction refers to a binary classifier that differentiates between interictal and preictal [7]. Over the decade’s, numerous advanced techniques have been modeled in ES estimation. Conventionally, EEG-related SP techniques focus on classification and feature extraction [8]. The authors manually framed the discriminatory features of EEG signals, like time-frequency domain, and time–frequency domain features [9]. DL, which derives discriminatory features automatically, is widely employed. In addition, the utility of neural networks (NNs) and DL methods in expanding computer methods for disease recognition, disease detection, and many other fields has attracted the attention of many researchers [10].
The adverse effect upon quality of life caused by chronic seizures is substantial. Epilepsy accounts for more than 0.5% of the global illness burden, based on the number of years lost by persons owing to early death and years spent in suboptimal health. The costs associated with treating epilepsy, avoiding premature mortality, and losing time at work add to a sizable sum over time. According to a cost-benefit analysis conducted in India, funding for primary and secondary treatments and other medical expenses can alleviate some of the financial strain caused by epilepsy. Managing epilepsy may be more difficult than dealing with the seizures themselves because of the widespread discrimination and stigma. Individuals with epilepsy may be targets of discrimination. As a result of the negative implications of the disease, some people may be reluctant to seek help. It is anticipated that by 2050, the population of persons aged 65 years and over would have increased from 461 million to 2 billion. There will be significant consequences in the fields of social and medical healthcare because of this massive increase. Home Adaptive Response (HAR) is a powerful tool for tracking the physiological, psychosocial, and mental status of the elderly in their environments [11, 12].
During the first autonomous diagnosis, the systems achieved 76–90% accuracy, with a false detection rate of 1%–0.7% per hour. Therefore, developing methods with low computational costs is crucial. Because there is a large amount of information in an individual's EEG recording, it is vital to develop tools to oversee classification and feature selection procedures. Approaches to predicting seizures have certain limitations, including those described below.
The problem of declining classification accuracy in SP systems has been the subject of several research studies. Because patients' EEG recordings will show seizures in different places and at different intensities, most SP algorithms must be tailored to each user. Traditional SP methods include signal pre-processing, feature selection, and classification [13-16].
1.1 Motivation
The development of DL over the last several years has increased the use of DL to diagnose epilepsy. When it comes to feature engineering, DL algorithms do not require a time-consuming human feature design procedure and have the potential to provide better outcomes than traditional methods. On the other hand, automated EEG data analysis can improve patient care by reducing the time that diagnostics take and the amount of human error that occurs. The focus of this research is on one of the first steps involved in identifying whether a person's brain activity is typical or abnormal, which is the starting point for EEG interpretation. Analyzing the signals produced by the frontal lobes is a potential method for diagnosing seizure disorders.
The driving force behind this work is to enhance the precision and efficiency of forecasting seizures using EEG signals. The present method is arduous and requires specialized knowledge, but an accurate and early diagnosis is critical for proper treatment. The MGTODL-ESP model aims to tackle these obstacles by incorporating a changed optimization algorithm and deep learning techniques. The proposed work demonstrate that the MGTODL-ESP approach yields the highest accuracy with a rate of 98.50%. Thus, this work aims to improve the existing techniques for predicting seizures and develop a model that is more accurate and efficient, thereby improving the standard of living for those who suffer from epilepsy.
Researchers are now facing several obstacles while attempting to identify seizures experienced by epileptic patients using brain imaging techniques and DL approaches.
1.2 Research objectives
This research study presented a model of EEG-based approach for forecasting ES, named “Modified Gorilla Troops Optimization with Deep Learning," was discussed in this work (MGTODL-ESP). The primary objective of the MGTODL-ESP method is to categorise across various kinds of seizures. The initial step in preprocessing the EEG data was a Z-score normalisation. The optimal characteristics were chosen using the MGTO technique. In order to forecast seizures, the grey wolf optimizer (GWO) was combined with the gated recurrent unit (GRU) framework. The GRU hyperparameters may be optimised with the support of the GWO approach.
The remaining sections of this work are arranged as follows: The current techniques for predicting seizures, as well as the drawbacks of such approaches, are discussed in Section 2. Section 3 provides a thorough explanation of the methodology proposed for the SP model. Section 4 contains the proposed SP model's results, discussion, and performance evaluation. The research is concluded in Section 5.
As time has progressed, DL methods have become increasingly important in a variety of fields. Numerous methods have been developed by earlier studies, even in the realm of EEG signal analysis. This paper discusses the current DL methods being utilised for SP.
Bhandari and Huchaiah [11] formulated new seizure recognition in EEG signals utilizing novel extracting feature and classifier methods. The early phase of the presented technique was signal preprocessing. With this selective feature, a development was presented with weighted feature selecting method, whereas the weighted can be maximized by hybrid metaheuristic techniques termed Jaya-Cat Swarm Optimized (J-CSO). After, J-CSO-related heuristically Improved ELM (I-ELM) was presented in the detection stage, which was modelled by 3 distinct methods such as LSTM, Fuzzy classifier, and DNN. Escorcia-Gutierrez et al. [12] proposes Automatic DL-Enabled Brain Signal Classification for Epileptic Seizure Detection (ADLBSC-ESD). Furthermore, this approach includes the model of Improved TLBO (ITLBO) approach for choosing features in EEG signals. Likewise, the DBN method was leveraged for classifying the EEG signals effectively, and hyperparameters of DBN technique were fine-tuned utilizing Swallow Swarm Optimization Algorithm (SSA).
A new seizure detection technique related to the deep bidirectional LSTM (Bi-LSTM) network was modelled in the study [13]. To conserve the non-stationary nature of EEG signals when declining computing burden, statistical feature extraction, and the local mean decomposition (LMD) process were presented. The deep architecture was then devised by integrating 2 independent LSTM networks including opposite propagation directions one sends data from back to front, and another from front to back. In the study [14], a devised new epileptic seizure detection technique was with integration of empirical mode decomposition, mutual information-related optimal individual feature (MIBIF) selective method, and MLP-NN. Firstly, fixed length EEG epochs were decomposed as to amplitude and frequency-modulated elements named intrinsic mode function (IMF). Glory et al. [15] presented a new DL method for epileptic seizure recognition that hybridizes Adaptive Haar Wavelet-oriented Binary GOA and DNN (AHW-BGOA-DNN).
Choi et al. [16] devised a multi-scale 3D-CNN including DNN method for non-patient-specific seizure recognition. The author takes temporal, spectral, and spatial features into account. The EEG signals were transmitted to frequency domain utilizing Short Time Fourier Transform (STFT) for extracting spectral attributes. The spectral attributes were mapped to 2-D images for preserving electrode's position. The presented method has bidirectional GRU and 3D-CNN for extracting temporal and spatial features from 2D mapped images. Singh and Malhotra [17] presented a method of automatic epileptic seizure recognition method utilizing Stacked AE (SAE) related DL method, which is an advanced form of ML, used for effectively managing the issue of big data with reduced processing time and complexity to make this procedure realtime compatible with minimal delays. After, such EEG segments were given to SAE for classifying into distinct epileptic seizure levels such as ictal, normal, and preictal. Abdelhameed and Bayoumi [18] introduce a new DL technique for identifying seizures in pediatric patients based on the categorization of raw multichannel EEG signal recordings with little pre-processing. This innovative method uses the automated feature learning capabilities of a two-dimensional deep convolution autoencoder (2D-DCAE) connected to a neural network-based classifier to construct a unified system. This system is trained in a supervised manner to obtain the highest possible accuracy rate between the ictal and interictal brain state signals.
Sari´c et al. [19] designed an FPGA-based approach for generalized and localized ES categorization utilizing a feed-forward multilayer neural network framework (MLP ANN). Aileni et al. [20] offered many features of diagnosing ES utilising EEG signal classification with supervised learning methods. This work showed the relevant learning techniques that are associated with those provided features. A methodology using support vector machine (SVM) has been applied to identify ES. In the context of supervised learning, a classifier known as SVM is officially described as an algorithm whose outputs indicate an ideal separation hyperplane based on training data. hyperplane. Almustafa et al. [21] outperforms several methods of categorization and these methods are applied to a dataset including information about ES in this work. These results showed that the random forest approach (with 97.08% accuracy, ROC = 0.996, and RMSE = 0.1527) was superior to the k-nearest neighbours (K-NN), naïve Bayes (NB), Logistic Regression (LR), Decision Tree (D.T.), Random Tree (RT), J48, and Stochastic Gradient Descent (S-G-D) models. Gao et al. [22] had made certain tweaks to the conventional network topology, ResNet can solve the gradient vanishing issue that arises during the training of DCNN. This central aspect is a concept for a simplified version of the fundamental building component of networks called residual blocks and improved to GoogLeNet’s infrastructure, which has allowed Inception-v3 far more robust architectural foundation. To minimize operational complexity and increase nonlinear feature representation, large convolution kernels are divided into smaller convolution kernels in Inception-v3.
The majority of the aforementioned approaches have drawbacks, such as a lack of data, which are addressed in this study using a standard dataset. It is also worth noting that these methods did not use optimization techniques to obtain the best possible answer. In contrast, in this study, the parameters were optimized using modified Gorilla troop optimization. The aforementioned approaches were all computationally intensive and time consuming; however, the suggested method optimized the classifier to lower the runtime of the latter. The use of EEG data for SP and classification has been the subject of several published classification studies. Although ML and DL models in the literature may enhance the prediction accuracy, more work has to be done in this area. Overfitting occurs in DL models when the number of parameters increases rapidly, owing to the relentless deepening of the model. However, the performance of the GRU model is highly sensitive to several hyperparameters. In particular, choosing appropriate hyperparameters, such as the epoch count, batch size, and learning rate, is crucial for a successful conclusion. Metaheuristic algorithms may be used instead of the time-consuming and sometimes incorrect trial-and-error approach for hyperparameter tuning. Therefore, in this study, a Greywolf optimizer (GWO) method was used to fine-tune the GRU model parameters.
This paper presents a model for predicting different kinds of epileptic seizures based on EEG signals called Modified Gorilla Troops Optimization with DL (MGTODL-ESP). An MGTO-based feature selection is developed in the proposed MGTODL-ESP concept to choose the best possible subsets of features. For further ES prediction, a GRU-based classifier was developed. The Grey wolf optimizer is also used for fine-tuning GRU model parameters (GWO). The MGTODL-ESP model that has been suggested is described here. This model includes data preprocessing, MGTO-based feature selection, GRU-based classification, and GWO-based parameter adjustment. According to our information, the MGTODL-ESP concept has not before been published. The originality of this work is shown by the methods used to pick features using MGTO and tune parameters using GWO. The MGTODL-ESP model was validated using the standard CHB-MIT Scalp EEG dataset.
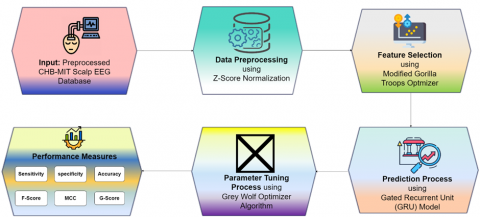
In this proposed work an effective feature selection model using a DL-based ES prediction method called the MGTODL-ESP model was created to use EEG signals to predict different types of seizures. As shown in the MGTODL-ESP technique, there are four main steps: data preprocessing, MGTO-based selective feature selection, GRU classification, and GWO-based hyperparameter optimization. A block diagram of the MGTODL-ESP system is shown in Figure 1.
Figure 1. Block diagram of proposed MGTODL-ESP approach
3.1 Data pre-processing
Initially, the presented OAOFS-DBNECD methodology converts the EEG signals into .csv format to make it appropriate to more processing. Then, the pre-processing of the EEG signals was carried out with the use of Z-score normalization [23]. It can be defined as the process of acquiring ranges of input data or normalized values from unstructured data through concepts such as standard deviation and mean. This can be established by dividing presented data of every data instance by standard deviation of all gates, as in equation, and subtracted mean of all data instances from that value. Equation was employed for mapping the values of transformed input among the target range [x, y].
$A_{Z a(t)}=\frac{A(t)-A_j(t)}{A_j(t)}$ (1)
$A_{z a d(t)}=c+\frac{(d-c)\left(A_{z s}\quad(t)-A_{z s \min\quad }\right)}{A_{z s \max }\quad-\quad A_{z s \min }}$ (2)
The scaling values of z‐score normalized field $A_{Z a(t)}$ were shown here as $A_{Z a d(\mathrm{t})} \cdot A_i(t)$ and $A_j(t)$, which are computed from the trained data sets, denoted the standard deviation and mean at each gate time $t$, where $A_{Z \max }$ and $A_{Z S_{\min }}$ were absolute final and initial gate values noted for all provided gate periods in test datasets.
3.2 Feature selection
Feature selection refers to the process of narrowing down a large pool of potential features (predictive variables) to a manageable number. As a result of this process, the model should be more accurate and interpretable, with less overfitting and more efficient computing. Several methods exist to accomplish this goal, including dimensionality reduction, feature importance calculation, and correlation analysis.
Here once the preprocessing stage is completed, then implementing a method called feature section. In this stage, reduction of features takes place and it also makes an attempt to forecast which characteristics are more significant and relevant to our proposed model.
3.2.1 Steps involved in MGTO based feature selection
The MGTO (Modified Gorilla Troops Optimization) algorithm was used to select the best features. Gorilla troop optimization (GTO) is a technique based on swarms. It was inspired by the social life of the gorilla, which was the biggest primate on Earth [24]. There are two parts of this method: exploitation and exploration. Five different operators attempt to copy the optimization function for a gorilla's behavior. During the exploration phase, there were 3 operators: moving to a known position, moving to a new position, and moving to other gorillas. During the exploitation phase, the search was run by two operators who tracked the silverbacks and competed for adult females.
Silverback is in charge of a group of gorillas and he can do everything. Gorillas sometimes go to places in nature that are new to them, or that they have been to before. In each step of the optimization process, the best candidate solution was called a "silverback solution.” Eq. (3) is used to represent the three strategies in the exploration phase, where $p$ refers to the variable within [0,1] and is applied to choose the migration strategy for an unknown position. if rand<p, the algorithm for migration to an unknown location is selected. While p is a variable in the range [0,1] used to determine the best migration technique for a location whose exact coordinates are uncertain. if rand<p, the algorithm for migration to an unknown location would be selected. Next, when rand≥0.5, the next model, that of movement towards remaining gorillas, would be chosen. The algorithm for migration to a known location is preferred when rand<0.5,
$\begin{aligned} & G X(t+1) = \begin{cases}(U B-L B) \times r_1+L B & \text { rand }<p \\ \left(r_2-C\right) \times X_r(t)+L \times H & \text { rand } \geq 0.5 \\ X(i)-L \times\left(L \times\left(X(t)-G X_r(t)\right)+r_3 \times(X(t)-G X(t))\right) & \text { rand }<0.5\end{cases} \end{aligned}$ (3)
whereas GX(t+1) represents the candidate location vector of gorillas in the second iteration, and X(t) indicates the existing location vector of the gorilla. Furthermore, r1, r2, r3 and rand specifies a randomized value between 0 and 1. UB and LB represents the upper and lower boundaries, respectively. Xr and GXr denote the candidate location vector of gorillas chosen randomly
$C=F \times\left(1-\frac{I t}{M a x l t}\right)$ (4)
In Eq. (4), $I t$ and MaχIt represent the existing and maximal iteration values, respectively. Initially, the variation value is produced in a larger interval, and later the rehabilitated interval of the variations value might be reduced at the end of the optimization phase:
$F=\cos \left(2 \times r_4\right)+1$ (5)
In Eq. (5), r4 denotes the random number within [-1,1]:
$L=C \times l$ (6)
Eq. (6), l indicates a random number within [0,1]. Furthermore, Eq. (6) was applied to simulate the silverback leadership. Due to a lack of experience, silverback gorilla has difficulty in making the right decision to manage the group or find food. However, they can attain extreme stability and adequate experience with the leadership method. Furthermore, H in Eq. (3) can be evaluated using Eq. (7). Z in Eq. (7) can be evaluated using Eq. (8), whereas Z denotes a random number within [-C,C].
$H=Z \times X(t)$ (7)
$Z=[-C, C]$ (8)
In the last exploration, a group function was implemented to calculate the cost of each GX solution. Once the cost is recognized as (t)<X(t), the X(t) solution is substituted with the GX(t) solution. Thus, a better solution can be considered as silverback.
In the exploitation phase, competition for adult females and the two behaviors of the silverback were adopted. If the silverbacks and other gorillas were younger, they implemented their duties well. For example, a male gorilla follows a silverback. Furthermore, every member influence other member. When C≥W, the following approach can be implemented.
$G X(t+1)=L \times M \times\left(X(t)-X_{\text {silverback}}\right) X(t)$ (9)
In Eq. (9), Xsilverback indicates the vector of silverback that present the optimum solution:
$M=\left(\left|\frac{1}{N} \sum_{i=1}^N G X_i(t)\right|^g\right)^{\frac{1}{g}}$ (10)
In Eq. (10), GXi(t) denotes the vector position of the candidate gorilla at time t; N denotes the total number of gorillas;
$g=2^L$ (11)
Adolescent gorillas have a significant phase of puberty during which they compete with other males for the attention of females. This kind of rivalry is often intense, may last for many days, and has an impact on those around it.
$\begin{aligned} G X(i)=X_{\text {silverback }} -\left(X_{\text {silverback }} \times Q-X(t) \times Q\right) \times A\end{aligned}$ (12)
$Q=2 \times r_5-1$ (13)
$A=\beta \times E$ (14)
$E=\left\{\begin{array}{l}N_1, \text { rand } \geq 0.5 \\ N_2, \text { rand }<0.5\end{array}\right.$ (15)
Eq. (15), Q was adopted to simulate the effect, which was evaluated using Eq. (13). Furthermore, r5 indicates a random number between 0 and 1. Eq. (14) an be utilized for calculating the coefficient vector of the degree of violence in conflict, whereas β indicates the variable that should be provided beforehand in the optimization technique. E can be used to stimulate the effects of violence in the solution dimension. When rand≥0.5, E is equivalent to random values in the uniform distribution and problem dimensions.
To accelerate the converging speed of the GTO algorithm and fortify the optimization capability, the MGTO technique was modeled using the opposition-based learning (OBL) method for screening N initial populations. The steps of the multistage population initialization algorithm joining OBL and logistic mapping are as follows:
1) leverage logistic mapping for generating N the number of individuals to form original populationN1;
2) Use Eq. (16) for finding an opposed solution for all individuals to form a reverse population N2;
$\tilde{X}_i^d=U_b^d-L_b^d+X_i^d$ (16)
Equation Xid signifies the reverse individual of initial individual. Eventually, combine the reverse population, and original population, compute the fitness values and chooses the first N amount of individuals with small fitness to form final initial population.
The fitness function (FF) of the MGTO considered the classifier accuracy and count of selected features. It optimizes the classifier accuracy and decreases the selected features set size. Hence, the following FF was employed for assessing individual solutions, as given in Eq. (17).
Fitness $=\alpha *$ ErrorRate $+(1-\alpha) \frac{\# S F}{\# A l l\_ F}$ (17)
whereas Error Rate means classifier error rate exploiting the selected features.
3.3 Seizure prediction process
In this work, the GRU model is applied to predict epileptic seizures. RNN can be a kind of ANN that was suitable to investigate and process time sequence datasets, in contradiction to traditional NN [25]. It depends primarily on the weight connections amongst the layers. The RNN applied the hidden layer (HL) to maintain dataset in previous instant, and output can be affected by current conditions and prior memory. Here, $x^{(t)}$ and $\hat{y}^{\langle t)}$ represents input and output at time t, $a^{(t)}$ signifies the outcome of single HL at time t, and $\omega_{a a}^{\langle t\rangle}$, $\omega_{a x}^{\langle t\rangle}$ , and $\omega_{a y}^{\langle t\rangle}$ correspondingly shows HL, input, and output weighted matrices.
$\begin{gathered}a^{\langle t\rangle}=g_1\left(\omega_{a a} a^{\langle t-1\rangle}+\omega_{a x} x^{\langle t-1\rangle}+b_a\right), \\ \hat{y}^{\langle t)}=g_2\left(\omega_{a x} a^{\langle t\rangle}+b_y\right),\end{gathered}$ (18)
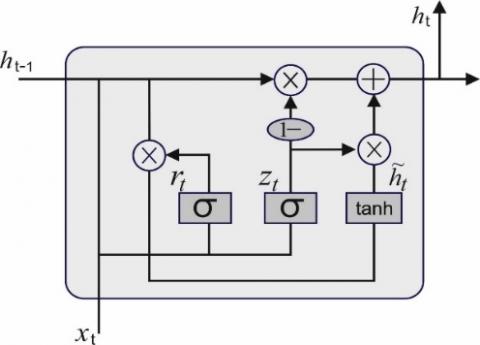
whereas ba and by correspondingly shows the bias vector of single HL and output. g1 and g2 signifies nonlinear activation function. The RNN accomplishes well when the outcome was neighboring to relevant input; although, when the time interval was lengthy and weight count becomes large, input would be smaller effect on output due to gradient vanishing problems. The GRU framework has been demonstrated in Figure 2, whereas $\sigma$ and tanh signify activation function, $c^{\langle t-1\rangle}$ represent input of existing unit, that is outcome of previous unit, $\hat{y}$ specifies output of existing unit, which interconnects to input of subsequent unit. $x^{(t)}$ signifies input of trained dataset, $x^{(t)}$ specifies results of unit, generated by activation function, $\Gamma_r$ and $\Gamma_u$ correspondingly represents reset and upgraded gate, and candidate activation $\tilde{\boldsymbol{C}}^{\langle t\rangle}$ can be equally evaluated. It comprises of 2 gates in GRU, i) upgrade gate, which continues previous dataset to the current state; the values of $\Gamma_u$ ranges from 0 to 1, the nearby $\Gamma_u$ was to 0, the other previous dataset it conserves; another was reset gate that can be applied to describe whether the existing state, as well as previous dataset, are incorporated or not. The value of $\Gamma_r$ range in -1 to 1, while value gets lesser of $\Gamma_r$ the other previous dataset get ignores:
$\begin{gathered}\Gamma_u=\sigma\left(\omega_u\left[c^{\langle t-1\rangle}, x^{\langle t\rangle}\right]+b_u\right), \\ \Gamma_r=\sigma\left(\omega_r\left[c^{\langle t-1\rangle}, x^{\langle t\rangle\rangle}\right]+b_r\right), \\ \tilde{c}^{\langle t\rangle}=\tanh \left(\omega_c\left[\Gamma_r * c^{\langle t-1\rangle}, x^{\langle t\rangle}\right]+b_c\right), \\ c^{\langle t\rangle}=\left(1-\Gamma_\nu\right) * c^{\langle t-1\rangle}+\Gamma_\nu * \tilde{c}^{\langle t\rangle},\end{gathered}$ (19)
whereas, ωu, ωr, and ωc correspondingly indicates trained weighted matrices of upgrade and reset gate and candidate activation $\tilde{\boldsymbol{C}}^{\langle t\rangle}$, and bu, br, and bc denotes bias vector.
Figure 2. Framework of GRU
To modify the hyperparameter values of the GRU method, the GWO is used. Mirjalili et al. developed a new SI optimized technique named GWO [26]. Indeed, it is original method that accelerates hunting and social hierarchies of GW. To develop the social performance of GW, it is classified into 4 states namely α, β, $\delta$, and $\omega$. α considering that optimal solution implemented by $\beta$ and $\delta$, correspondingly, and residual solution derives in $\omega$. The first 3 fittest wolves called α, $\beta$, and $\delta$ are nearby the prey support ω to distinguish the food from complex areas. In the surrounding stage, wolf increases the place of, $\beta$, or $\delta$ as demonstrated in Eqns. (20) and (21):
$\vec{D}=\left|\vec{C} \cdot \vec{X}_{p(t)}-\vec{X}(\mathrm{t})\right|$ (20)
$\vec{X}(\mathrm{t}+1)=\vec{X}_{p(t)}-\vec{A} \cdot \vec{D}$ (21)
Now t shows the existing iteration, $\vec{X}_{p(t)}$ signifies the present location of prey and $\vec{X}(\mathrm{t})$ implies the present place of wolves. $\vec{D}$ denotes the distance amongst wolf and prey, and co-efficient vectors $\vec{A}$ and $\vec{C}$ resulting in mathematical processes in the following.
$\vec{A}=2 \vec{a} \overrightarrow{r_1}-\vec{a}$ (22)
$\overrightarrow{\mathrm{C}}=2 \overrightarrow{r_2}$ (23)
where, $\overrightarrow{r_1}$ and $\overrightarrow{r_2}$ implies the 2 vectors lie within [0,1], the component of $\vec{a}$ has linearly reduced from 2 to 0. Now, α, β, and δ describes location nearby to prey locations. In the process of hunting, topmost 3 are optimal solutions and residual wolves ω are suitable for substituting on the first 3 optimal wolves:
$\overrightarrow{\mathrm{D}}_\alpha=\left|\overrightarrow{\mathrm{C}}_1 \cdot \vec{X}-\vec{X}\right|$ (24)
$\vec{D}_\beta=\left|\vec{C}_2 \cdot \vec{X}-\vec{X}\right|$ (25)
$\vec{D}_\delta=\left|\vec{C}_3 \cdot \vec{X}-\vec{X}\right|$ (26)
$\overrightarrow{\mathrm{X}}_1=\vec{X}_a-\overrightarrow{\mathrm{A}}_2 \cdot\left(\overrightarrow{\mathrm{D}}_\alpha\right)$ (27)
$\vec{X}_2=\vec{X}_\beta-\vec{A}_2 \cdot\left(\vec{D}_\beta\right)$ (28)
$\vec{X}_3=\vec{X}-\vec{A} \cdot\left(\vec{D}_\delta\right)$ (29)
$\vec{X}(\mathrm{t}+1)=\frac{\overrightarrow{X_1}+\vec{X}+\overrightarrow{X_3}}{3}$ (30)
whereas $\vec{X}_\alpha$ indicates the location of $\alpha$, $\overrightarrow{\mathrm{X}}_\beta$ determined the location of $\beta, \overrightarrow{X_\delta}$ denotes the location of $\delta, \vec{X}$ shows the location of current solutions, $\overrightarrow{\mathrm{C}_1}, \overrightarrow{\mathrm{C}_2}$ and $\overrightarrow{\mathrm{C}_3}$ suggests the vector produced arbitrarily. At this time, $\overrightarrow{\mathrm{A}_1}, \overrightarrow{\mathrm{A}_2}$ and $\overrightarrow{\mathrm{A}_3}$ indicates arbitrary vector, and $t$ indicates the iteration count. The step size of ω wolf implemented then α, β, and δ are demonstrated in Eqns. (24)-(26). Later, the resulting location of ω wolf has assessed by Eqns. (27)-(30).
The GWO method makes a derivate of fitness function (FF) to have greater classifier outcome. It defines a positive value for designating higher outcomes of candidate solutions.
|
Algorithm 1: Pseudo code of GWO technique |
|
Initializing Population: Grey wolves Xi(i=1,2,..,n) initialize Parameters: a, A, and C define fitness value of each searching agent Xα=best searching agent Xβ=second optimum searchagent =third optimum searching agent while (t<Max_number_iterations) for each searching agent Upgrade the position of present search agent End for Upgrade a, A and C define fitness value of each searching agent Upgrade Xα, Xβ, and Xδ Increment t End while Return Xα |
In this article, the minimal classifier rate of errors indicates the FF, as given in Eq. (31).
$\begin{aligned} & \text { fitness }\left(x_i\right)=\text { ClassifierErrorRate }\left(x_i\right) = & \frac{\text { number of misclassified samples }}{\text { Total number of samples }} * 100\end{aligned}$ (31)
In this section, the experimental validation of the MGTODL-ESP method is validated on the EEG signal dataset [27, 28], comprising 40000 samples. The dataset contained two classes with 20000 samples as presented in Table 1. The CHB-MIT dataset is a compilation of EEG recordings obtained from children suffering from epilepsy, as shown in Table 2. The dataset is a product of research carried out by a team from the Children's Hospital of Boston and MIT. The dataset included EEG recordings from 23 individuals and a total of over 16 h of data. The recordings were made using the International 10-20 system, a widely accepted method for positioning electrodes on the scalp. Researchers have used this dataset in their studies on EEG signal processing and analysis. The CHB-MIT dataset is available for download on the IEEE DataPort, a platform that enables researchers to access and share scientific datasets, as shown in Table 3.
Table 1. Dataset details
|
Class |
No. of Samples |
|
Seizure |
20000 |
|
NoSeizure |
20000 |
|
Total Number of Samples |
40000 |
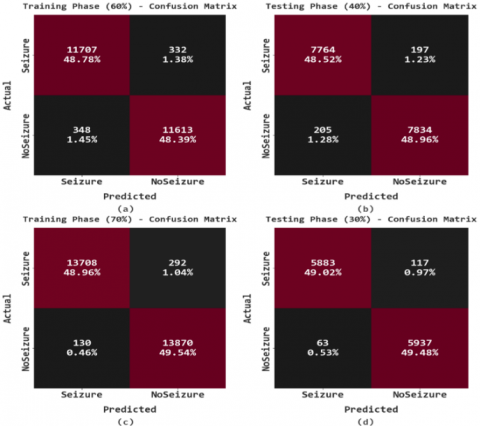
Figure 3. Confusion matrices of MGTODL-ESP system (a-b) TR and TS databases of 60:40 and (c-d) TR and TS databases of 70:30
The confusion matrices produced by the MGTODL-ESP methodology on varying database sizes are reported in Figure 3. The MGTODL-ESP approach has properly recognized the seizure and non-seizure instances. For instance, on 60% of TR database, the MGTODL-ESP methodology has recognized 11707 instances under seizure class and 11613 instances under no seizure class. In addition, on 40% of TS database, the MGTODL-ESP approach has detection 7764 instances under seizure class and 7834 instances under no seizure class.
Table 2 depicts a brief seizure classification result of the MGTODL-ESP model on 60% of TR data and 40% of TS data. Figure 4 depicts an overall seizure classifier outcome of the MGTODL-ESP methodology on 60% of TR database. With seizure class, the MGTODL-ESP system has obtained accubal of 97.24%, sensy of 97.24%, specy of 97.09%, Fscore of 97.18%, MCC of 94.33%, and Gmean of 97.17%. Also, with no seizure class, the MGTODL-ESP methodology has reached accubal of 97.09%, sensy of 97.09%, specy of 97.24%, Fscore of 97.16%, MCC of 94.33%, and Gmean of 97.17%.
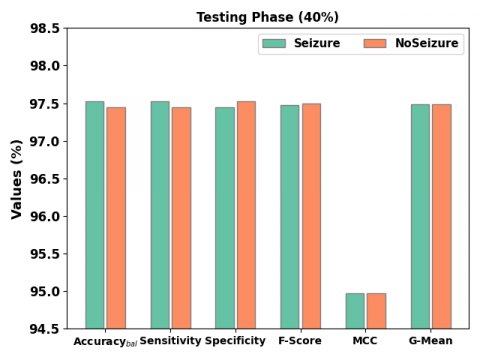
Figure 5 illustrates an overall seizure classifier outcome of the MGTODL-ESP approach on 40% of TS database. With seizure class, the MGTODL-ESP method has reached $a c c u_{\mathrm{bal}}$ of 97.53%, sensy of 97.53%, specy of 97.45%, Fscore of 97.48%, MCC of 94.97%, and Gmean of 97.49%. Besides, with no seizure class, the MGTODL-ESP technique has reached accubal of 97.45%, sensy of 97.45%, specy of 97.53%, Fscore of 97.50%, MCC of 94.97%, and Gmean of 97.49%.
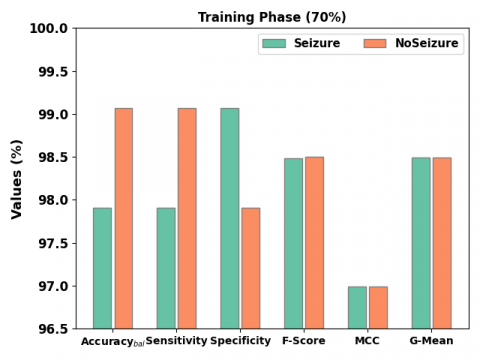
Table 3 illustrates a brief seizure classification outcome of the MGTODL-ESP approach on 70% of TR and 30% of TS databases. Figure 6 showcases an overall seizure classifier outcome of the MGTODL-ESP technique on 70% of TR database. With seizure class, the MGTODL-ESP algorithm has acquired accubal of 97.91%, sensy of 97.91%, specy of 99.07%, Fscore of 98.48%, MCC of 96.99%, and Gmean of98.49%. Followed by, with no seizure class, the MGTODL-ESP system has reached accubal of 99.07%, sensy of 99.07%, specy of 97.91%, Fscore of 98.50%, MCC of 96.99%, and Gmean of 98.49%.
Figure 4. Seizure classification outcome of MGTODL-ESP approach under 60% of TR database
Figure 5. Seizure classification outcome of MGTODL-ESP approach under 40% of TS database
Table 2. Seizure classification outcome of MGTODL-ESP approach under 60:40 of TR/TS databases
|
Class |
Accuracybal |
Sensitivity |
Specificity |
F-Score |
MCC |
G-Mean |
|
Training Phase (60%) |
||||||
|
Seizure |
97.24 |
97.24 |
97.09 |
97.18 |
94.33 |
97.17 |
|
NoSeizure |
97.09 |
97.09 |
97.24 |
97.16 |
94.33 |
97.17 |
|
Average |
97.17 |
97.17 |
97.17 |
97.17 |
94.33 |
97.17 |
|
Testing Phase (40%) |
||||||
|
Seizure |
97.53 |
97.53 |
97.45 |
97.48 |
94.97 |
97.49 |
|
NoSeizure |
97.45 |
97.45 |
97.53 |
97.50 |
94.97 |
97.49 |
|
Average |
97.49 |
97.49 |
97.49 |
97.49 |
94.97 |
97.49 |
Table 3. Seizure classification outcome of MGTODL-ESP approach under 70:30 of TR/TS databases
|
Class |
Accuracybal |
Sensitivity |
Specificity |
F-Score |
MCC |
G-Mean |
|
Training Phase (70%) |
||||||
|
Seizure |
97.91 |
97.91 |
99.07 |
98.48 |
96.99 |
98.49 |
|
NoSeizure |
99.07 |
99.07 |
97.91 |
98.50 |
96.99 |
98.49 |
|
Average |
98.49 |
98.49 |
98.49 |
98.49 |
96.99 |
98.49 |
|
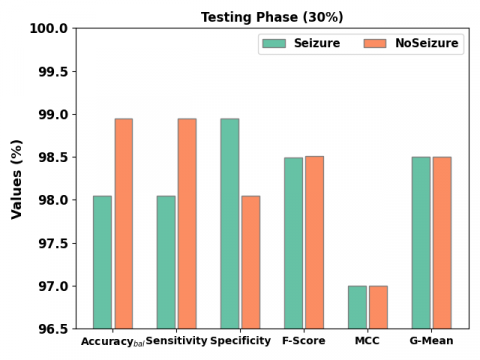
Testing Phase (30%) |
||||||
|
Seizure |
98.05 |
98.05 |
98.95 |
98.49 |
97.00 |
98.50 |
|
NoSeizure |
98.95 |
98.95 |
98.05 |
98.51 |
97.00 |
98.50 |
|
Average |
98.50 |
98.50 |
98.50 |
98.50 |
97.00 |
98.50 |
Figure 6. Seizure classification outcome of MGTODL-ESP approach under 70% of TR database
Figure 7. Seizure classification outcome of MGTODL-ESP approach on 30% of TS database
Figure 7 depicts an overall seizure classifier outcome of the MGTODL-ESP method on 30% of TS database. With seizure class, the MGTODL-ESP algorithm has obtained $a c c u_{\mathrm{bal}}$ of 98.05%, sensy of 98.05%, specy of 98.95%, Fscore of 98.49%, MCC of 97%, and Gmean of 98.50%. Moreover, with no seizure class, the MGTODL-ESP system has obtained accubal of 98.95%, sensy of 98.95%, specy of 98.05%, Fscore of 98.51%, MCC of 97%, and Gmean of 98.50%.
The TACC and VACC of the MGTODL-ESP system are examined on seizure classification performance in Figure 8. The figure referred that the MGTODL-ESP algorithm has shown higher performance with enhanced values of TACC and VACC. It is noticeable that the MGTODL-ESP methodology has reached superior TACC outcomes.
Figure 8. TACC and VACC analysis of MGTODL-ESP methodology
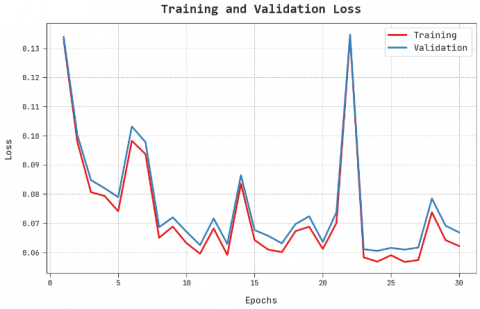
Figure 9. TLS and VLS analysis of MGTODL-ESP approach
The TLS and VLS of the MGTODL-ESP system are tested on seizure classification performance in Figure 9. The figure stated that the MGTODL-ESP method has demonstrated superior performance with lower values of TLS and VLS. It is visible that the MGTODL-ESP model has resulted in decreased VLS outcomes.
An evident precision-recall study of the MGTODL-ESP system in the test database is described in Figure 10. The figure pointed out the MGTODL-ESP algorithm has resulted in greater values of precision-recall values in two classes.
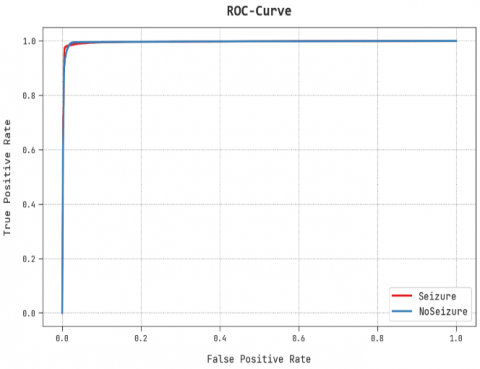
A comprehensive ROC investigation of the MGTODL-ESP system in the test database is portrayed in Figure 11. The outcome stated the MGTODL-ESP technique has presented its capability in cataloguing two classes.
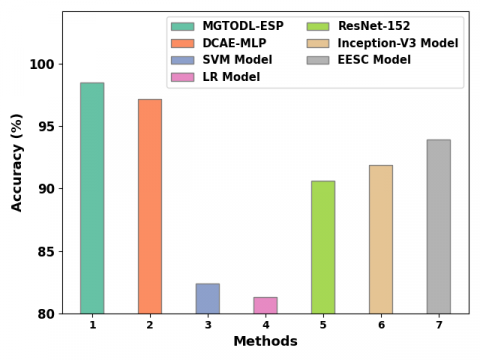
In Table 4 and Figure 12, a widespread comparative $\operatorname{accu}_y$ analysis is made with recent models. The experimental values indicated that the SVM and LR technique has revealed least accuy values of 82.39% and 81.32% respectively.
Followed by the ResNet-152, Inceptionv3, and EESC models have obtained certainly increased accuy of 90.63%, 91.89%, and 93.92% respectively. Although the DCAE-MLP model has reported reasonable accuy of 97.17%, the MGTODL-ESP model has attained maximum accuy of 98.50%. These outcomes assured the enhanced seizure prediction results of the MGTODL-ESP model.
Figure 10. Precision-recall analysis of MGTODL-ESP approach
Figure 11. ROC curve analysis of MGTODL-ESP approach
Figure 12. Comparative analysis of MGTODL-ESP approach with other recent systems
Table 4. Comparative analysis of MGTODL-ESP methodology with other recent systems
|
Methods |
Accuracy (%) |
|
MGTODL-ESP |
98.50 |
|
DCAE-MLP |
97.17 |
|
SVM Model |
82.39 |
|
LR Model |
81.32 |
|
ResNet-152 |
90.63 |
|
Inception-V3 Model |
91.89 |
|
EESC Model |
93.92 |
Here are some additional limitations that can be considered:
These limitations suggest that there is room for further research and improvement in the field of EEG-based prediction of epileptic seizures.
In this study, an automated seizure prediction model named the MGTODL-ESP model has been developed to predict different classes of seizures on EEG Signals. In the presented MGTODL-ESP technique, four major processes are involved such as data pre-processing, MGTO related selective feature, GRU classification, and GWO related hyperparameter optimization. For the optimal selection of features, the MGTO approach is used. Finally, the GWO with GRU method was executed for the seizure prediction procedure where the GWO algorithm helps in optimal selection of GRU hyperparameters. To validate the enhanced performance of the MGTODL-ESP system, a varied range of simulations were performed on medical dataset. The resultant values established the better performance of the MGTODL-ESP system over other existing models. In the future, feature reduction and data clustering techniques will be used to scale up the prediction performance of the MGTODL-ESP method.
The proposed MGTODL-ESP model is a promising approach for improving the accuracy and efficiency of predicting epileptic seizures using EEG signals. The model, which combines a modified Gorilla Troops Optimization algorithm and Deep Learning techniques, demonstrated an accuracy rate of 98.50% in the empirical study using a benchmark CHB-MIT scalp EEG database. Despite these promising results, the proposed work also has limitations. These include limitations in data access and the methodology used. However, these limitations provide opportunities for future research to further deepen this topic. Future research directions could involve exploring alternative methods for feature selection, improving the prediction performance of the model with more complex algorithms, and validating the model with larger datasets. Additionally, incorporating other signals such as electrocardiography (ECG) and electromyography (EMG) into the model may provide more comprehensive information for the prediction of epileptic seizures.
[1] Ahmad, I., Wang, X., Zhu, M., Wang, C., Pi, Y., Khan, J.A., Khan, S., Samuel, O.W., Chen, S., Li, G. (2022). EEG-based epileptic seizure detection via machine/deep learning approaches: A systematic review. Computational Intelligence and Neuroscience, 2022: 6486570. https://doi.org/10.1155/2022/6486570
[2] Malekzadeh, A., Zare, A., Yaghoobi, M., Kobravi, H.R., Alizadehsani, R. (2021). Epileptic seizures detection in EEG signals using fusion handcrafted and deep learning features. Sensors, 21(22): 7710. https://doi.org/10.3390/s21227710
[3] Beeraka, S.M., Kumar, A., Sameer, M., Ghosh, S., Gupta, B. (2021). Accuracy enhancement of epileptic seizure detection: A deep learning approach with hardware realization of STFT. Circuits, Systems, and Signal Processing, 41(1): 461-484. https://doi.org/10.1007/s00034-021-01789-4
[4] Omidvar, M., Zahedi, A., Bakhshi, H. (2021). EEG signal processing for epilepsy seizure detection using 5-level Db4 discrete wavelet transform, GA-based feature selection and ANN/SVM classifiers. Journal of Ambient Intelligence and Humanized Computing, 12(11): 10395-10403. https://doi.org/10.1007/s12652-020-02837-8
[5] Zhang, S., Liu, G., Xiao, R., Cui, W., Cai, J., Hu, X., Sun, Y., Qiu, J., Qi, Y. (2022). A combination of statistical parameters for epileptic seizure detection and classification using VMD and NLTWSVM. Biocybernetics and Biomedical Engineering, 42(1): 258-272. https://doi.org/10.1016/j.bbe.2022.02.004
[6] Shoeibi, A., Khodatars, M., Ghassemi, N., Jafari, M., Moridian, P., Alizadehsani, R., Panahiazar, M., Khozeimeh, F., Zare, A., Hosseini-Nejad, H., Khosravi, A., Atiya, A.F., Aminshahidi, D., Hussain, S., Rouhani, M., Nahavandi, S., Acharya, U.R. (2021). Epileptic seizures detection using deep learning techniques: A review. International Journal of Environmental Research and Public Health, 18(11): 5780. https://doi.org/10.3390/ijerph18115780
[7] Molla, Md.K.I., Hassan, K.M., Islam, Md.R., Tanaka, T. (2020). Graph eigen decomposition-based feature-selection method for epileptic seizure detection using electroencephalography. Sensors, 20(16): 4639. https://doi.org/10.3390/s20164639
[8] Singh, K., Malhotra, J. (2022). Smart neurocare approach for detection of epileptic seizures using deep learning based temporal analysis of EEG patterns. Multimedia Tools and Applications, 81(20): 29555-29586. https://doi.org/10.1007/s11042-022-12512-z
[9] Thara, D.K., PremaSudha, B.G., Fan, X. (2019). Auto-detection of epileptic seizure events using deep neural network with different feature scaling techniques. Pattern Recognition Letters, 128: 544-550. https://doi.org/10.1016/j.patrec.2019.10.029
[10] Boonyakitanont, P., Lek-uthai, A., Chomtho, K., Songsiri, J. (2020). A review of feature extraction and performance evaluation in epileptic seizure detection using EEG. Biomedical Signal Processing and Control, 57: 101702. https://doi.org/10.1016/j.bspc.2019.101702
[11] Bhandari, V., Huchaiah, M.D. (2022). A new design of epileptic seizure detection using hybrid heuristic-based weighted feature selection and ensemble learning. International Journal of Intelligent Robotics and Applications, 6: 668-693. https://doi.org/10.1007/s41315-022-00233-3
[12] Escorcia-Gutierrez, J., Beleño, K., Jimenez-Cabas, J., Elhoseny, M., Dahman Alshehri, M., Selim, M.M. (2022). An automated deep learning enabled brain signal classification for epileptic seizure detection on complex measurement systems. Measurement, 196: 111226. https://doi.org/10.1016/j.measurement.2022.111226
[13] Hu, X., Yuan, S., Xu, F., Leng, Y., Yuan, K., Yuan, Q. (2020). Scalp EEG classification using deep Bi-LSTM network for seizure detection. Computers in Biology and Medicine, 124: 103919. https://doi.org/10.1016/j.compbiomed.2020.103919
[14] Hassan, K.M., Islam, Md.R., Nguyen, T.T., Molla, Md.K.I. (2022). Epileptic seizure detection in EEG using mutual information-based best individual feature selection. Expert Systems with Applications, 193: 116414. https://doi.org/10.1016/j.eswa.2021.116414
[15] Glory, H.A., Vigneswaran, C., Jagtap, S.S., Shruthi, R., Hariharan, G., Sriram, V.S.S. (2020). AHW-BGOA-DNN: A novel deep learning model for epileptic seizure detection. Neural Computing and Applications, 33(11): 6065-6093. https://doi.org/10.1007/s00521-020-05384-7
[16] Choi, G., Park, C., Kim, J., Cho, K., Kim, T.J., Bae, H., Min, K., Jung, K.Y., Chong, J. (2019). A novel multi-scale 3D CNN with deep neural network for epileptic seizure detection. 2019 IEEE International Conference on Consumer Electronics (ICCE), Las Vegas, NV, USA, pp. 1-2. https://doi.org/10.1109/icce.2019.8661969
[17] Singh, K., Malhotra, J. (2018). Stacked autoencoders based deep learning approach for automatic epileptic seizure detection. 2018 First International Conference on Secure Cyber Computing and Communication (ICSCCC), Jalandhar, India, pp. 249-254. https://doi.org/10.1109/icsccc.2018.8703357
[18] Abdelhameed, A., Bayoumi, M. (2021). A deep learning approach for automatic seizure detection in children with epilepsy. Frontiers in Computational Neuroscience, 15: 650050. https://doi.org/10.3389/fncom.2021.650050
[19] Sarić, R., Jokić, D., Beganović, N., Pokvić, L.G., Badnjević, A. (2020). FPGA-based real-time ES classification using Artificial Neural Network. Biomedical Signal Processing and Control, 62: 102106. https://doi.org/10.1016/j.bspc.2020.102106
[20] Aileni, R.M., Paşca, S., Florescu, A. (2019). Epileptic seizure classification based on supervised learning models. In 2019 11th International Symposium on Advanced Topics in Electrical Engineering (ATEE), Bucharest, Romania, pp. 1-4. https://doi.org/10.1109/ATEE.2019.8725004
[21] Almustafa, K.M. (2020). Classification of epileptic seizure dataset using different machine learning algorithms. Informatics in Medicine Unlocked, 21: 100444. https://doi.org/10.1016/j.imu.2020.100444
[22] Gao, Y., Gao, B., Chen, Q., Liu, J., Zhang, Y. (2020). Deep convolutional neural network-based epileptic electroencephalogram (EEG) signal classification. Frontiers in Neurology, 11: 375. https://doi.org/10.3389/fneur.2020.00375
[23] Choubey, S., Barde, S., Badholia, A. (2022). Enhancing the prediction efficiency of virus borne diseases using enhanced backpropagation with an artificial neural network. Measurement: Sensors, 24: 100505. https://doi.org/10.1016/j.measen.2022.100505
[24] Wu, T., Wu, D., Jia, H., Zhang, N., Almotairi, K.H., Liu, Q., Abualigah, L. (2022). A modified gorilla troops optimizer for global optimization problem. Applied Sciences, 12(19): 10144. https://doi.org/10.3390/app121910144
[25] Wei, D., Wang, J., Niu, X., Li, Z. (2021). Wind speed forecasting system based on gated recurrent units and convolutional spiking neural networks. Applied Energy, 292: 116842. https://doi.org/10.1016/j.apenergy.2021.116842
[26] Zhang, Z., Hong, W.C. (2021). Application of variational mode decomposition and chaotic grey wolf optimizer with support vector regression for forecasting electric loads. Knowledge-Based Systems, 228: 107297. https://doi.org/10.1016/j.knosys.2021.107297
[27] Goldberger, A.L., Amaral, L.A., Glass, L., Hausdorff, J.M., Ivanov, P.C., Mark, R.G., Mietus, J.E., Moody, G.B., Peng, C., Stanley, H.E. (2000). PhysioBank, PhysioToolkit, and PhysioNet: Components of a new research resource for complex physiologic signals. Circulation, 101(23): e215-e220. https://doi.org/10.1161/01.CIR.101.23.e215
[28] Deepa, B., Ramesh, K. (2022). Epileptic seizure detection using deep learning through min max scaler normalization. International Journal of Health Sciences, 6: 10981-10996. https://doi.org/10.53730/ijhs.v6nS1.7801