Yuda Zhou![]() | Zhen Gong
| Zhen Gong![]() | Lin Li*
| Lin Li*![]()
© 2023 IIETA. This article is published by IIETA and is licensed under the CC BY 4.0 license (http://creativecommons.org/licenses/by/4.0/).
OPEN ACCESS
Stroke, an acute cerebrovascular disease, has become the second leading cause of death worldwide after coronary heart disease, characterized by high incidence, disability, and mortality rates, with an increasingly younger affected population. Clinically, stroke types are primarily divided into ischemic and hemorrhagic strokes, with ischemic stroke being the most common. Presently, early identification methods rely heavily on physicians' experience, leading to misdiagnosis, missed diagnosis, diagnostic delay, and other issues, potentially resulting in worsened conditions or severe complications. Although artificial intelligence-based stroke auxiliary diagnosis systems have been employed in recent years to reduce missed diagnoses and enhance work efficiency, their impact on improving diagnostic accuracy has been limited. The main reason for this limitation is the selection of relatively singular or atypical feature types in neural networks, which affects diagnostic accuracy. To address this issue, this study leverages the rapid and sensitive response of electroencephalogram (EEG) data to cerebral ischemia and combines it with clinical indicators to propose a comprehensive "clinical indicators + quantitative electroencephalogram" multi-feature pattern recognition method. Initially, 23 key features for neural network training are selected. Subsequently, an ischemic stroke diagnosis model combining LSTM attention and multi-feature is constructed. In an experiment involving 500 ischemic stroke patients, the diagnostic model demonstrates an accuracy of 0.81, a sensitivity of 0.82, and an F1-score of 0.81. Moreover, to accurately locate the lesion area, the three-dimensional features of MRI images are used. A cascaded 3D deep residual network stroke precise segmentation method is constructed by incorporating residual units and cascade concepts into the 3DCNN network. The evaluation indicators of this segmentation algorithm on the training set are: DICE coefficient 0.91, precision 0.94, and sensitivity 0.89. Experimental results indicate that the proposed method outperforms existing clinical diagnosis schemes and CNN segmentation models in terms of diagnostic performance. The implementation of rapid and accurate diagnosis during early stages of stroke onset is crucial for improving ischemic prognosis, minimizing brain damage, and reducing mortality and disability rates.
computer-aided diagnosis, ischemic stroke, quantitative electroencephalogram, 3D deep residual network, cascaded U-Net, LSTM neural network
Stroke is a cerebrovascular disease resulting from damage to cerebral blood vessels due to various causes, leading to local hypoxia or ischemic necrosis of brain tissue and corresponding neurological dysfunction. It is classified into ischemic stroke and hemorrhagic stroke, with ischemic stroke accounting for approximately 75-90% of all strokes [1, 2] and presenting extremely high disability and mortality rates. According to the latest global burden of disease study in 2019, 6.55 million people succumbed to stroke worldwide, accounting for 11.6% of total deaths, making it the second leading cause of death globally, after coronary heart disease (16.2%) [3]. In China, the stroke mortality rate constitutes about 22.3% of the total mortality rate of residents, making it the leading cause of death in the country. The number of patients with cerebrovascular disease is growing at an annual rate of roughly 8.7% [3]. Considering the irreversibility of stroke development, early treatment is crucial for prognosis [4]. Currently, the clinical diagnostic method for ischemic stroke is a qualitative assessment performed by doctors based on patients' clinical characteristics and biochemical test data, primarily relying on the medical expertise and clinical experience of physicians. However, when confronted with numerous complex disease characteristics, doctors may misdiagnose and miss diagnoses due to subjective factors or heavy workload, thereby increasing their work pressure and delaying patients' treatment. Therefore, there is an urgent need for a computer-aided diagnostic method capable of rapidly diagnosing and localizing ischemic stroke lesions to assist doctors in determining treatment plans.
With the continuous advancement of artificial intelligence in the medical field, deep learning has achieved noteworthy research results in the auxiliary diagnosis of ischemic stroke. Its advantages are primarily reflected in the automatic detection of stroke [5, 6], segmentation of stroke infarction areas [7], and prediction of complications [8]. Deep learning technology can accurately extract high-quality information from a vast amount of redundant information, enabling medical staff to diagnose and devise beneficial treatment plans more rapidly in clinical work, thereby improving the speed of treatment decision-making. However, in current research on auxiliary diagnosis of ischemic stroke, diagnostic accuracy needs enhancement. The main reason is that the selection of feature types in neural networks is relatively singular or atypical features, which affect the diagnostic accuracy. For instance, the clinical decision of ischemic stroke disease based on a single image feature [9], speech feature [10], or ultrasonic inspection feature lacks the learning of diagnosis of ischemic stroke disease by combining multiple inspection features that complement each other, in order to provide patients with an accurate diagnostic method.
In light of the fact that the current method of using clinical features and biochemical test data to qualitatively diagnose ischemic stroke is not comprehensive, this study exploits the advantages of electroencephalogram (EEG) in responding rapidly and sensitively to brain metabolism, cerebral ischemia, and hypoxia [11, 12]. It is anticipated that dynamic observation of EEG changes, such as using quantitative EEG to quantitatively analyze the relevant information in EEG, and combining "clinical indicators + quantitative EEG" along with other multi-dimensional features as the input of LSTM (long short-term memory network) neural network for training will be beneficial. Simultaneously, the attention mechanism is incorporated into the neural network model to improve the diagnostic accuracy of the auxiliary diagnosis model. The area of brain infarction is closely related to the prognosis of stroke. Clinically, the diagnosis of the location and area of ischemic stroke lesions relies on CT or MRI examination to determine the specific location of the lesions. MRI can detect early stroke within tens of minutes or even minutes after stroke onset, demonstrating higher diagnostic capability than CT scans [13]. However, MRI reading is dependent on the experience and proficiency of doctors and the vast number of MRI images, resulting in a heavy workload for physicians. Coupled with individual differences among patients, accurately locating the lesion area poses certain challenges. Based on this, the present study further investigates the precise segmentation method of stroke based on MRI images in conjunction with auxiliary diagnosis. The aim is to provide more objective and accurate information to assess the severity and prognosis of ischemic stroke patients, and to assist doctors in completing rapid assessment and lesion localization of ischemic stroke.
2.1 Data collection
The research objects were selected from 500 outpatients and inpatients with ischemic stroke in a hospital from 2021 to 2022. The inclusion criteria were: (1) meeting the clinical diagnosis and treatment standards of ischemic stroke; (2) supported by head MRI imaging; (3) continuous electroencephalogram monitoring; (4) serum index detection. The MRI image data contains manual annotation of ischemic penumbra lesions by experienced neurologists comparing perfusion and diffusion images and combining the currently accepted linear threshold.
(1) Clinical Index Data
Table 1. Clinical indicators and diagnostic indicators for ischemic stroke
|
Serial No. |
Content |
Clinical indicators |
Symptom manifestation or value |
|
1 |
BEFAST symptoms |
B-Balance |
The patient loses balance or coordination ability and has difficulty walking; Boolean value, take 1 if symptoms appear, otherwise 0. |
|
2 |
E-Eyes |
The patient has visual difficulties or sudden changes in vision; Boolean value, take 1 if symptoms appear, otherwise 0. |
|
|
3 |
F-Face |
The patient has facial asymmetry and mouth deviation; Boolean value, take 1 if symptoms appear, otherwise 0. |
|
|
4 |
A-Arms |
The patient suddenly feels weak or numb on one side of the body; Boolean value, take 1 if symptoms appear, otherwise 0. |
|
|
5 |
S-Speech |
The patient's speech is unclear or slurred; Boolean value, take 1 if symptoms appear, otherwise 0. |
|
|
6 |
T-Time |
Time when the above symptoms appeared; numeric |
|
|
7 |
Scale score |
National Institutes of Health Stroke Scale |
Mild stroke 3 points or less, moderate stroke 3-10 points, severe stroke more than 10 points. |
|
8 |
Blood pressure |
High systolic blood pressure |
Blood pressure below 140/90mmHg is normal, the higher the value, the greater the risk |
|
9 |
BMI index |
High body mass index |
The normal BMI value is between 20 and 25, the higher the value, the greater the risk |
|
10 |
Blood sugar |
High fasting blood sugar |
The normal value is between 3.9 and 6.1 mmol/L, the higher the value, the greater the risk |
|
11 |
Hcy |
Homocysteine |
Hcy threshold 10, the higher the stroke risk |
|
12 |
Lp(a) |
Lipoprotein |
Lp(a) threshold 75 nmol/L, the higher the value, the greater the risk |
|
13 |
Apo-A |
Apolipoprotein A |
Apo-A threshold 300 mg/L, the lower the level, the higher the risk of ischemic stroke. |
|
14 |
D-D |
D-dimer |
It is closely related to the degree of cerebral infarction. The threshold is 0.49 ug/ml. The higher the content, the higher the risk of ischemic stroke and recurrence. |
|
15 |
FBG |
Fibrinogen |
Normal value 1.5-4g/L, increased value aggravates neurological deficit and poor prognosis. |
Note: For serum indicators in serial numbers 8-15, if normal, use 1 to represent normal, 2 to represent elevated, and 0 to represent decreased.
In addition to the "BEFAST" trial issued by the Chinese Stroke Association to identify early symptoms of stroke [14] and the NIHSS (National Institutes of Health Stroke Scale) score, serum index detection can be used in medical clinics to diagnose ischemic stroke and assess the severity of the disease. Studies have found that homocysteine (Hcy), lipoprotein a [Lp(a)], apolipoprotein A (Apo-A), D-dimer (D-D), and fibrinogen (FBG) are independent risk factors for ischemic stroke [15]. At the same time, studies [16, 17] have pointed out that the top three risk factors leading to stroke are: hypertension, high body mass index and high fasting blood glucose. Therefore, detecting these risk factors in clinics and continuous monitoring are of great significance for the prevention and treatment of ischemic stroke. Therefore, the clinical indicators used in this study mainly include 6 BEFAST clinical symptoms of patients, NIHSS scores, blood pressure, BMI, blood sugar, Hcy, Lp(a), Apo-A, D-D, FBG and other 15 indicators, as shown in Table 1.
(2) Quantitative Electroencephalogram Data
At present, CT and MRI techniques provide an objective reference for the diagnosis of ischemic stroke in clinics, but neither cranial CT nor MRI can achieve real-time monitoring of changes in ischemic lesions in the brain [18]. As a monitoring tool that can effectively reflect brain function, electroencephalogram has unparalleled advantages, but traditional electroencephalogram often adopts visual analysis methods, and the results are more subjective. Quantitative electroencephalogram (QEEG) mainly converts the basic elements of electroencephalogram such as frequency, rhythm, amplitude, and waveform into various quantized parameters through functional models by frequency domain or time domain analysis [19], making the analysis results more objective and easier for clinicians to read and understand. Studies have analyzed the correlation between QEEG features and CT perfusion imaging parameters, as well as their correlation with NIHSS scores. It is found that QEEG can dynamically monitor changes in ischemic lesions in stroke [20] and assist doctors in dynamically evaluating patients' neurological deficits.
This paper examines QEEG in patients using a digital dynamic electroencephalogram recording and analysis system to calculate α wave index, θ wave index, δ wave index, slow wave index, δ and α power ratio (delta-alpha power ratio. DAR), α and δ power ratio (alpha-delta power ratio, ADR), δ+ θ and α+β power ratio [(delta+ theta)/(alpha+ beta), DTABR], as well as relative α wave power (relative alpha power, RAP), relative δ wave power (relative delta power, RDP), and brain symmetry index (brain symmetry index, BSI). Studies have found [21] that δ wave index, slow wave index, θ wave index, BSI, ADR, and DTABR, the six main indicators, are correlated with NIHSS scores. Therefore, this article collects these 6 QEEG features of patients as indicators to determine ischemic stroke, as shown in Table 2.
Table 2. Diagnostic significance of QEEG features for ischemic stroke
|
Serial No. |
QEEG feature |
Diagnostic significance |
|
1 |
δ wave index |
δ wave corresponds to the infarction center and is positively correlated with NIHSS score. If the slow wave index in the ischemic lesion area increases, the δ wave index on the affected side is greater than that on the healthy side. |
|
2 |
Slow wave index |
Positively correlated with NIHSS score, if the slow wave index in the ischemic lesion area increases |
|
3 |
θ wave index |
θ wave is related to ischemic penumbra, brain edema and neurofunctional separation |
|
4 |
BSI |
Positively correlated with NIHSS score, if BSI increases in the ischemic lesion area |
|
5 |
ADR |
Negatively correlated with NIHSS score, if ADR decreases in the ischemic lesion area |
|
6 |
DTABR |
Negatively correlated with NIHSS score, if DTABR decreases in the ischemic lesion area |
(3) MRI Image Data
Magnetic resonance imaging (MRI) technology can accurately detect ischemic and infarcted tissues in the early stage of stroke. Studies have found [22] that diffusion-weighted imaging (DWI) can explore brain edema in the early stage of ischemic stroke, and it is superior to conventional MRI in distinguishing new and old infarcts. It is generally suitable for early exploration. The combined use of diffusion-weighted imaging (DWI) and perfusion-weighted imaging (PWI) can more reliably identify ischemic penumbra and reduce damage, which is beneficial to improve prognosis [23]. In the collected ischemic stroke dataset, each patient underwent routine sequence magnetic resonance imaging (MRI), PWI and DWI examinations. The input images in this paper are eight modalities: T1c, T2, cerebral blood flow (CBF), cerebral blood volume (CBV), diffusion-weighted imaging (DWI), time to peak (Tmax), and mean transit time (MTT) and time to peak of contrast (TTP) in PWI.
2.2 Data preprocessing
The types and formats of the collected data are not uniform, and may contain missing values, outliers, duplicate values, inconsistent data formats, incomplete data, etc. These data may have a negative impact on the accuracy of the model. Therefore, data cleaning and preprocessing are very necessary in the deep learning process to complete data cleaning and make it suitable for deep learning models, thereby further improving the accuracy and efficiency of deep learning models. The data preprocessing operations after importing the dataset in this paper include the following:
(1) Data statistical analysis
Perform preliminary exploratory data analysis on the collected data, including some basic statistical analyses such as mean, variance, standard deviation, maximum and minimum values. Through these analyses, the distribution of the data can be understood and some outliers and missing values can be identified.
(2) Treatment of outliers
If outliers are directly deleted, the sample size will be insufficient and the distribution of variables will be changed. This paper uses the mean correction method to fill in outliers, that is, to correct the outliers with the mean of the two previous observations.
(3) Treatment of missing values
In actual data, there may be missing values in the collected data due to human error, system error or data collection problems. This paper uses the method of calculating the mean to fill in missing values. First calculate the mean of the column or row containing any missing values and fill it in the position of the missing values.
(4) Data normalization
In deep learning, different algorithms may have different requirements for the format of data. Therefore, it is necessary to convert and standardize the data so that the algorithm can work better. This paper implements data standardization and normalization by normalizing the data with standard deviation. All data are converted into numbers between [0,1] to eliminate the magnitude difference between each dimension data and avoid the network prediction error being too large due to the large difference in magnitude between input and output data. The calculation is shown in formula (1).
$X^{\prime}=\frac{X-X \cdot \min }{X \cdot \max -X \cdot \min }$ (1)
where, X.min is the minimum value in the indicator X data, and X.max is the maximum value in the indicator X data.
(5) Division of datasets
Dividing the dataset into training set and test set is one of the key steps in data preprocessing. It can improve the performance of machine learning models. The training set is used to train the model. By trying different methods and ideas, different models are trained using the training set. The model with the best performance is selected. Finally, the test set is used to evaluate the performance of the model. In this paper, the 500 patient dataset study objects were classified in a ratio of 8:2, with 400 in the training set and 100 in the test set.
3.1 Problem description
The research of auxiliary diagnosis for ischemic stroke can be defined as: given datasets $D=\left\{\left(d_{i 1}, d_{i 2}\right)\right\}_{i=1}^N$ and $R=\left\{r_i \in\{0,1\}\right\}$.
where, i represents the i-th patient, D represents the diagnosis data of this patient. This paper considers diagnostic indicators for ischemic stroke, which consists of clinical indicator data and quantitative electroencephalogram (QEEG) data, where di1 represents the clinical indicator data of the i-th patient, di2 represents the QEEG data of the i-th patient. R represents the diagnosis label for each patient, taking value 0 indicates non-ischemic stroke, and 1 indicates ischemic stroke. After conversion, the input features and corresponding labels are shown in formulas (2) and (3).
$X=\left\{x_1, x_2, \cdots \cdots x_n\right\}$ (2)
$Y=\left\{y_1, y_2, \cdots \cdots y_n\right\}$ (3)
In the formula above, n represents the number of patients, xi represents the input features of the i-th patient, yi represents the diagnosis label for the i-th patient, $y_i \in r_i$. The target of the auxiliary diagnosis model is to obtain the mapping relationship between the input features and the diagnosis label through neural network training based on the input patient data, and finally give the result of whether it is ischemic stroke.
3.2 Auxiliary diagnosis model construction
Considering the diversity, difference and correlation of the input feature information, this paper constructs an auxiliary diagnosis model for ischemic stroke based on LSTM and multi-feature fusion. At the same time, research proves that [24] the attention mechanism can improve the model's prediction accuracy by helping the model learn the correlation information between multiple features, so an attention mechanism is considered in the LSTM model. The multi-feature bidirectional LSTM network designed in this paper is shown in Figure 1, which includes two feature extraction submodules and one disease classification submodule.
Figure 1. A multifeature bidirectional LSTM network model
(1) Clinical indicator feature extraction submodule
This module realizes the feature extraction of clinical indicator data through a bidirectional LSTM model. The data consists of 15 input indicators selected in section 2.1(1) related to ischemic stroke lesions, with each indicator dimension being 1. 32 neural units are set in the bidirectional LSTM model, and a Dropout layer is added to prevent model overfitting.
(2) QEEG data feature extraction submodule
The QEEG data features mainly contain numerical indicators. The design of the submodule consists of an input layer, bidirectional LSTM layer and Dense connection layer. The 6 numerical indicators in section 2.1(2) are concatenated to form a feature vector and input into the bidirectional LSTM model. Then the bidirectional LSTM is used for feature learning, with 32 neural units calculating forward and backward features as input and outputting doubled feature vectors, with the connection mode of bidirectional LSTM being concat. Finally, Dropout with 0.5 is used to drop neurons in the network to reduce model overfitting, and a Dense connected layer outputs the feature vector.
(3) Disease classification submodule
The disease classification submodule is first responsible for connecting the feature vectors output by each feature extraction submodule and outputting the diagnosis result by the classifier. The feature vectors output by each submodule are expanded into 3D vectors that meet the input requirements of the self-attention mechanism through Lambda, and then the feature vectors are concatenated and self-attention is applied to output a feature vector by weighting the feature vectors from different modules. The dimension is compressed by Flatten, and the result is output by two Dense connected layers. Since the classification label has been converted to binary category when input, the last Dense layer outputs the classification result.
3.3 Model evaluation and experimental results
3.3.1 Diagnosis comparison experimental settings
In order to verify the effectiveness of the network in Figure 1 for auxiliary diagnosis of ischemic stroke, the following three groups of experiments were set up for result comparison.
(1) Different multifeature extraction submodel design experimental comparison
To compare the differences in performance of different designs of the proposed feature submodels, two groups of feature diagnosis models with different combinations were constructed, referred to as LSTM-LSTM and bidirectional LSTM-bidirectional LSTM according to the feature submodels.
(2) Comparison experiments of single feature models and multi-feature fusion models
To verify the effect of the proposed dual-feature fusion model (clinical indicators + QEEG data) on feature learning in the diagnosis of ischemic stroke disease compared with single feature learning, LSTM and bidirectional LSTM diagnosis models were established for each feature and used for the diagnosis of ischemic stroke as contrast experiments with the proposed model.
(3) Comparison experiment by adding attention mechanism
The attention mechanism was added to the model in this experiment to highlight the degree of attention to features from different examinations, and the experimental results were compared.
3.3.2 Explanation of experimental evaluation standards
The experiments adopted evaluation indicators that measure the reliability of disease determination in clinical diagnosis, including accuracy, sensitivity, specificity, positive predictive value, negative predictive value and F1_Score.
where, TP represents true positive, FP represents false positive, FN represents false negative, TN represents true negative.
(1) Accuracy
Calculating the number of samples predicted correctly/total number of samples, the calculation formula is as follows:
$A c c=\frac{T P+T N}{T P+F P+F N+T N}$ (4)
(2) Sensitivity
It measures the ability to correctly determine that a patient has ischemic stroke, and calculates how many of the true ischemic stroke positive samples are truly predicted to be ischemic stroke patients. High sensitivity indicates a low miss rate, and the calculation formula is as follows:
Sensitivity $=\frac{T P}{T P+F N}$ (5)
(3) Specificity
It measures the ability to correctly identify patients without ischemic stroke. It is calculated by determining how many of all true non-ischemic stroke negative samples are accurately predicted to have non-ischemic stroke. Higher specificity indicates a lower false positive rate, as shown in the formula:
Specificity $=\frac{T N}{T N+F P}$ (6)
(4) Positive predictive value
It calculates how many of the positive samples in the predicted samples are predicted correctly, calculates the true ischemic stroke patients among those predicted to have ischemic stroke, and the calculation formula is as follows:
$P P V=\frac{T P}{T P+F P}$ (7)
(5) Negative predictive value
It calculates how many of the negative samples in the predicted samples are predicted correctly, calculates the true non-ischemic stroke patients among those predicted to have non-ischemic stroke, and the calculation formula is as follows:
$N P V=\frac{T N}{T N+F N}$ (8)
(6) F1_Score
It balances precision and recall by calculating the harmonic mean of the two, here it is calculating the harmonic mean between PPV and sensitivity, and the calculation formula is as follows:
$F 1 \_$Score $=\frac{2 \times P P V \times \text { Sensitivity }}{P P V+\text { Sensitivity }}$ (9)
3.3.3 Experimental results of auxiliary diagnosis
(1) Experimental results of different network models
First, experiments compared the diagnosis of ischemic stroke disease using different network models, including LSTM-LSTM and bidirectional LSTM-bidirectional LSTM models. The experimental results comparison is shown in Table 3.
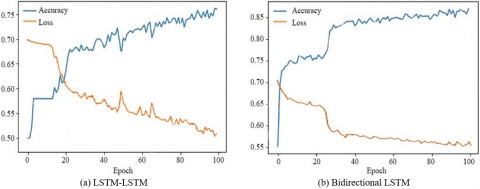
As shown in Table 3, the bidirectional LSTM-bidirectional LSTM model overall accuracy has increased compared to the LSTM-LSTM model, indicating that using bidirectional LSTM as the hidden layer played a role in capturing reverse sequence feature information in feature extraction, The accuracy and loss changes during the training process of the two multi-feature models are shown in Figure 2 respectively.
(2) Comparison of separate feature model and multi-feature combined model experiments
To compare the effect of fusing two types of patient feature data on the diagnosis of ischemic stroke disease, separate diagnosis models for single features were established in the experiment. The comparison results of single feature diagnosis models and multi-feature diagnosis models are shown in Table 4.
Table 3. Comparison of experimental results of different network models
|
Model |
Accuracy |
Sensitivity |
Specificity |
Positive predictive value |
Negative predictive value |
F1_Score |
|
LSTM-LSTM |
0.72 |
0.78 |
0.69 |
0.72 |
0.76 |
0.75 |
|
Bidirectional LSTM |
0.81 |
0.82 |
0.80 |
0.80 |
0.81 |
0.81 |
Table 4. Comparison of single feature diagnosis models and multi-feature diagnosis models
|
Model |
Accuracy |
Sensitivity |
Specificity |
Positive predictive value |
Negative predictive value |
F1_Score |
|
Clinical indicators-LSTM |
0.64 |
0.60 |
0.69 |
0.72 |
0.63 |
0.65 |
|
QEEG data-LSTM |
0.71 |
0.61 |
0.70 |
0.73 |
0.65 |
0.66 |
|
Clinical indicators-bidirectional LSTM |
0.64 |
0.59 |
0.72 |
0.68 |
0.61 |
0.63 |
|
QEEG data-bidirectional LSTM |
0.77 |
0.67 |
0.79 |
0.80 |
0.64 |
0.73 |
|
Multi-feature bidirectional LSTM-bidirectional LSTM |
0.81 |
0.81 |
0.79 |
0.80 |
0.80 |
0.80 |
Table 5. Comparison of experimental results of models with added attention mechanism
|
Model |
Accuracy |
Sensitivity |
Specificity |
Positive predictive value |
Negative predictive value |
F1_Score |
|
LSTM-LSTM |
0.73 |
0.78 |
0.68 |
0.72 |
0.75 |
0.75 |
|
LSTM-LSTM-ATT |
0.78 |
0.82 |
0.73 |
0.76 |
0.79 |
0.79 |
|
Bidirectional LSTM-bidirectional LSTM |
0.80 |
0.81 |
0.79 |
0.80 |
0.80 |
0.81 |
|
Bidirectional LSTM-bidirectional LSTM-ATT |
0.84 |
0.89 |
0.78 |
0.81 |
0.87 |
0.85 |
Figure 2. The accuracy and loss changes during the training process of the two multi-feature models
Table 4 reveals that in this experiment, diagnostic results for two distinct types of inspection feature data using single LSTM models, single bidirectional LSTM models and the multi-feature bidirectional LSTM-bidirectional LSTM model proposed in this paper were compared. Compared to the evaluation outcomes of single feature models and single bidirectional LSTM models, the overall performance of the multi-feature bidirectional LSTM-bidirectional LSTM model reached 80%, giving play to the advantage of multi-feature information complementing each other.
(3) Experiments adding attention mechanism for comparison
In view of the role of the attention mechanism in weighting key features, this experiment added the self-attention mechanism at the multi-feature level based on the comparison of (1) models. The experimental results comparison is shown in Table 5.
As the table above shows, by adding the self-attention mechanism to both models, compared to the sensitivity and specificity of each model under self-attention, the ability to accurately diagnose ischemic stroke and non-ischemic stroke improved. In the model proposed in this paper, the ability to correctly determine ischemic stroke disease reached 89%. The positive predictive value and negative predictive value increased overall and achieved balance, indicating that the model reduced the likelihood of clinical misdiagnosis. Under the self-attention mechanism, the overall prediction accuracy of the multi-feature model remained stable or increased, demonstrating the effectiveness of the self-attention mechanism in improving model accuracy.
4.1 MRI image segmentation process
Image segmentation needs to segment lesions in MRI images and obtain information such as location, shape, etc. of stroke. Due to the structural diversity of brain tissue itself and the blurred boundaries around stroke caused by cerebral occlusion during stroke, the difference in pixel values between ischemic stroke lesions and adjacent normal tissues is very small, and the random changes in size, shape and location of lesions as well as unbalanced sample training data will affect detection accuracy in computer-aided diagnosis. To solve the difficulties of brain stroke lesion segmentation, the network structure needs to be designed according to the features of ischemic stroke in size, gray scale and contrast with surrounding tissues. The flow chart of the segmentation algorithm for ischemic stroke in this paper is shown in Figure 3, and the process is as follows:
(1) Acquire multi-modal MRI examination images of patients;
(2) Divide the acquired images into training set and test set;
(3) Perform normalization preprocessing on the divided data, and this paper adopts the image transformation method in literature [25] to perform data intensity normalization, while reserving the gray scale difference with diagnostic value, reducing and eliminating the phenomenon of inconsistent gray scale in the image. The specific method is to subtract the mean of the pixel values and then divide by the variance, so that the gray distribution reaches a normal distribution with mean 0 and standard deviation 1.
(4) Perform data augmentation after preprocessing to expand the training data to 4 times by rotating the extracted image blocks by 90°, 180°, and 270° to alleviate the overfitting problem that is easily encountered during training with small datasets;
(5) Model training. The optimal trained model is obtained through a series of operations such as feature extraction, forward propagation of features, reverse adjustment of parameters, and iterations;
(6) Save the model, and evaluate the performance of the model of this iteration with evaluation indicators (DICE coefficient) after each iteration operation and save the optimal training result during the iteration process;
(7) Test on the test set. Using the model saved in (6) to test the test set data and save the corresponding prediction results;
(8) Quantify the segmentation performance based on the prediction results and analyze whether the network model used is effective.
Figure 3. Flowchart of deep learning-based ischemic stroke segmentation algorithm
4.2 Network structure design for lesion area segmentation
The MRI medical images contain three-dimensional context information of the image, in order to fully utilize the depth information of three-dimensional medical images, multi-scale three-dimensional convolutional neural networks (3DCNN) are used to realize the three-dimensional segmentation of ischemic stroke lesions. Using MRI image blocks sampled as the network input can avoid the class imbalance phenomenon that often occurs in medical images and obtain more detailed segmentation. The algorithm in this paper introduces residual units [26] and cascade ideas [27] to the 3DCNN network structure to solve the problems of gradient disappearance or gradient explosion when the number of layers increases and achieve higher precision segmentation of lesions.
In traditional neural networks, especially in image processing, very many convolutional layers, pooling layers, etc. are often used, and each layer extracts features from the previous layer, so degradation problems generally occur as the number of layers increases. Residual networks avoid a series of problems brought by deep neural networks using jump connections. The ResNet model structure is composed of repeated stacking of the same ResNetblock.
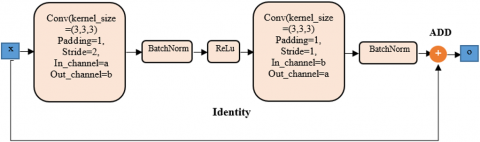
The three-dimensional residual block consists mainly of two 3D convolutional layers (3DConv), 2 BN, an ReLU activation function and an identity connection, as shown in Figure 4. In this paper, 3D-ResNet uses three-dimensional convolutional layers as the basic constituent units of residual blocks. BN operations are added after each convolutional layer. Combining convolution with BN improves the training efficiency of 3D-ResNet.
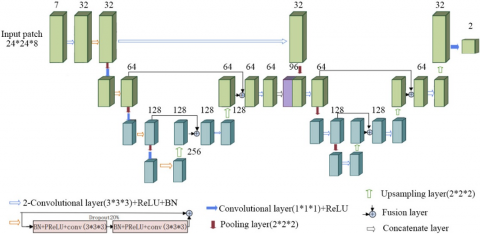
Research shows that U-Net performs well on medical images [28] because the encoding and decoding structure of U-Net with jump connections can fuse features at different levels. The fixed structure and small sample size of medical images together make U-Net the best model in the field of medical image segmentation [29]. A cascaded 3D deep residual network model structure is shown in Figure 5.
As shown in the figure above, all convolutional layers use 3*3*3 convolutional kernels with stride 1 for feature extraction, and batch normalization (BN) and rectified linear units (ReLU) are used in all convolutional layers to accelerate network training speed and enhance gradient backpropagation. Due to the loss of too much spatial information when pooling operations reduce spatial dimensions, the network uses convolutions to replace pooling operations. A convolutional layer with kernel size 3*3*3 and stride 2 is fused with a pooling layer with kernel size 2*2*2 and stride 2 to form a down-convolution module.
In order to make the resolution of the segmentation result the same as the input image size, transposed convolutions with kernel size 2*2*2 and stride 2 are used for upsampling in the decoding path of the network. Finally, a convolution with kernel size 1*1*1 converts the feature map into foreground and background parts.
Figure 4. 3DResNetblock
Figure 5. Ischemic stroke segmentation network model structure
4.3 Lesion segmentation experimental results
In order to further analyze the effectiveness of the ischemic stroke lesion segmentation algorithm proposed in this paper, multi-scale CNN, 3D cascaded U-Net algorithm, 3D residual U-Net algorithm and the cascaded 3D deep residual network algorithm proposed in this paper were used to evaluate the diagnostic results and experimental segmentation results in terms of DICE coefficient, accuracy, sensitivity and other indicators. The comparison of segmentation evaluation indicators of the four different algorithms on the training set and test set is shown in Tables 6 and 7 respectively.
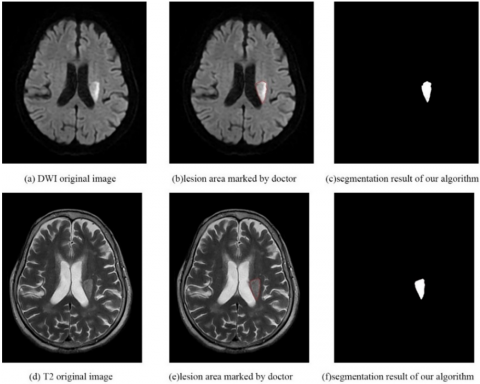
As shown in Figures 6 and 7, the segmentation results of the cascaded 3D deep residual network algorithm are similar to the delineated lesions marked by doctors, indicating that this network can quickly automatically detect and accurately segment lesions to assist doctors in quickly and accurately locating patient lesion areas for the next treatment.
In summary, the cascaded 3D deep residual network algorithm proposed in this paper has better performance than other comparison algorithms in segmentation accuracy, sensitivity and other evaluation indicators, which demonstrates the effectiveness of the algorithm in segmenting ischemic stroke lesions from MRI images.
As shown in Figures 6 and 7, the segmentation results of the cascaded 3D deep residual network algorithm are close to the delineated lesions marked by doctors, indicating that this network can quickly and automatically detect and segment lesions with high precision to assist doctors in quickly and accurately locating patient lesion areas for the next treatment.
Table 6. Training set segmentation evaluation indicators
|
Algorithm |
DICE mean (Standard deviation) |
Accuracy mean (Standard deviation) |
Sensitivity mean (Standard deviation) |
|
Multi-scale CNN |
0.85(0.08) |
0.83(0.11) |
0.88(0.08) |
|
3D Cascaded U-Net |
0.92(0.08) |
0.95(0.08) |
0.90(0.10) |
|
3D Residual U-Net |
0.90(0.07) |
0.90(0.09) |
0.90(0.07) |
|
The algorithm in this study |
0.91(0.05) |
0.94(0.06) |
0.89(0.06) |
Table 7. Test set segmentation evaluation indicators
|
Algorithm |
DICE mean (Standard deviation) |
Accuracy mean (Standard deviation) |
Sensitivity mean (Standard deviation) |
|
Multi-scale CNN |
0.76(0.10) |
0.75(0.11) |
0.75(0.15) |
|
3D Cascaded U-Net |
0.79(0.11) |
0.83(0.11) |
0.77(0.15) |
|
3D Residual U-Net |
0.78(0.16) |
0.79(0.14) |
0.79(0.20) |
|
The algorithm in this study |
0.81(0.11) |
0.81(0.12) |
0.81(0.14) |
Figure 6. MRI original image of Case 1, lesion area marked by doctors and segmentation result of this study
Figure 7. MRI original image of Case 2, lesion area marked by doctors and segmentation result of this study
Currently, ischemic stroke as the main type of stroke, the incidence rate is increasing year by year globally, with high mortality, high disability and multiple complications. Timely diagnosis and determination of treatment plans are key to slowing down the progression of the disease. Currently, clinical diagnosis and localization of lesion areas still rely on doctors manually reading images, which is inefficient, laborious and subjective. Therefore, this paper proposes to build an auxiliary diagnostic model based on deep learning and an automatic lesion segmentation algorithm to help doctors quickly and accurately customize personalized treatment plans based on diagnostic results.
In building an auxiliary diagnostic model for ischemic stroke, considering that the selection of neural network feature types affects the diagnosis accuracy, EEG data is used first due to its advantages of rapidly and sensitively reacting to cerebral ischemia, combining it with clinical indicators in feature selection. A multi-feature pattern recognition method based on "clinical indicators + quantitative electroencephalogram" is proposed to screen 23 key features for neural network training. Meanwhile, attention mechanism is introduced into LSTM to design two feature extraction submodels based on bidirectional LSTM model for different types of examination data, outputting the corresponding feature vectors of each submodule and connecting to self-attention mechanism, allocating weight vectors and inputting to fully connected layer to realize auxiliary diagnosis of ischemic stroke disease. The constructed model can learn the association information between various features to further improve the diagnostic accuracy. Meanwhile, the cascaded 3D deep residual network algorithm is proposed to be applied to the segmentation of ischemic stroke lesion areas. The residual module is introduced in the segmentation architecture to avoid the problem of gradient disappearance caused by the increase of network depth and solve the problem of difficult subdividing of lesions due to unclear features and boundaries.
Although experiments prove that the overall completion of the patient's ischemic stroke auxiliary diagnosis function and automatic segmentation of ischemic stroke lesions has been realized and high diagnostic accuracy and segmentation precision have been achieved, there are still many aspects that need to be improved and perfected. For example, the training and test data in this paper came from patient data from hospitals, which need manual collection or medical equipment, there are data types or some missing. Although data cleaning and preprocessing have been done, the corrected data may not fully represent the indicators data of ischemic stroke occurrence. At the same time, due to the limited patient sample data, the data generalization ability is still not strong enough, which may affect the accuracy of disease classification diagnosis. In the future, based on the current research, further deepening and expansion is needed, and future research work mainly includes the following two aspects:
(1) In the auxiliary diagnosis model, in order to further improve the system diagnostic accuracy while training a robust neural network with stronger generalization ability, more hospital stroke patient data is needed for training and testing, and the causes of ischemic stroke need to be studied. Medical history data and expert consultation are collected to mine more indicators that can be used for the diagnosis of ischemic stroke to form neural network input features that can comprehensively reflect the symptoms of ischemic stroke.
(2) In the automatic lesion segmentation algorithm, due to the large amount of training data, especially the large number of MRI image modes and image blocks after sampling, the computational amount during network training is relatively large, resulting in relatively slow lesion segmentation speed. Therefore, it is necessary to further optimize the network structure to improve the network performance and accelerate the segmentation speed while ensuring segmentation accuracy to make the running time more efficient to meet the clinical application of hospital systems.
This paper was supported by Zhejiang Provincial Health Science and Technology Plan (Grant No. 2022PY034), New Technology Product R&D Project, Research and Application of Active Passive Collaborative Hemiplegia Rehabilitation System Based on BCI+VR Technology.
[1] Mosconi, M.G., Paciaroni, M. (2022). Treatments in ischemic stroke: Current and future. European Neurology, 85(5): 349-366. https://doi.org/10.1159/000525822
[2] Hacke, W., Kaste, M., Olsen, T.S., Bogousslavsky, J., Orgogozo, J.M. (2000). Acute treatment of ischemic stroke. Cerebrovascular Diseases, 10(S3): 22-33. https://doi.org/10.1159/000047578
[3] Wang, Y.J., Li, Z.X., Gu, H.Q., Zhai, Y., Jiang, Y., Zhou, Q., Zhao, X.Q., Wang, Y.L., Yang, X., Wang, C.J., Meng, X., Li, H., Liu, L.P., (2022). Chinese Stroke Report 2020 (1). Chinese Journal of Stroke, 17(5): 433-447. 10.3969/j.issn.1673-5765.2022.05.001
[4] Miyamoto, S., Ogasawara, K., Kuroda, S., Itabashi, R., Toyoda, K., Itoh, Y., Committee for Stroke Guideline 2021, the Japan Stroke Society. (2022). Japan stroke society guideline 2021 for the treatment of stroke. International Journal of Stroke, 17(9): 1039-1049. https://doi.org/10.1177/17474930221090347
[5] Cetinoglu, Y.K., Koska, I.O., Uluc, M.E., Gelal, M.F. (2021). Detection and vascular territorial classification of stroke on diffusion-weighted MRI by deep learning. European Journal of Radiology, 145: 110050. https://doi.org/10.1016/j.ejrad.2021.110050
[6] Wang, C., Shi, Z., Yang, M., Huang, L., Fang, W., Jiang, L., Wang, H. (2021). Deep learning-based identification of acute ischemic core and deficit from non-contrast CT and CTA. Journal of Cerebral Blood Flow & Metabolism, 41(11): 3028-3038. https://doi.org/10.1177/0271678x211023660
[7] Clèrigues, A., Valverde, S., Bernal, J., Freixenet, J., Oliver, A., Lladó, X. (2020). Acute and sub-acute stroke lesion segmentation from multimodal MRI. Computer Methods and Programs in Biomedicine, 194: 105521. https://doi.org/10.1016/j.cmpb.2020.105521
[8] Debs, N., Cho, T.H., Rousseau, D., Berthezène, Y., Buisson, M., Eker, O., Frindel, C. (2021). Impact of the reperfusion status for predicting the final stroke infarct using deep learning. NeuroImage: Clinical, 29: 102548. https://doi.org/10.1016/j.nicl.2020.102548
[9] Chavva, I.R., Crawford, A.L., Mazurek, M.H., Yuen, M.M., Prabhat, A.M., Payabvash, S., Sheth, K.N. (2022). Deep learning applications for acute stroke management. Annals of Neurology, 92(4): 574-587. https://doi.org/10.1002/ana.26435
[10] Ballard, K.J., Azizi, L., Duffy, J.R., McNeil, M.R., Halaki, M., O’Dwyer, N., Robin, D.A. (2016). A predictive model for diagnosing stroke-related apraxia of speech. Neuropsychologia, 81: 129-139. https://doi.org/10.1016/j.neuropsychologia.2015.12.010
[11] Erani, F., Zolotova, N., Vanderschelden, B., Khoshab, N., Sarian, H., Nazarzai, L., Cramer, S.C. (2020). Electroencephalography might improve diagnosis of acute stroke and large vessel occlusion. Stroke, 51(11): 3361-3365. https://doi.org/10.1161/STROKEAHA.120.030150
[12] Bentes, C., Peralta, A.R., Viana, P., Martins, H., Morgado, C., Casimiro, C., Ferro, J.M. (2018). Quantitative EEG and functional outcome following acute ischemic stroke. Clinical Neurophysiology, 129(8): 1680-1687. https://doi.org/10.1016/j.clinph.2018.05.021
[13] Shojaee, M., Shariffar, F., Sabzghabaei, A., Safari, S., Abadi, H.R.H. (2019). Efficacy of brain MRI as the first choice for patients with ischemic stroke. Journal of Critical Reviews, 7(4): 681-684. https://doi.org/10.31838/jcr.07.04.129
[14] The Chinese Stroke Society released the "2021 World Stroke Day" themed version of the BEFAST poster, on the portal website of the Chinese Stroke Society, 2021. https://chinastroke.net/#/notice?id=1441213239970885634
[15] Rafie, M.Z., Esmaeilzadeh, A., Ghoreishi, A., Tahmasebi, S., Faghihzadeh, E., Elahi, R. (2021). IL-38 as an early predictor of the ischemic stroke prognosis. Cytokine, 146: 155626. https://doi.org/10.1016/j.cyto.2021.155626
[16] Feigin, V.L., Stark, B.A., Johnson, C.O., Roth, G.A., Bisignano, C., Abady, G.G., Hamidi, S. (2021). Global, regional, and national burden of stroke and its risk factors, 1990–2019: A systematic analysis for the Global Burden of Disease Study 2019. The Lancet Neurology, 20(10): 795-820. https://doi.org/10.1016/S1474-4422(21)00252-0
[17] The Writing Committee of the Report on Cardiovascular Health and Diseases in China. (2021). Report on cardiovascular health and diseases burden in China: an updated summary of 2020. Chinese Journal of Circulation, 36(6): 562-586. https://doi.org/10.3969/j.issn.1000-3614.2021.06.001
[18] Zhang, X.H., Liang, H.M. (2019). Systematic review with network meta-analysis: Diagnostic values of ultrasonography, computed tomography, and magnetic resonance imaging in patients with ischemic stroke. Medicine, 98(30): e16360. https://doi.org/10.1097/MD.0000000000016360
[19] Li, J., Zhu, X., Pan, S., Lu, Y., Hu, X. (2022). Utilization of quantitative electroencephalogram in China: An online questionnaire survey. Acta Epileptologica, 4(1): 37. https://doi.org/ 10.1186/s42494-022-00099-9
[20] Babiloni, C., Blinowska, K., Bonanni, L., Cichocki, A., De Haan, W., Del Percio, C., Randall, F. (2020). What electrophysiology tells us about Alzheimer's disease: A window into the synchronization and connectivity of brain neurons. Neurobiology of aging, 85: 58-73. https://doi.org/ 10.1016/j.neurobiolaging.2019.09.008
[21] Appavu, B.L., M'hamed, H.T., Foldes, S.T., Burrows, B.T., Jacobson, A.M., Mangum, T.K., Adelson, P.D. (2022). Quantitative electroencephalography after pediatric anterior circulation stroke. Journal of Clinical Neurophysiology, 39(7): 610-615. https://doi.org/10.1097/WNP.0000000000000813
[22] Wiegertjes, K., Dinsmore, L., Drever, J., Hutchison, A., Stephen, J., Hernández, M.C.V., Wardlaw, J.M. (2021). Diffusion-weighted imaging lesions and risk of recurrent stroke after intracerebral haemorrhage. Journal of Neurology, Neurosurgery & Psychiatry, 92(9): 950-955. https://doi.org/10.1136/jnnp-2021-326116
[23] Cheung, J., Doerr, M., Hu, R., Sun, P.Z. (2021). Refined ischemic penumbra imaging with tissue pH and diffusion kurtosis magnetic resonance imaging. Translational Stroke Research, 12: 742-753. https://doi.org/10.1007/s12975-020-00868-z
[24] Li, Q., Chai, X., Zhang, C., Wang, X., Ma, W. (2022). Prediction model of ischemic stroke recurrence using PSO-LSTM in mobile medical monitoring system. Computational Intelligence and Neuroscience, 2022: Article ID: 8936103. https://doi.org/10.1155/2022/8936103
[25] Nyúl, L.G., Udupa, J.K., Zhang, X. (2000). New variants of a method of MRI scale standardization. IEEE Transactions on Medical Imaging, 19(2): 143-150. https://doi.org/10.1109/42.836373
[26] Alaeddine, H., Jihene, M. (2021). Deep residual network in network. Computational Intelligence and Neuroscience, 2021: Article ID: 6659083. https://doi.org/10.1155/2021/6659083
[27] Huang, Z., Chen, Z., Quan, G., Du, Y., Yang, Y., Liu, X., Hu, Z. (2022). Deep cascade residual networks (DCRNs): Optimizing an encoder–decoder convolutional neural network for low-dose CT imaging. IEEE Transactions on Radiation and Plasma Medical Sciences, 6(8): 829-840. https://doi.org/10.1109/TRPMS.2022.3150322
[28] Zunair, H., Hamza, A.B. (2021). Sharp U-Net: Depthwise convolutional network for biomedical image segmentation. Computers in Biology and Medicine, 136: 104699. https://doi.org/10.1016/j.compbiomed.2021.104699
[29] Zoetmulder, R., Bruggeman, A.A., Išgum, I., Gavves, E., Majoie, C.B., Beenen, L.F., Marquering, H.A. (2022). Deep-learning-based thrombus localization and segmentation in patients with posterior circulation stroke. Diagnostics, 12(6): 1400. https://doi.org/10.3390/diagnostics12061400