Zhenghong Liu![]() | Yuliang Xu
| Yuliang Xu![]() | Tao Hu*
| Tao Hu*![]()
© 2023 IIETA. This article is published by IIETA and is licensed under the CC BY 4.0 license (http://creativecommons.org/licenses/by/4.0/).
OPEN ACCESS
Virtual reality (VR) systems have been used in various industries. Highly effective human-computer interaction (HCI) and natural HCI experience have become the key indicators for evaluating a VR system, where target selection is the key for interaction efficiency and experience. In this paper, we propose a moving target selection prediction model, based on the probabilistic Fitts's Law and in combination with decision trees, for moving target selection in VR systems. Firstly, we verified the feasibility of predicting the user intention based on the size and distance of moving targets in VR scenarios through two selection task experiments with a sphere as the target. Then, also through two experiments, we proposed an improved moving target prediction model by factoring in head posture with target size and distance and taking into account the influence of head orientation. Based on the decision tree algorithm, we calculated its prediction accuracy and compared it with the distance scoring function. The results show that the improved prediction model has significantly better accuracy and can accurately predict the user's moving target selection intention in a VR system.
Fitts's Law, decision trees, VR systems, moving target selection
In virtual reality (VR) environments, the user is not constrained to sit at a computer. Instead, the user interacts with VR environments with 3D input and output, which makes the interaction theories of metaphor at 2D graphical user interface unable to meet the human-computer interaction (HCI) requirements in VR. It requires new HCI methods, input and output theoretical models and interaction metaphors. Target selection behaviour modelling refers to the experimental fitting of existing theoretical models with the help of relevant mathematical models, along with HCI and human-computer ergonomics data, in order to achieve theoretical modelling of user interaction behaviour.
Target selection tasks are an important modality of HCI in VR. One of the main and most common tasks of interactive VR systems is target selection for menus, buttons or other objects. The most common technique to assist users in target selection is ray casting, a virtual pointing technique that allows users to select targets beyond their area of reach and requires little physical movement. Ray casting has been widely used in current mainstream VR systems such as the Oculus Rift and the HTC Vive and plays an important role in allowing users to perform target selection tasks in VR environments thanks to its universal, flexible and effective virtual pointing.
When building scenarios for target selection in VR environments, designers rely heavily on their own subjective perceptions to design scenarios, making them unconvincing. It is therefore necessary to conduct experimental research on HCI and ergonomics in target selection tasks in VR environments, and to construct corresponding target selection models to provide designers with a rationale for building relevant scenarios. There are two types of target selection models: static and moving. Static target selection models focus on the study (modelling) of interactive interface elements, involving design factors such as element size and position. Moving target selection models are studied (modelled) for moving elements in VR environments.
User goal selection models are dominated by Fitts's Law, a behavioural model of human movement and in particular user goal selection, which has been widely used in human-computer engineering and HCI. In 1992, Dr Fitts proposed the original version of Fitts's Law inspired by Shannon's Theorem 17 in informatics [1]. Mckenzie and Buxton [2] proposed that Fitts's Law can be used for prediction and measurement. Table 1 shows the most used versions of Fitts's law and its variants until 2003. Goldberg et al. [3] compared the performance of models 1, 3 and 4 in Table 1. The results showed that the square-root model proposed by Meyer et al. [4] was more suitable for fixed W and A targets except the most difficult targets (with large A/W). In addition, several studies have extended Fitts's Law. Zhang et al. [5] investigated a control theory that could be an alternative to Fitts's Law based on an improved crossover model. Tang et al. [6] proposed that the performance of the previous trial had a predictable effect on the next trial when Fitts's Law was used in measuring. Bertucco et al. [7] investigated quick pointing action. At the level of motor planning, they tested the relationship between movement time (MT) and index of difficulty (ID). The results showed that due to different moving parts, changes in movement distance may lead to changes in the relation between MT and ID. Bernhaupt et al. [8] argued that in terms of MT, the shortest MT should be considered in addition to the average time. Glazebrook et al. [9] showed that thanks to a more efficient online control process, MTs to the last target location in an array are shorter than predicted by Fitts's Law. Petrič et al. [10] showed that Fitts's Law may not be applicable to cyclic impact tasks.
Table 1. The pre-2003 Fitts models
|
No. |
Year |
Author |
Models |
Model name |
|
1 |
1954 |
Fitts |
$\mathrm{MT}=\mathrm{a}+\mathrm{blog}_2(2\!\mathrm{~A} / \mathrm{W})$ |
Original model |
|
2 |
1968 |
Welford |
$\mathrm{MT}=\mathrm{a}+\mathrm{blog}_2(\mathrm{~A} / \mathrm{W}+0.5)$ |
\ |
|
3 |
1988 |
Meyer |
$\mathrm{MT}=\mathrm{a}+\mathrm{b} \sqrt{\mathrm{A} / \mathrm{W}}$ |
Square-root model |
|
4 |
1992 |
MacKenzie |
$\mathrm{MT}=\mathrm{a}+\mathrm{blog}_2\left(\mathrm{~A} / \mathrm{W}_e+1\right)$ |
We model |
Table 2. Fitts's Law extended models
|
No. |
Year |
Author |
Models |
Model name |
|
1 |
2013 |
Cha |
$\mathrm{MT}=\mathrm{a}+\mathrm{b} \theta_1+\mathrm{csin} \theta_2+\mathrm{dlog}{ }_2(2 \mathrm{~A} /(\mathrm{W}+\mathrm{F}))$ |
3D model |
|
2 |
2018 |
Murata |
$\mathrm{MT}=\mathrm{a}+\mathrm{blog} _2(\alpha \beta(\mathrm{A} / \mathrm{W})+1)$ |
3D model |
Table 2 shows the current extended models of Fitts's Law. Cha and Myung [11] proposed a variant of Fitts's Law equation (model 1 in Table 2) that can be applied in a 3D environment. Based on empirical data, the model fits better than previous models for 3D tasks. Murata and Fukunaga [12] proposed model 2 in Table 2, focusing on a 3D eye-gaze input system, and the results showed that the model fits the experimental data well and predicts pointing times for various HCI tasks more effectively. The above two models demonstrate the feasibility of introducing Fitts's Law into a 3D environment.
Dynamic target selection is a hot topic in the field of HCI research, and the extension to virtual reality scenarios is also important. However, most of the current researches focus on static targets selection [13-16]. In recent years, for the problem of moving target selection, some scholars have enhanced pointing by extending the alternative targets or setting up more easily achievable agents for each target [17].
3.1 Minimum mental effort and Fitts's Law’s ID
The middle choice between identical objects minimises the ID of Fitts's Law, as shown in Eq. (1). Recent research has also shown that the objects with the minimum Fitts's Law’s ID minimise mental effort.
$I D=\log _2\left(\frac{D}{W}+1\right)$ (1)
In this paper, the user intention in dynamic target selection is predicted according to the influence of mental work on ID value. we assume that the ID of the Fitts or another function of the size and distance of the target predicts user intent in a dynamic target selection task. According to the initial segment strategy, when the target tasks are selected in order, ID for the first target is a better predictor of user selection intent than the sum of ID for the other targets in the task sequence.
3.2 Validation experiments
(1) Apparatus and participants
The experiment used Rhino for 3D modelling, UE4 blueprints for the experimental scenes and HTC Vive as the input device. Twenty-six volunteers on campus aged between 23 and 47 were selected to participate in this experiment. There were 18 males and 8 females, two of the participants were left-handed and the rest were all right-handed.
(2) Design
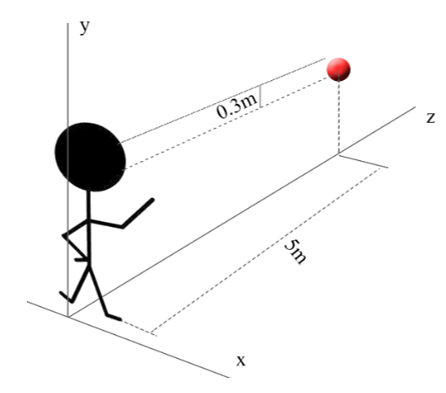
The experiment was divided into two sub-experiments, each presenting a different number of target spheres randomly. In each sub-experiment, all spheres appeared 0.3m below the participant's head (Pi,y=Ph,y-0.3), 5m away from the participant (Pi,z=-5), as shown in Figure 1.
Figure 1. Spatial position of the participant in relation to the sphere
Sub-experiment 1
In sub-experiment 1, there was only one experimental sphere, shifting with a fixed velocity of 2.5 m/s along the z-axis, and the experimental variables are the radius of the sphere(r1=[0.1,0.2]) and the position of the sphere with respect to the participant (left: x-axis -0.5, middle: origin position, right: x-axis 0.5). Six experimental spheres were randomly combined and show to the participants randomly until five rounds were completed for each type of sphere (i.e., 30 trials were performed).
Sub-experiment 2
Upon completion of sub-experiment one, the number of spheres becomes 2, the speed was reduced to 1.5 m/s along the z-axis, and the two spheres were separated by 0.5 m. However, the three positions of the two spheres on the x-axis are (-0.5, -0.25, 0) and (0, 0.25, 0.5) relative to the participant, as shown in Figure 2. The experimental variables were the sphere radius and the position of the sphere pair relative to the participant (left, centre, right). The experimental conditions (12) were presented randomly, with 5 experiments per condition, or 60 experiments per person.
(3) Procedure
The experimenter was instructed to stand within the designated area of the experimental scene and was asked to complete all target selection tasks for the experiment. During the experiment, a set of virtual balls with different horizontal positions and sizes moved in front of the participant and flew towards the participant along the z-axis. When the sphere approached, the participant was asked to reach out and touch it, rather than holding out his hand and waiting for the ball to come. When the sphere was touched by the participant or when it passed 0.5m above the experimenter's head in the z-axis, the sphere automatically disappeared. An experiment ended when all spheres were touched or 0.5m above the experimenter's head. In this experiment, auditory and tactile feedback were also designed to prompt the participant' s performance. When the sphere was touched, the participant would hear a prompt tone and the handle of his hand would twitch slightly.
Figure 2. Spatial position of the experimental spheres
The task completion time, the head pose (Ph, Qh), the handle pose (Pw, Qw), the sphere position, the contact between handle and ball were recorded in detail during the experiment.
(4) Analysis of experimental data
Experiments in which the participant had no contact with any of the spheres were deleted. The following values were calculated from the initial position of the handle, the diameter of the ball, and the initial position of the ball.
The distance between the handle and the sphere is shown in Eqns. (2) and (3).
$D_1=\left|P_w-P_1\right|$ (2)
$D_1=\left|P_w-P_2\right|$ (3)
where, Pw is the initial position of the handle and P1, P2 is the initial position of the sphere.
The task difficulty index between the handle and the sphere is shown in Eqns. (4) and (5).
$I D_1=\log _2\left(\frac{D_1}{W_1}+1\right)$ (4)
$I D_2=\log _2\left(\frac{D_2}{W_2}+1\right)$ (5)
where, W1, W2 is the diameter of the sphere.
The inter-sphere distance is shown in Eq. (6).
$D_{s p h}=\left|P_2-P_1\right|$ (6)
The inter-sphere task difficulty index is shown in Eqns. (7) and (8).
$I D_{1,2}=\log _2\left(\frac{D_{s p h}}{W_2}+1\right)$ (7)
$I D_{2,1}=\log _2\left(\frac{D_{s p h}}{W_1}+1\right)$ (8)
The total task difficulty index is shown in Eqns. (9) and (10).
$I D_{n_1}=I D_1+I D_{1,2}$ (9)
$I D_{n_2}=I D_2+I D_{2,1}$ (10)
The feature sets were evaluated based on the J48 classifier in the Weka machine learning suite. The feature sets that need to be evaluated are $\left\{I D_{n_1}, I D_{n_2}\right\}$, $\left\{I D_{1,2}, I D_{2,1}\right\}$, $\left\{I D_1, I D_2\right\}$ and $\left\{D_1, D_2, r_1, r_2\right\}$. The evaluation results were used to predict the target selection of the sphere.
The classifier recursively selects decision nodes based on yielding the maximum information gain. The value of feature (F) is divided by the reduction of entropy (R) on the training set (T).
$I(T, F)=R(T)-R(T \mid F)$ (11)
$R(T)=-p_1 \log _2 p_1-p_2 \log _2 p_2$ (12)
$R(T \mid F)=\sum_{v \in \operatorname{Value}(F)}\, \frac{T_V}{|T|} R\left(T_v\right)$ (13)
where, pi is the relative frequency of the sphere i(sphi) in the set T and Tv corresponds to the subset obtained by dividing T with the value v of the feature F. The advantage of the subclassifier is that it is easy to interpret the classification rules and select the simplest decision tree from the input attributes. In the scope of this study, decision trees can represent and analyse the choices of participants solving each task. To avoid overfitting the experimental data, a 10-fold cross-validation method was used to generate the tree model.
Finally, the relative frequency of any sphere was calculated according to Eq. (14).
$p_i=\frac{n_i}{N}$ (14)
where, ni is the number of experiments for choosing sphere i (sphi) and N is the total number of experiments. This method allows the generation of simple single-node decision trees with an empty feature set that always predicts the highest-frequency sphere.
Table 3. Assessing the accuracy for each feature set and their 95% confidence intervals
|
|
Feature set |
Tree size |
Tree height |
Accuracy |
95% confidence level |
|
1 |
$I D_{t_1}, I D_{t_2}$ |
9 |
5 |
70.56% |
±2.27% |
|
2 |
ID1,2, ID2,1 |
6 |
4 |
71.20% |
±2.26% |
|
3 |
ID1, ID2 |
6 |
4 |
70.95% |
±2.27% |
|
4 |
D1, D2, r1, r2 |
6 |
4 |
71.20% |
±2.26% |
|
5 |
Ø |
1 |
1 |
63.81% |
±2.40% |
(5) Results
J48 algorithm was used to generate decision trees according to feature sets 1-4 in Table 3. It was then used to predict the selected sphere, with an accuracy of 70.9% and a confidence of 95%, which was better than other methods. Statistically, the prediction results of all the tested feature sets were close, but the tree generated for feature set 1 was more complex than that generated for feature sets 2-4 and therefore not practical. And there may be overfitting as the five non-leaf nodes had only two attributes.
As can be seen from Table 3, the prediction results of feature sets 2 and 4 show great similarity, and they can be regarded as equivalent. This is because the only associated conditions between the spheres task difficulty index that makes up feature set 2 is the sphere diameter, while feature set 4 consists of the sphere radius and the handle-sphere distance. However, further study of the decision tree generated by feature set 4 revealed that the J48 algorithm may ignore the sphere-handle distance based on the low information gain. Therefore, it can be speculated that the radius provided an identical information gain for feature sets 2 and 3, since they generated decision trees with equivalent configurations and produced similar accuracies.
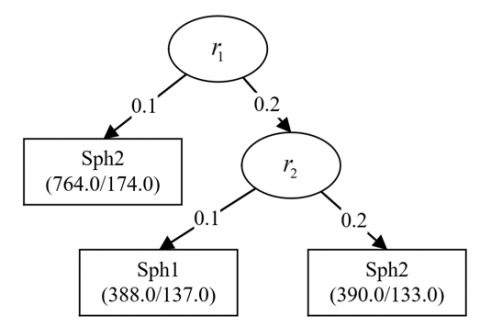
Figure 3 is the decision tree generated according to feature set 4. From the figure, we can see that when sph2 is small, participants will prefer sph1; Participants preferred sph2 when sph2 was larger or when both spheres had the same radius.
Figure 3. Decision tree generated by feature set
The experiment shows that the decision tree method can predict user intention effectively. Fitts' ID predicted target selection well, but equivalent accuracy seemed to be obtained on the basis of sphere’s radius, suggesting that the user had a very basic strategy in which distance was not decisive for selecting a moving target. Since the moving target was moving, the participant may have prepared the starting position of the handle before performing the pointing task.
An improved moving target prediction model is proposed based on the use of target size and distance to predict targets, considering the problem of head pose.
Predictions of expected targets were introduced by computing relevant features for head and hand targets within a time window, which can be generalised to different dynamic targets selection tasks, using the Ortega scoring function [18] as a benchmark to evaluate the accuracy of feature prediction.
(1) Apparatus and participants
The apparatus and participants are the same as in the previous section.
(2) Design
In each sub-experiment, the experimental sphere appeared 5m in front of the participant, 0.3m below the initial head pose of the participant.
Sub-experiment 1
In sub-experiment 1, there was only one experimental sphere in the experimental scenario and the experimental variables were the radius of the sphere and the sphere position (left: x-axis -0.5, middle: origin position, right: x-axis 0.5). Five trials were conducted for each of the six scenarios (30 trials in total). The aim of sub-experiment 1 was to familiarise participants with the experimental and to acquire the dynamic target task.
Sub-experiment 2
In sub-experiment 2, there are two spheres in each trial (sph1, sph2), the experimental variable is the radius of the spheres, and the relative positions of the spheres shown in Figure 2. In each trial, the two spheres move simultaneously at a constant speed of 1.5m/s for 5 trials for each of the 12 scenarios (60 trials in total).
(3) Procedure
During the experiment, each participant was asked to stand in a designated circle in the experimental scene, facing the experimental wall, and complete relevant target selection tasks. In the course of the experiment, a horizontal set of spheres appeared in front of the participant and began to move in the positive direction of their z-axis. Each sphere has the same texture and colour and was scaled according to the sphere's radius.
The participant had to reach out and select the target, but not to step out of the designated circle. Each target automatically disappeared when hit by the participant or when it got 0.5m past the participant's head on the z-axis. Once all the spheres disappeared, the trial was over. Auditory and tactile feedback is used to assist the participant in the selection process. Only when a sphere was hit, a sound would be played in the experimental scene and the handle would twitch slightly.
During each experiment, the task completion time, the head pose, the handle pose, the target sphere position and the collisions that occurred between the handle and the sphere are recorded in an application log.
(4) Analysis of experimental data
Based on each completed experiment, an inter-participant analysis was performed. Trials where the participant didn’t hit a sphere were discarded. We calculated the relationship between the position of the sphere and the participant's head pose and handle pose. We also calculated the average of these measurements over a time window to assess the target sphere predicted by the different feature sets.
a. Positioning relative to the participant's head
The head vector $(\vec{T})$ is calculated from the participant's head orientation $\left(Q_h\right)$. Considering that the corresponding head vector is $(0,0,-1)$ if the participant has not turned his/her head, the unit vector $-\widehat{m}$ needs to be rotated in the direction of the head to calculate $\vec{T}$.
$\vec{T}=\operatorname{rot}\left(-\hat{m}, Q_h\right)$ (15)
Then calculate the position of the sphere in the head pose (Ph, Qh)
$P_{i h}=P_i-P_h$ (16)
The dot product between the normalized vectors is calculated as follows.
$d o t_i=\hat{T} \times \hat{P}_{i h}$ (17)
The dot product is a normalized scalar that is easy to interpret, and the closer it is to 1, the more aligned the user's head orientation is with the sphere. The dot product difference is calculated as follows.
$\Delta d o t=d o t_1-d o t_2$ (18)
This quantity is used to evaluate the position of the user's head relative to the two spheres. The closer its value is to 1, the more aligned the user's head is with sph1. The closer its value is to -1, the closer the user's head is to sph2. 0 indicates that the user's head is in the middle of the two spheres. Finally, we calculated the handle-sphere distance Di and the distance difference ΔD.
$D_i=\left|P_w-P_i\right|$ (19)
$\Delta D=D_1-D_2$ (20)
Similar to the dot product difference, the distance difference is used to assess the position of the user's handle with respect to the sphere: Greater than 0, the larger it is, the farther the handle is from sph1; Less than 0, the smaller it is, the farther the handle is from sph2; A value equal to 0 means that the handle is equidistant from both spheres.
b. Distance score
To verify the validity of the proposed features, their prediction accuracy was compared with the distance scoring function proposed by Ortega et al. [18] According to his method, all the targets are in an ordered list of increasing distance values, with the order denoted by j. The score of each N closest targets are increased as follows.
$d S_j(\mathrm{t})=d S_j(\mathrm{t}-1)+(\mathrm{N}-\mathrm{j}) \Delta \mathrm{t} ; \quad(\mathrm{j}<\mathrm{N})$ (21)
All the other targets will have their scores decreasing.
$d S_j(\mathrm{t})=d S_j(\mathrm{t}-1)-(0.9 \mathrm{~N}) \Delta \mathrm{t} ; \quad(\mathrm{j} \geq \mathrm{N})$ (22)
$d S_j(\mathrm{t}) \geq 0$ (23)
Since there are two spheres in the experimental environment, hence N=1. This only requires increasing the fraction closest to the target. The decay rate in equation 22(0.9N) is much higher than in the Ortega formula (0.5N). This is because the selection task requires a large amount of time to wait for the target to appear, so the great majority selection behaviour occurs at the end of the experiment.
c. Choice of time window
Since the data are not completely consistent for each movement, Δdot and ΔD are averaged over a time window rather than using discrete values. As the analysis is performed post-hoc, ideally the time window should start before the start of the arrival movement, with the user then specifying their intention and movement, and then end before reaching the target. Within the scope of this study, a graphical analysis of the point graph was carried out as time passed to heuristically determine the appropriate window.
The value of Δdot gradually approaches 0 from the initial non-zero, between 0 and 1, indicating that they were choosing between two spheres; after 1 second Δdot started to diverge here, indicating that the participant's head was facing one of the spheres. The user's choices between two spheres clustered above and below 0. Based on this, 1.5s was chosen as the end time of the window. These times corresponded to 42.5% and 63.8% of the 5th percentile of selection times (2.35s).
Within this time window, the average dot product difference $\overline{\Delta d o t}$ and the average handle-sphere distance $\overline{\Delta D}$ were calculated. The scoring function was also run through the time window. Depending on the final score, each target i is marked as 0 or 1.
(5) Results
Single and combined feature sets were estimated to predict the probability that the participant would choose the first sphere. The J48 classifier was used to evaluate the feature set because it can select the simplest decision tree based on the input attributes to generate easily interpretable rules. The performance of this research model can be simply assessed by calculating the prediction accuracy. Table 4 shows that both single and combined feature sets outperformed both chance and frequency predictions. The 95% confidence intervals for the accuracy of the two classifiers were:
$\left(\right.pre_1-\left.pre_2\right)\pm z_{95}$$\sqrt{\begin{aligned} & \frac{\operatorname{pre}_1\left(1-p r e_1\right)}{n u m E x p} \\ & +\frac{\operatorname{pre}_2\left(1-p r e_2\right)}{n u m E x p}\end{aligned}}$ (24)
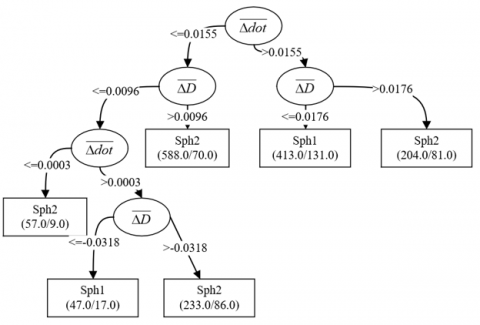
Although the model generated using the feature $\overline{\Delta d o t}$ didn’t significantly outperform the model generated using $\overline{\Delta D}$, the latter was not practical as it generated a more complex tree with lower average accuracy and over-fitted data. In contrast, the prediction accuracy of the feature set combined with $\overline{\Delta d o t}$ and $\overline{\Delta D}$ was higher than that of features $\overline{\Delta D}$ alone, and the resulting tree is shown in Figure 4.
Figure 4. Decision tree generated by $\{\overline{\Delta d o t}, \overline{\Delta D}\}$ feature set
Table 4. Number of nodes, layers, precision and 95% confidence intervals for the trees formed by each feature set
|
Feature set |
Number of nodes |
Number of layers |
Precision |
95% confidence interval |
|
The scoring classifier |
1 |
1 |
67.59% |
[64.87%,70.30%] |
|
$\overline{\Delta d o t}$ |
4 |
3 |
70.09% |
[67.82%,72.36%] |
|
$\overline{\Delta D}$ |
6 |
4 |
68.42% |
[66.21%,70.62%] |
|
$\overline{\Delta d o t}$, $\overline{\Delta D}$ |
10 |
5 |
70.58% |
[68.26%,72.89%] |
Table 5. Number of nodes, layers, precision for evaluating trees based on the target feature set
|
Feature set |
Number of nodes |
Number of layers |
Precision |
95% confidence interval |
|
r1, r2 |
5 |
3 |
71.59% |
[69.06%,74.12%] |
|
$\overline{\Delta d o t}, r_1, r_2$ |
8 |
5 |
74.10% |
[72.02%,76.17%] |
|
$\overline{\Delta D}, r_1, r_2$ |
26 |
12 |
75.02% |
[72.92%,77.12%] |
|
$\overline{\Delta d o t}, \overline{\Delta D}, r_1, r_2$ |
20 |
12 |
78.55% |
[76.13%,80.96%] |
The time window limit may change depending on the task, but the expected target is fixed, which is much better than considering the entire target's motion trajectory.
Finally, using a single head-target relative parameter, such as $\overline{\Delta d o t}$, and a single handle-target relative parameter, such as $\overline{\Delta D}$, may be of no or little use in tasks where the number of targets is large and their locations vary.
Tables 5 shows that the feature set of combination $\overline{\Delta d o t}$, $\overline{\Delta D}$, and r1, r2 obtained the best prediction result, exceeding the average precision of the reference standard {r1, r2} by almost 7%, but the resulting tree is too large for this study. Table 5 also shows that feature set $\left\{\overline{\Delta D}, r_1, r_2\right\}$ produces higher accuracy than $\left\{\overline{\Delta d o t}, r_1, r_2\right\}$ and {r1, r2}. The high accuracy of the feature set of combination $\overline{\Delta D}$ and r1, r2 indicates that in the simple task of dynamic target prediction, the function of the size and distance of the sphere target can predict the chosen sphere well.
By integrating $\overline{\Delta D}$, it shows a significant increase in information gain, reflecting the correlation between handle and target poses. However, this only occurs after a certain task preparation time.
(6) Experimental findings
Experimental results show that integrating head-target feature set $\overline{\Delta d o t}$ and handled-target feature set $\overline{\Delta D}$ can effectively predict user intention in dynamic target selection task. These features were calculated in about 67% of the selection time, which was better than the reference standard prediction. In addition, the combined features of $\overline{\Delta d o t}$ and $\overline{\Delta D}$ obtained higher accuracy than the separate features $\overline{\Delta D}$.
This paper investigates the selection of moving targets in a VR environment and constructs predictions of user intent for moving target acquisition in a VR scenario by combining the characteristics of moving targets with decision trees. Based on two sub-experiments with sphere as the target, we investigated the feasibility of predicting user intention based on the size and distance of the moving target in a VR scenario. Then, considering the influence of head orientation, an improved model for moving target prediction is proposed by the same two sub-experiments, and its prediction accuracy is calculated and compared based on the decision tree algorithm.
This work was financially supported by the Guizhou Provincial Science and Technology Support Program Project [2023] General 147; the Guizhou Provincial Department of Education Science and Technology Top Talent Project (Grant No.: [2022]086); the Guiyang City Science and Technology Plan Project [2023].
[1] Fitts, P.M. (1992). The information capacity of the human motor system in controlling the amplitude of movement. Journal of Experimental Psychology: General, 121(3): 262-269. https://doi.org/10.1037/0096-3445.121.3.262
[2] MacKenzie, I.S., Buxton, W. (1992). Extending Fitts' law to two-dimensional tasks. In Proceedings of the SIGCHI Conference on Human Factors in Computing Systems, New York, NY, United States, pp. 219-226. https://doi.org/10.1145/142750.142794
[3] Goldberg, K., Faridani, S., Alterovitz, R. (2014). Two large open-access datasets for Fitts’ law of human motion and a succinct derivation of the square-root variant. IEEE Transactions on Human-Machine Systems, 45(1): 62-73. https://doi.org/10.1109/THMS.2014.2360281
[4] Meyer, D.E., Abrams, R.A., Kornblum, S., Wright, C.E., Keith Smith, J.E. (1988). Optimality in human motor performance: ideal control of rapid aimed movements. Psychological Review, 95(3): 340-370. https://doi.org/10.1037/0033-295X.95.3.340
[5] Zhang, C., Li, X., Gao, F., Zhou, F., Xu, L. (2015). An experimental research on the directivity of Fitts' law in human-computer interaction. In 2015 IEEE International Conference on Progress in Informatics and Computing (PIC), Nanjing, China, pp. 226-229. https://doi.org/10.1109/PIC.2015.7489842
[6] Tang, R., Shen, B., Sang, Z., Song, A., Goodale, M.A. (2018). Fitts’ Law is modulated by movement history. Psychonomic Bulletin & Review, 25: 1833-1839. https://doi.org/10.3758/s13423-017-1367-8
[7] Bertucco, M., Cesari, P., Latash, M.L. (2013). Fitts’ Law in early postural adjustments. Neuroscience, 231: 61-69. https://doi.org/10.1016/j.neuroscience.2012.11.043
[8] Bernhaupt, R., Dalvi, G., Joshi, A. (2017). Human-computer interaction-interact 2017. 16th IFIP TC 13 international conference, Mumbai, India, September 25-29, Proceedings, Part III. 2017.
[9] Glazebrook, C.M., Kiernan, D., Welsh, T.N., Tremblay, L. (2015). How one breaks Fitts’s Law and gets away with it: Moving further and faster involves more efficient online control. Human Movement Science, 39: 163-176. https://doi.org/10.1016/j.humov.2014.11.005
[10] Petrič, T., Simpson, C.S., Ude, A., Ijspeert, A.J. (2017). Hammering does not fit Fitts' Law. Frontiers in Computational Neuroscience, 11: 45. https://doi.org/10.3389/fncom.2017.00045
[11] Cha, Y., Myung, R. (2013). Extended Fitts' law for 3D pointing tasks using 3D target arrangements. International Journal of Industrial Ergonomics, 43(4): 350-355. https://doi.org/10.1016/j.ergon.2013.05.005
[12] Murata, A., Fukunaga, D. (2018). Extended Fitts’ model of pointing time in eye-gaze input system-Incorporating effects of target shape and movement direction into modeling. Applied Ergonomics, 68: 54-60. https://doi.org/10.1016/j.apergo.2017.10.019
[13] Hoffmann, E.R., Karri, S. (2018). Control strategy in movements with transmission delay. Journal of Motor Behavior, 50(4): 398-408. https://doi.org/10.1080/00222895.2017.1363700
[14] Xiao, N., Zhang, X. (2020). A target positioning method for industrial robot based on multiple visual sensors. Traitement du Signal, 37(3): 469-475. https://doi.org/10.18280/ts.370314
[15] Guiard, Y. (2019). Polar and cartesian structure in the data of fitts's classic experiments-with a criterion for distinguishing a strong and a weak version of Fitts' law. Journal of Motor Behavior, 52(2): 271-293. https://doi.org/10.1080/00222895.2019.1614901
[16] Liu, Z., Lyu, J., Zhao, H., Liu, J. (2020). Prediction of Graphic Interaction Time of Virtual Reality System Based on Improved Fitts' Law. Traitement du Signal, 37(2): 227-234. https://doi.org/10.18280/ts.370208
[17] Zhao, D.G., Vasilyev, A.N., Kozyrskiy, B.L., Melnichuk, E.V., Isachenko, A.V., Velichkovsky, B.M., Shishkin, S.L. (2021). A passive BCI for monitoring the intentionality of the gaze-based moving object selection. Journal of Neural Engineering, 18(2): 26001-26018. https://doi.org/10.1088/1741-2552/abda09
[18] Ortega, M. (2013). Hook: Heuristics for selecting 3D moving objects in dense target environments. In 2013 IEEE Symposium on 3D User Interfaces (3DUI), Orlando, FL, USA, pp. 119-122. https://doi.org/10.1109/3DUI.2013.6550208