Yunzhong Xia![]() | Zhen Zhu
| Zhen Zhu![]() | Xiaoyi Zheng
| Xiaoyi Zheng![]() | Guofei Chai*
| Guofei Chai*![]()
© 2023 IIETA. This article is published by IIETA and is licensed under the CC BY 4.0 license (http://creativecommons.org/licenses/by/4.0/).
OPEN ACCESS
For electric circuit inspection, the conventional manual inspection method has a series of problems including the heavy work load of recording the readings, the low accuracy, and the hidden safety hazards. The intelligent recognization method for images of meter readings based on digital image technology has a great practical value. However, the existing recognization methods for meter readings based on deep learning generally ignore the extraction of key points such as the pointer and scale on meter dashboard, the existing algorithms are of poor robustness and anti-jamming ability, therefore, this paper aims to study a novel method for recognizing readings in the images of electric circuit inspection meters based on deep learning. At first, this paper corrects the tilt of meter dashboard, and accurately positions the dashboard center. Then, based on the YOLOv5 network model, this paper constructs the said recognization model, gives the structure of the YOLOv5 network model, and introduces its working principle. At last, experimental results are drawn to verify the validity of the proposed method for processing the images of meter readings and the constructed recognization model.
deep learning, electric circuit, recognization of meter readings, image processing
The power industry is always a strategic pillar industry for national economy. In the grand background of economic development, the power industry is constantly upgraded in an intelligent manner, and the inspection meters of electric circuit are playing an increasingly important role in the stable operation of power systems [1-7]. Due to the effect of multiple factors, the measuring meters need to be inspected regularly, and the installation environment of these meters is often complex and ever-changing [8-14]. The conventional manual inspection method has a series problems including the heavy work load of recording the readings, the low accuracy, and the hidden safety hazards [15-17], while the intelligent recognization method for images of meter readings based on digital image technology has a great practical value [18-21]. For the dashboard pointer segmentation, image registration and automatic interpretation of electric circuit inspection meters, matters such as the type of meter pointers, the light changes at the site, and the shooting and affine transformation of meter images need to be considered, and the research in the related fields should be further deepened.
Although Convolution Neural Network (CNN) exhibits a great potential in automatic meter reading under unconstrained environment, it faces a few challenges such as the difficulty in collecting sufficient training data set because of the long update cycle of some digits, and another challenge is how to understand the transitional state between two consecutive numbers. To solve these issues, Sripanuskul et al. [22] proposed a new data enhancement technique that automatically creates digital annotated images, including transitional states. By utilizing the latest generative neural network model, the generated numbers resemble the local appearance of those in the original meter images. Devyatkin et al. [23] introduced a computer vision system that can recognize the measurements of dial meter devices attained by video camera, in the paper, the authors took into account the convenience of end users, described the operation algorithm, and gave the recognition results. To solve the instability of conventional meter inspection methods, Li et al. [24] proposed a automatic reading method for analog meters based on YOLOv5s detector. The authors adopted the Hough transform algorithm to detect the pointer and range and realize meter reading based on the angle method. In industrial applications, the automatic reading task of pointer meters often faces difficulties such as the indistinct meter features, the complex background environment, and the slow recognition speed, in view of these issues, Li and Jia [25] proposed a new-type U-net network to segment the pointers and scales of pointer meters, this network uses the bneck module in MobileNet to replace the backbone feature extraction part in the common U-net networks, and fuses it with the enhanced feature extraction part. Theoretical analysis and experimental results show that the proposed new-type network has improved the segmentation accuracy of conventional network from 90.79% to 93.63%. The accuracy and anti-jamming ability of the system could meet application requirements, and the average basic error is 0.48%. Salomon et al. [26] proposed novel approaches for automatic dial meter reading, introduced new data set in unconstrained scenarios, combined YOLOv4 with a novel regression approach, and explored several post-processing techniques. Compared with previous works, the mean absolute error was reduced from 1343 to 129, and a meter recognition rate of 98.9% was achieved with an error tolerance of 1 kWh.
By reviewing and summarizing relevant studies, it’s found that deep learning is playing an increasingly important role in the field of image processing in recent years. Using deep learning to recognize meter readings could attain better results than other methods, but most of the existing methods ignore the extraction of key points on meter dashboard, but choose to directly predict the direction of the pointers or the meter readings, which has resulted in a few shortcomings in the algorithm such as the poor robustness and anti-jamming ability. Therefore, this paper attempts to study a new method for recognizing the readings in meter images. The second chapter corrects the tilt of meter dashboard; the third chapter accurately positions the meter dashboard center; the fourth chapter builds the said recognization model based the YOLOv5 network model, and introduces the structure of the YOLOv5 network model and its working principle. At last, experimental results are drawn to verify the validity of the proposed image processing method and the constructed recognization model.
During electric circuit inspection, the shooting angle of the camera is easily affected by factors such as the inclined road surface or the installation position of the meters, so the camera may not be able to strictly face the dashboard of meters, which can further lead to image distortion and the recognization failure of readings, so in order to attain more accurate automatic readings, at first, this paper corrects the tilt of meter dashboard.
The first step is to judge the convexity of image boundary. Assuming: (a, b) represents a certain point on F (the boundary of meter image), if it satisfies ∂k/∂a>0, ∂k/∂b>0(or ∂k/∂a<0, ∂k/∂b<0), then (a, b) is concave, at this time, F increases (or decreases) in the directions of a and b; if it satisfies ∂k/∂a>0, ∂k/∂b<0(or ∂k/∂a<0, ∂k/∂b>0), then (a, b) is convex, that is:
$\left\{\begin{array}{l}\frac{\partial k}{\partial a} \times \frac{\partial k}{\partial b}<0, \text { convex } \\ \frac{\partial k}{\partial a} \times \frac{\partial k}{\partial b}>0, \text { concave }\end{array}\right.$ (1)
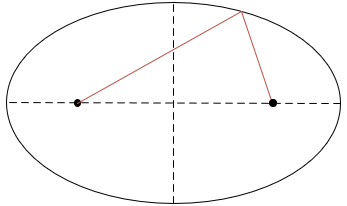
Then, the ellipse that may exist in the image is found out based on the convexity of point (a, b) and the foci of the ellipse are calculated according to two arcs that belong to the same eclipse but in different quadrants. Figure 1 gives a schematic diagram showing how to find the foci of the eclipse. Based on the calculation results of ellipse foci, the length of the long and short axes of the ellipse and the tilt angle are determined, at last, the shape of the ellipse is fitted.
Figure 1. Finding the ellipse foci
The long axis, short axis, and foci of the fitted ellipse are taken as the datum points to correct the tilt of the meter image. Assuming: N represents the perspective transformation matrix, then the following formula gives the transformation equation:
$(A, B, C)^O=N \cdot(a, b, c)^O$ (2)
$N=\left[\begin{array}{lll}n_{11} & n_{12} & n_{13} \\ n_{21} & n_{22} & n_{23} \\ n_{31} & n_{32} & n_{33}\end{array}\right]$ (3)
Assuming: (a,b,c) represents the coordinates of the original meter dashboard image in the three-dimensional space, (a,b) represents the coordinates of its projection on the two-dimensional plane, (A,B,C) represents the 3D coordinates based on N transformation, then the following formula gives the transformation equation for converting into 2D coordinates (a’, b’):
$\left\{\begin{array}{l}a^{\prime}=\frac{A}{C}=\frac{n_{11} a+n_{12} b+n_{13} c}{n_{31} a+n_{32} b+n_{33} c} \\ b^{\prime}=\frac{B}{C}=\frac{n_{21} a+n_{22} b+n_{23} c}{n_{31} a+n_{32} b+n_{33} c}\end{array}\right.$ (4)
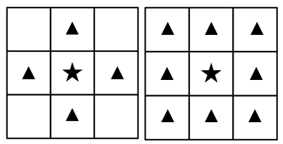
To get the accurate position of the pointer, at first, the accurate position of the center of the meter dashboard should be determined, in this paper, the area of the scale in the meter image was marked as a connected area, as shown in Figure 2. Then, straight lines in the scale were fitted based on the least square method, considering that the intersection points of the fitted straight lines only represent the area where the scale is located, it is not the accurate position. At last, based on the DBSCAN clustering algorithm (Density-Based Spatial Clustering of Application with Noise), the clustering center of all straight line intersection points was found and determined as the center of the meter dashboard.
1) 4 adjacencies 2) 8 adjacencies
Figure 2. Marking the connected area
During straight line fitting, the sum of error squares of the data needs to be minimized. Assuming: (ai, bi) represents the set of the fitted dashboard scale straight line data points, then the formula for calculating the sum of error squares of the distances from each data point to the dashboard scale straight line Δb2:
$b=l a+\tau$ (5)
$\Delta b^2=\sum_{i=1}^m\left[b_i-\left(l a_i+\tau\right)\right]^2$ (6)
The l and τ values corresponding to the extremes of the above formula can be attained based on the following formula, that is, to calculate the derivation of Δb2 with respect to l and τ, and let the derivation result be 0:
$\left\{\begin{array}{l}\frac{\partial \Delta b^2}{\partial l}=\sum_{i=1}^m\left[b_i-\left(l a_i+\tau\right)\right] a_i=0 \\ \frac{\partial \Delta b^2}{\partial \tau}=\sum_{i=1}^m\left[b_i-\left(l a_i+\tau\right)\right] a_i=0\end{array}\right.$ (7)
By solving the above formula, the l and τ values that can meet the fitted straight lines of the dashboard scale could be attained:
$\left\{\begin{array}{c}l=\frac{m \sum_{i=1}^m\left(a_i b_i\right)-\sum_{i=1}^m a_i \sum_{i=1}^m b_i}{m \sum_{i=1}^m a_i^2-\sum_{i=1}^m a_i \sum_{i=1}^m a_i} \\ \tau=\frac{\sum_{i=1}^m a_i^2 \sum_{i=1}^m b_i-\sum_{i=1}^m\left(a_i b_i\right) \sum_{i=1}^m a_i}{m \sum_{i=1}^m a_i^2-\sum_{i=1}^m a_i \sum_{i=1}^m a_i}\end{array}\right.$ (8)
To get the cluster center of the straight line intersection points, at first, the center point of the entire meter image was randomly chosen and supplemented based on all pixel points that are density-connected to the center point. Then, to attain the boundary points of the clusters consisted of non-center points, this paper searched for other center points in the center area and the points that are density-connected to them. After the boundary points were attained, the entire meter image was searched again and the boundary points were deleted, these steps were repeated until there’s no more new center point of the meter.
Based on the image after subjected to tilt correction in the previous chapter and the determined position of the dashboard center, this paper built the meter image reading recognization model based on the YOLOv5 network model, Figure 3 shows the structure of the YOLOv5 network model, and its principle is detailed below.
In order to fit the minimum enclosing rectangle (MER) facing the rotating pointer, reduce the correction scale of the original YOLOv5 network, and improve the recognization accuracy of readings, this paper constructed a rotating box containing width, height, rotation angle and other information. Assuming: (a,b) represents the coordinates of the center point of the rotating rectangular box, q represents the shorter edge of the rectangle, f represents the longer edge of the rectangle, ω represents the included angle between the longer edge and the horizontal direction, then the rotating rectangular box can be written as (a, b, q, f, ω).
To solve the problem of angle periodicity with the rotating rectangular box in the regression of angle parameter, this paper converted the regression process of angle parameter in the network into the process of solving a classification problem, but this will sacrifice a certain recognization accuracy of the readings. In order to solve this problem, this paper measured the degree of influence on the recognization accuracy of readings based on the maximum accuracy loss Max(QU) and the average accuracy loss P(QU).
$\operatorname{Max}(Q U)=\theta / 2$ (9)
$P(Q U)=\int_x^y a^* \frac{1}{y-x} d a=\int_0^{\theta / 2} a^* \frac{1}{\frac{\theta}{2}-0} d a=\frac{\theta}{4}$ (10)
Figure 3. Structure of the YOLOv5 network model
To distinguish the size of different-type losses, this paper set a window function to describe the distance between the predicted angle and the actual angle of the meter pointer, as shown in Figure 4, assuming: g(x) represents the window function; x, y, and z are constant terms; a represents the input angle information; ω represents the angle to be rotated, the following formula describes the process:
$D R K(a)=\left\{\begin{array}{l}h(a), \omega-s<a<\omega+s \\ 0, \text { otherwise }\end{array}\right.$ (11)
By substituting the Gaussian function into the above formula as the window function, we can get:
$D R K(a)=\left\{\begin{array}{l}x p^{-(a-y)^2 / 2 d^2, \omega-3<a<\omega+3} \\ 0, \text { otherwise }\end{array}\right.$ (12)
Assuming: (yq, yf) represents the actual rotating rectangular box, (Da, Db) represents the grid coordinates of meter image, (ε(oa), ε(ob)) represents the offset of dashboard center. For the YOLOv5-based meter image reading recognization model, the goal of the regression of the rotating rectangular box is to learn the mapping from the optimal rotating rectangular box (Eq, Ef) to the actual rotating rectangular box (yq, yf) and the offset (ε(oa), ε(ob)). Figure 5 shows the goal of model regression. Therefore, based on the confidence loss QU1, the boundary box regression loss QU2, and the type loss QU3, this paper built the loss function of the model as:
$Q U=Q U_1+Q U_2+Q U_3$ (13)
The GIoU loss function was adopted for QU2, and both QU1 and QU3 adopted binary cross entropy loss functions. Assuming: X represents the predicted box, Y represents the actual box, D represents the smallest convex closing box containing X and Y, then there is:
$G I o U=I o U \cdot \frac{|D \backslash(X \cup Y)|}{|D|}$ (14)
$Q U_2=1-G I o U$ (15)
The following formula calculates the total loss of the meter image reading recognization model:
$\begin{aligned} & Q U=1-G I o U+\sum_{i=0}^{R \times R} \Sigma_{j=0}^Y 1_{i j}^{O B}\left[D_i \log \left(D_i\right)+\left(1-D_i\right) \log \left(1-D_i\right)\right] \\ & -\sum_{i=0}^{R \times R} \Sigma_{j=0}^Y 1_{i j}^{N O B}\left[D_i \log \left(D_i\right)+\left(1-D_i\right) \log \left(1-D_i\right)\right] \\ & +\sum_{i=0}^{R \times R} \Sigma_{j=0}^Y 1_{i j}^{O B} \Sigma_{d \in \text { classes }}\left[E_i(d) \log \left(E_i(d)\right)+\left(1-E_i(d)\right) \log \left(1-E_i(d)\right)\right]\end{aligned}$ (16)
During the recognization of the rotating pointer of the meter, the goal of boundary box regression is to learn (ε(oa), ε(ob)) and ω, therefore, the loss of rotation angle ω was added based on above formula.
$\begin{aligned} & Q U_{\text {total }}=Q U_1+Q U_2+Q U_3+Q U_\omega \\ & =Q U+\sum_{i=0}^{R \times R} \Sigma_{j=0}^Y 1_{i j}^{O B} \Sigma_{\omega \in \text { angles }}\left[E_i(\omega) \log \left(E_i(\omega)\right)+\left(1-E_i(\omega)\right) \log \left(1-E_i(\omega)\right)\right] \\ & \end{aligned}$ (17)
Figure 4. Recognization of distance between the predicted angle and the actual angle
This study selected 10000 meter images with different lighting conditions, shooting angles and formats, each image only shows one meter. Out of the 10000 images, 8000 images were taken as the training set, and 2000 images were taken as the verification set. To get the accurate position of the pointer, the cluster centers of all straight line intersection point collections were found out using the DBSCAN clustering algorithm, and the accurate position of dashboard center was finally determined. To verify the validity of the proposed algorithm, the experimental results of the proposed algorithm and several reference clustering algorithms were compared. Table 1 compares the meter dashboard center positioning results. According to the table, compared with average offset clustering algorithm, the clustering efficiency of the proposed algorithm was lower, but the proposed algorithm attained lower wrong detection rate and missing detection rate. Through experiment, it is found that if the collected meter image has low pixels or the shooting angle is tilted, then the positioning of meter dashboard center will be affected, which has also verified that it is scientific to correct the tilt of meter dashboard before positioning the dashboard center.
When training the network, at first, the default size of the rotating rectangular box needs to be adjusted until it can fit the meter image set, otherwise it’ll lead to a decrease in the training speed of the model. To make the rotating box better fit the actual box of meter pointer and accelerate the fitting speed of the model, before verifying the performance of the meter image reading recognization model, this paper clustered the actual boxes of all meter pointers in the meter image set and define the size of the rotating box on this basis.
Figure 5. The model regression goal
Figure 6. Training error curve of the meter image reading recognization model
1)
2)
Figure 7. Recognization accuracy curve of the meter image reading recognization model
Table 1. Comparison of meter dashboard center positioning results
|
Model |
Image quantity |
Number of wrong detections |
Number of missing detections |
Rate of wrong detections |
Rate of missing detections |
Running time |
|
The proposed algorithm |
10000 |
13 |
36 |
1.3 |
3.6 |
0.44 |
|
K-MEANS clustering |
10000 |
96 |
153 |
9.6 |
15.3 |
3.53 |
|
Bisecting K-MEANS clustering |
10000 |
65 |
124 |
6.5 |
12.4 |
3.29 |
|
Average offset clustering |
10000 |
43 |
57 |
4.3 |
5.7 |
0.35 |
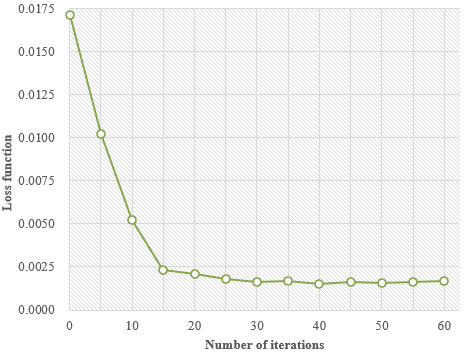
The training error curve of the proposed model during the training process is shown in Figure 6, as can be seen from the figure, when the number of iterations reaches more than 45, the training error is the lowest, then the curve tends to be stable. This paper chose the training weight of 45 iterations to carry out the test.
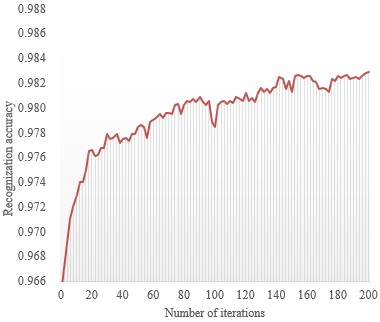
Figure 7 shows the recognization accuracy curves of the model on the training set and the test set, according to the figure, the recognization accuracy of the model for meter pointer increases gradually as the number of iterations grows, after the number of iterations exceeds 150, the recognization accuracy of the model can reach more than 98%.
To further verify the validity of the proposed model for recognizing the image readings of different-type meters, two ampere meters (No 1 and No 2), a voltmeter (No 3), and a power meter (No 4) were included in the experiment. Table 2 summarizes the test results of different meters. According to the table, the proposed model performed very well in recognizing the readings in the images of different-type meters, under the condition that the meter dashboard is not obstructed, the values of the recognization confidence of meter pointer are all greater than 0.9, indicating that the recognization results of meter pointers are highly credible. The experiment shows that tilt correction and positioning of dashboard center are very important for the results of meter pointer readings. By converting the angle parameter regression process in the network into the processing of a classification problem, the relative error of the recognization results of meter pointer angles of the model had been effectively reduced, and the maximum value is less than 4%. Through the comparison of recognization results of the image readings of different-type meters, it’s known that with the increase of solution accuracy of the included angle of minimum scale, the recognization accuracy of the proposed model increases accordingly.
Table 2. Test results of different types of meters
|
Meter No. |
1 |
2 |
3 |
4 |
|
Meter type |
Ampere meter |
Ampere meter |
Voltmeter |
Power meter |
|
Actual value of the angle of minimum scale |
11.20° |
3.60° |
8.50° |
1.80° |
|
Calculated value of the angle of minimum scale |
11.72° |
3.58° |
8.66° |
1.79° |
|
Relative error of minimum scale |
4.53% |
0.26% |
1.72% |
0.55% |
|
Actual spacing angle of the rotating box |
111.00° |
71.00° |
67.00° |
53.00° |
|
Calculated spacing angle of the rotating box |
115.67° |
71.92° |
69.93° |
53.56° |
|
The reading identified by human eyes |
1.45A |
1.52A |
234V |
350W |
|
The reading before correction |
1.46A |
1.42A |
221V |
361W |
|
Relative error before correction |
3.85% |
3.83% |
3.09% |
1.75% |
|
The reading after correction |
1.47A |
1.55A |
225V |
359W |
|
Absolute error of the reading |
0.02A |
0.06A |
0.02V |
11W |
|
Relative error before and after correction |
2.28% |
0.31% |
1.56% |
0.25% |
This paper studied a novel recognization method for electric circuit inspection meter readings based on deep learning. At first, this paper corrected the tilt of meter dashboard, and accurately positioned the dashboard center. Then, based on the YOLOv5 network model, this paper constructed the recognization model, gave the structure of the YOLOv5 network model, and introduced its working principle. In the experiment, this study compared the results of the positioning of meter dashboard center, and the experimental results show that compared with average offset clustering algorithm, the clustering efficiency of the proposed algorithm was lower, but the proposed algorithm attained lower wrong detection rate and missing detection rate. Moreover, this paper plotted the curves of the training error and recognization accuracy of the model and summarized the test results of different-type meters, the experimental results also verified the validity of the proposed meter image processing method and the constructed recognization model.
[1] Russell, B.D., Benner, C., Wischkaemper, J., Muthu-Manivannan, K. (2021). Incipient electric circuit failure detection and outage prevention in petrochemical facilities using advanced electrical waveform monitoring. In 2021 IEEE IAS Petroleum and Chemical Industry Technical Conference (PCIC), San Antonio, TX, USA, pp. 9-16. https://doi.org/10.1109/PCIC42579.2021.9729013
[2] Xu, H.C., Chen, P. (2021). Fault detection, analysis and prevention of aircraft electrical circuit. In 2021 IEEE 4th Advanced Information Management, Communicates, Electronic and Automation Control Conference (IMCEC), Chongqing, China, pp. 1369-1373. https://doi.org/10.1109/IMCEC51613.2021.9482285
[3] Becker, J.P., Kahanda, I., Kazi, N.H. (2021). WIP: Detection of student misconceptions of electrical circuit concepts in a short answer question using NLP. In 2021 ASEE Virtual Annual Conference Content Access.
[4] Yang, Q.Y., Ruan, J.J., Huang, D.C., Zhuang, Z. (2019). Over-travel detection of electrical contact for high-voltage circuit breaker based on improved HHT and SVM. Dianli Zidonghua Shebei/Electric Power Automation Equipment, 39(1): 198-204.
[5] Irhoumah, M., Pusca, R., Lefevre, E., Mercier, D., Romary, R., Demian, C. (2017). Information fusion with belief functions for detection of interturn short-circuit faults in electrical machines using external flux sensors. IEEE Transactions on Industrial Electronics, 65(3): 2642-2652. https://doi.org/10.1109/TIE.2017.2745408
[6] Fursenko, R.V., Odintsov, E.S. (2022). A novel concept of automatic soap flowmeter with bubble detection by closing an electrical circuit. Flow Measurement and Instrumentation, 85: 102165. https://doi.org/10.1016/j.flowmeasinst.2022.102165
[7] Tzu, F.M. (2021). Effectiveness of electrical and optical detection at pixel circuit on thin-film transistors. Micromachines, 12(2): 135. https://doi.org/10.3390/mi12020135
[8] Zhou, F., Zhang, Y., Zhu, R. (2021). An implantable readout circuit with on-chip reference buffer for the detection of biological electrical signals employing artificial intelligence algorithms to compensate and calibrate. In 2021 3rd International Conference on Artificial Intelligence and Advanced Manufacture, New York, NY, United States, pp. 733-737. https://doi.org/10.1145/3495018.3495149
[9] Tzu, F.M., Chen, J.S., Hsu, S.H. (2021). Detection of electrical circuit in a thin-film-transistor liquid-crystal display using a hybrid optoelectronic apparatus: An ARRAY tester and automatic optical inspection. Micromachines, 12(8): 964. https://doi.org/10.3390/mi12080964
[10] Chen, Z., Li, X., Yang, C., Peng, T., Yang, C., Karimi, H.R., Gui, W. (2019). A data-driven ground fault detection and isolation method for main circuit in railway electrical traction system. ISA Transactions, 87: 264-271. https://doi.org/10.1016/j.isatra.2018.11.031
[11] Kang, X.R., Ker, M.D. (2018). Self-reset transient detection circuit for on-chip protection against system-level electrical-transient disturbance. IEEE Transactions on Device and Materials Reliability, 18(1): 114-121. https://doi.org/10.1109/TDMR.2018.2805184
[12] Jiang, S., Ren, B., Zhou, P., Li, Yu. (2022). Optimization of grounding detection circuit for traction converter of electric locomotive. Journal of Railway Science and Engineering, 19(6): 1786-1793.
[13] Sun, Z., Wang, Z., Chen, Y., Liu, P., Wang, S., Zhang, Z., Dorrell, D.G. (2021). Modified relative entropy-based lithium-ion battery pack online short-circuit detection for electric vehicle. IEEE Transactions on Transportation Electrification, 8(2): 1710-1723. https://doi.org/10.1109/TTE.2021.3128048
[14] Nam, B.I., Choi, Y., Hong, S., Dong, K.Y., Jung, W., Park, S.W., Choi, W.Y. (2022). Novel electrical detection method for random defects on peripheral circuits in NAND flash memory. In 2022 IEEE International Reliability Physics Symposium (IRPS), Dallas, TX, USA, pp. P40-1. https://doi.org/10.1109/IRPS48227.2022.9764437
[15] Laroca, R., Araujo, A.B., Zanlorensi, L.A., De Almeida, E.C., Menotti, D. (2021). Towards image-based automatic meter reading in unconstrained scenarios: A robust and efficient approach. IEEE Access, 9: 67569-67584. https://doi.org/10.1109/ACCESS.2021.3077415
[16] Imran, M., Anwar, H., Tufail, M., Khan, A., Khan, M., Ramli, D.A. (2023). Image-based automatic energy meter reading using deep learning. CMC-Computers Materials & Continua, 74(1): 203-216. https://doi.org/10.32604/cmc.2023.029834
[17] Ali, F., Saidi, M.F.H. (2021). Water leakage detection based on automatic meter reading. In 2021 15th International Conference on Ubiquitous Information Management and Communication (IMCOM), Seoul, Korea (South), pp. 1-7. https://doi.org/10.1109/IMCOM51814.2021.9377437
[18] Zou, F., Shi, Z., Gan, Z., Liao, L., Xu, J. (2021). Water meter reading recognition based on lightweight CNN. In International Conference on Frontiers of Electronics, Information and Computation Technologies, Changsha, China, pp. 1-6. https://doi.org/10.1145/3474198.3478237
[19] Zhang, R., Sun, X., Chen, W.M., Zhong, L. (2021). Design of electric power remote meter reading system. In Journal of Physics: Conference Series, 1802(3): 032030. https://doi.org/10.1088/1742-6596/1802/3/032030
[20] Zhuang, Y., Dong, L., Xu, J., Xu, H., Guo, Y., Xu, N., Deng, Y. (2021). Ubiquitous power internet of things and ipv6 technology in wireless access terminal and intelligent meter reading application system. In Journal of Physics: Conference Series, Xi'an, ShaanXi, China, 1744(2): 022134. https://doi.org/10.1088/1742-6596/1744/2/022134
[21] Wang, Y., Li, Y., Li, K., Wang, N. (2020). Design of a remote meter reading system for residential heating. Journal Européen des Systèmes Automatisés, 53(1): 47-54. https://doi.org/10.18280/jesa.530106
[22] Sripanuskul, N., Buayai, P., Mao, X. (2022). Generative data augmentation for automatic meter reading using CNNs. IEEE Access, 10: 28471-28486. https://doi.org/10.1109/ACCESS.2022.3157706
[23] Devyatkin, A.V., Muzalevskiy, A.R., Morozov, A.S. (2022). Computer vision system for image-based automated dial meter reading. In 2022 XXV International Conference on Soft Computing and Measurements (SCM), Saint Petersburg, Russian Federation, pp. 222-225. https://doi.org/10.1109/SCM55405.2022.9794897
[24] Li, J., Yang, X., Liu, X., Wu, T., Zhao, H., Wang, H. (2022). An automatic reading method of pointer meter based on YOLOv5s. In Second International Conference on Sensors and Information Technology (ICSI 2022), 12248: 280-284. https://doi.org/10.1117/12.2637498
[25] Li, Y., Jia, B. (2022). Research on reading recognition of pointer meter based on improved U-net network. In 4th International Conference on Information Science, Electrical, and Automation Engineering (ISEAE 2022), 12257: 170-179. https://doi.org/10.1117/12.2640361
[26] Salomon, G., Laroca, R., Menotti, D. (2022). Image-based automatic dial meter reading in unconstrained scenarios. Measurement, 204: 112025. https://doi.org/10.1016/j.measurement.2022.112025