Xiaobo Sun![]() | Xiaoqing Yang*
| Xiaoqing Yang*![]() | Jiahui Liang
| Jiahui Liang![]()
© 2023 IIETA. This article is published by IIETA and is licensed under the CC BY 4.0 license (http://creativecommons.org/licenses/by/4.0/).
OPEN ACCESS
Compared with other types of buildings, it is more difficult and demanding to calibrate the image layout of irregular prefabricated buildings. How to effectively extract the layout calibration feature information of the prefabricated buildings and how to ensure the accuracy of the calibration method have become the main problems to be solved in the field of image recognition. Therefore, this paper studied the calibration method of feature point layout of prefabricated buildings based on image recognition technology. Based on the task of extracting feature points in the above prefabricated building images, this paper proposed a new feature extraction network suitable for these feature points, and described its principle in detail. With the help of deep learning technology, this paper enhanced the feature description of prefabricated building image blocks based on feature point location information, and introduced in detail the constructed algorithm model of feature point extraction and description. The experimental results verified the feature point extraction model was effective in calibrating the feature point layout of the prefabricated buildings.
image recognition, prefabricated buildings, feature point extraction, layout calibration
A building assembled by prefabricated components on the construction site is called a prefabricated building [1-6]. On September 27, 2016, the State Council issued the Guidelines on Vigorously Developing Prefabricated Buildings by the General Office of the State Council, which clearly defined the key areas for vigorously developing prefabricated buildings and steel structures, the proportion of prefabricated buildings in new buildings in the future, and the key cities for developing them [7-11]. Due to the irregular outer contour of most of the prefabricated buildings, it is more difficult and demanding to calibrate their image layout, compared with other types of buildings [12-15]. The existing methods have several problems, such as difficult extraction of feature regions, poor calibration effect and low calibration accuracy [16-20]. How to effectively extract the feature information for the layout calibration of prefabricated buildings and how to ensure the accuracy of the calibration method have become the main problems, which need to be solved in the field of image recognition, and have attracted extensive attention of scholars at home and abroad.
Due to calculation error in traditional positioning methods of image feature points, the positioning accuracy of feature points is low. Therefore, Feng and Zhang [21] proposed a new feature point positioning algorithm for three-dimensional reconstruction of multi-vision color image based on principal component analysis, and obtained the color features of the image according to the gray difference of local color regions. The study eliminated the position error of feature points using the least square method, and obtained more accurate positioning results of feature points according to the confidence of the association rules between nodes. After introducing feature matching into the automatic tracking method of marker points in moving image sequences, Cheng [22] established the image deformation model based on the basic principle that the corresponding line segments on both the image to be registered and the reference image are collinear, which realized the full automation of the sequence image registration process through automatic extraction and matching of line segment features. In order to effectively extract the feature points of mobile network animation images and accurately reflect the main contents of videos, Yin and Lv [23] proposed an optimized method for extracting the feature points of key frame images of the mobile network animation, which selected the key frames according to the content changes of animation videos and described the feature points of key frame images of the videos using the scale invariant feature transform algorithm. The study estimated the local feature points of images using the constrained optimization method, which achieved the optimal extraction of feature points of key frame images in mobile network animation. In addition, the study analyzed the extraction efficiency of feature points in several aspects, such as the number and effectiveness of feature point extraction, time consumption and similarity invariance of feature points. The experimental results showed that this method had good adaptability and effectively extracted the feature points of mobile network animation images. Wang et al. [24] proposed an improved Structure from Motion (SfM) stable feature point selection method considering the semantic and structural features of images. In addition, the study proposed a progressive selection algorithm of feature points, which selected the feature points in the Visual Geometry Group (VGG) pyramid according to categories and levels till the number of feature points was satisfied. Guo and Quan [25] proposed a point cloud coarse registration method based on image feature points, which established respectively three-dimensional feature point detection methods based on the dense point clouds obtained by monocular structural light vision, according to the two-dimensional feature points detected by the Speeded Up Robust Features (SURF) algorithm. The precise rotation matrix and translation vector in front of and behind the moving point clouds were obtained by combining the rigid body attitude measurement method with the gross error point removal method.
Referring to the existing research, this paper studied the layout calibration method of feature points of prefabricated buildings based on image recognition technology. Based on elaboration of the core idea of the task of feature point extraction of prefabricated building images, Chapter 2 proposed a new feature extraction network suitable for these feature points, and described in detail its principle. With the help of deep learning technology, Chapter 3 enhanced the feature description of prefabricated building image blocks based on location information of feature points, and introduced in detail the constructed feature point extraction and description algorithm model. The experimental results verified the effectiveness of the feature point extraction model in the feature point layout calibration of prefabricated buildings.
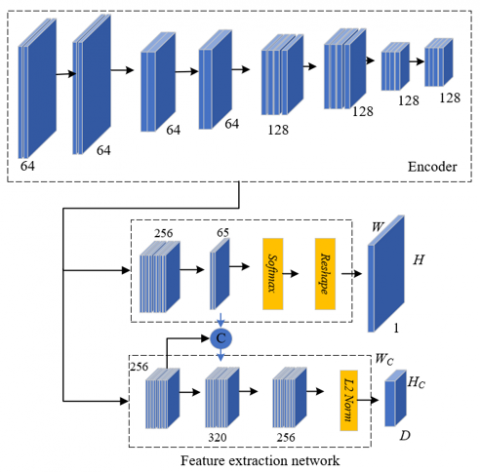
Image feature points are a kind of special pixels used for feature extraction. The feature points of prefabricated building images are edge points, corner points, spots, textures and so on, which are visible in the images. Those feature points used for layout calibration are surrounded by rich architectural structure details, which are easy for positioning and matching analysis. Repeatability is an important attribute of these feature points. After elaborating the core idea of the task of extracting feature points in the above prefabricated building images, this paper proposed a new feature extraction network suitable for those feature points. Figure 1 shows the network architecture of feature point extraction and description of prefabricated buildings. The principle was described below.
Figure 1. Network architecture for feature point extraction and description of prefabricated buildings
At present, there is no sample set of prefabricated building images containing real labels, because the types of feature points of the best prefabricated building images for different tasks are different. At the same time, it is extremely time-consuming and error-prone to label the feature points of prefabricated building images manually. Therefore, this paper selected to generate label information for those images based on random image transformation method.
The following formula gave the calculation process of affine transformation operation. New pixel coordinate values (a', b') were obtained after the affine transformation and normalization operation of the pixels in the prefabricated building images.
$\left[\begin{array}{l}a^{\prime} \\ b^{\prime} \\ 1\end{array}\right]=\left[\begin{array}{ccc}x_{11} & x_{12} & x_{13} \\ x_{21} & x_{22} & x_{23} \\ 0 & 0 & 1\end{array}\right]\left[\begin{array}{l}a \\ b \\ 1\end{array}\right]$ (1)
The following two formulas gave the rotation and scaling transformation operation process in affine transformation. The two kinds of transformation operations could be set by adjusting the values from x11 to x23 in the above formula.
$\left[\begin{array}{l}a^{\prime} \\ b^{\prime} \\ 1\end{array}\right]=\left[\begin{array}{ccc}\cos \omega & \sin \omega & 0 \\ -\sin \omega & \cos \omega & 0 \\ 0 & 0 & 1\end{array}\right]\left[\begin{array}{l}a \\ b \\ 1\end{array}\right]$ (2)
$\left[\begin{array}{l}a^{\prime} \\ b^{\prime} \\ 1\end{array}\right]=\left[\begin{array}{ccc}x_a & 0 & 0 \\ 0 & x_b & 0 \\ 0 & 0 & 1\end{array}\right]\left[\begin{array}{l}a \\ b \\ 1\end{array}\right]$ (3)
The size of the receptive field of prefabricated building images was determined by the size of the set network convolution core. Due to high sensitivity of differential convolution to the edges, this paper carried out a differential operation on the output values of two convolution kernels with different scales in order to obtain the response map of prefabricated building images. The differential response value of pixels in the non-edge region of the images was close to zero, while the calculation result of edge pixels was infinite. Therefore, this paper selected the pixels with the largest and smallest values in the differential response map as the feature points. The following gave the calculation formula of image convolution operation output:
$g*h=\int_{-\infty }^{\infty }{\int_{-\infty }^{\infty }{g\left( v,u \right)h\left( a-v,b-u \right)dvdu}}$ (4)
Let $I \in R^{f 1 \times f 2}$ be the prefabricated building image, $D_1 \in R^{m 1 \times m 1}$ and $D_2 \in R^{m 2 \times m 2}$ be the convolution kernels, i and j be the coordinate values in the response map, and m1 and m2 be the size, respectively. The following gave the calculation formula of discrete two-dimensional convolution operation output of the image.
${{F}_{1}}\left( i,j \right)=\sum\limits_{l=0}^{{{m}_{1}}}{\sum\limits_{k=0}^{{{m}_{1}}}{SR\left( l,k \right)}}{{D}_{1}}\left( i-l,j-k \right)$ (5)
${{F}_{2}}\left( i,j \right)=\sum\limits_{l=0}^{{{m}_{2}}}{\sum\limits_{k=0}^{{{m}_{2}}}{SR\left( l,k \right)}}{{D}_{2}}\left( i-l,j-k \right)$ (6)
The differential output result of convolution kernels was obtained by the following formula:
$F\left( i,j \right)={{F}_{1}}\left( i,j \right)-{{F}_{2}}\left( i,j \right)$ (7)
$\begin{align} F\left( i,j \right)=\sum\limits_{l=0}^{{{m}_{1}}}{\sum\limits_{k=0}^{{{m}_{1}}}{SR\left( l,k \right)}}{{D}_{1}}\left( i-l,j-k \right) -\sum\limits_{l=0}^{{{m}_{1}}}{\sum\limits_{k=0}^{{{m}_{2}}}{SR\left( l,k \right)}}{{D}_{2}}\left( i-l,j-k \right) \end{align}$ (8)
Let q be the extraction network parameter, then F(I|q) simply represented the differential output of the extraction network.
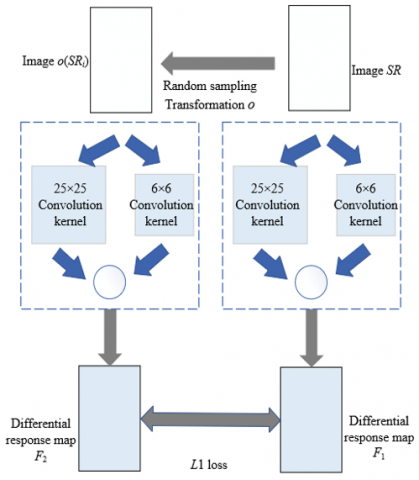
Figure 2 shows the network training and testing process. Let O be the transformation set of the prefabricated building image. Assuming prefabricated building images SRj and SRi have mapping relationship o, that is SRj=o(SRi), where $o \in O$. The feature point extraction network F generated corresponding response maps F(SRi|q) and F(SRj|q) for the two images. If F(SRi|q) and F(SRj|q) were more similar, it could be considered that the feature point extraction network of the images was strongly robust to the transformation o. In conclusion, let μo be the contribution weight of adjusting different image transformations to the loss function, then the following network loss function was constructed:
$K\left( q \right)={{\sum\limits_{o\in O}{{{\mu }_{o}}\left\| \begin{align} YM\left( F\left( S{{R}_{i}}|q \right) \right) -YM\left( F\left( o\left( S{{R}_{i}} \right)|q \right) \right) \end{align} \right\|}}_{1}}$ (9)
Figure 2. Network training and testing process
Prefabricated building image transformation set O contained three basic transformation operations, namely, light intensity transformation, fuzzy transformation and Joint Photographic Experts Group (JPEG) compression transformation. The following gave the calculation formula of light intensity transformation:
$Y\left( i,j \right)=\beta \cdot SR\left( i,j \right)$ (10)
The calculation formula of fuzzy transformation was as follows:
$H\left( i,j \right)=H\left( i,j \right)*SR\left( i,j \right)$ (11)
The calculation formula of JPEG compression transformation was as follows:
$H\left( i,j \right)=\sum\limits_{l=0}^{2{{m}_{3}}+1}{\sum\limits_{k=0}^{2{{m}_{3}}+1}{SR\left( l,k \right)\cdot h\left( i-l,j-k \right)}}$ (12)
$h(i, j)=\frac{1}{2 \pi \varepsilon^2} p^{-\frac{\left(i-m\,_3-1\right)^\quad2+\left(j-m\,_3-1\right)^\quad2}{2 \varepsilon^2}}$ (13)
In order to make the feature points of prefabricated building images still strongly robust in scenes with great changes, such as the light environment, weather environment and so on, that is, some effective features were extracted even if the feature points extracted in the previous section failed, this paper used the deep learning technology to enhance the feature description of prefabricated building image blocks based on the location information of feature points, thus obtaining high feature understanding and expression ability of the local image regions, ensuring restoration of semantic information of most of the local images from the underlying visual information, and better completing the extraction and description of feature points. The feature point extraction and description algorithm model was described in detail below.
In order to self-label the prefabricated building image sample set in complex scenes, this paper carried out model training learning through the pre-training task, with virtual composite image sample set as the training data and corner position truth value as the supervision information.
Before self-labeling the sample set of prefabricated building images in complex scenes, the pre-training model gω was used to extract the feature points of the new image Fi(QR), formed by the random transformation operation in the previous section. Then the inverse operation of transformation matrix F-1i was performed for the obtained feature points. Finally, the operation results were aggregated based on the following formula:
$G\left( QR;{{g}_{\omega }} \right)=\frac{1}{M}\sum\nolimits_{i=1}^{M}{F_{i}^{-1}}{{g}_{\omega }}\left( {{F}_{i}}\left( QR \right) \right)$ (14)
The above processing realized the simulation of various complex transformations of actual service scenes of prefabricated buildings, which ensured that the labeled information of the image was more objective.
In order to construct the matching point pair relationship of prefabricated building images, this paper constructed a twin network structure, which dealt with the image pairs with known transformation relationship, thus realizing self-supervision during the training process of feature descriptors. Figure 3 shows the construction process of matching point pairs. New image formed in randomly transformation operation in the previous section were divided with a 8×8 grid and the pixels with the highest probability in the grid were determined as the feature points of the image, based on the pixel-level feature point probability obtained from the feature point extraction network of the prefabricated building image. Transformation relationship F, the same as branch Y, was made for the points in branch X of the twin network structure, then the distance between the point i in X and the point j in branch Y was calculated. The corresponding distance matrix was given by the following formula:
$Dist\left( {{N}^{X}},{{N}^{Y}} \right)={{\left[ \left\| Fe_{i}^{X}-e_{j}^{Y} \right\| \right]}_{{{N}^{X}}*{{N}^{Y}}}}$ (15)
Figure 3. Construction process of matching point pairs of prefabricated building image
Figure 4. Schematic diagram of gradient information of local image statistics
Figure 4 shows the schematic diagram of gradient information of local image statistics, displaying the generation process of feature point descriptors. If the distance between the point i in X and the point j in branch Y was less than the preset threshold, then i and j could be considered as a matching point pair, and i and other pixels in Y as non-matching point pair. The matching point pairs needed to meet the following formula:
$R=\left\{ \begin{align} & 1,if\left| Fe_{i}^{X}-e_{j}^{Y} \right|\le 8 \\ & 0,others \\\end{align} \right.$ (16)
The feature descriptors of the prefabricated building image obtained in training became more specific, when the probability information of the feature points, obtained by the feature point extraction network, was incorporated into the process of constructing the matching point pairs of the image.
The loss function of the constructed feature point extraction and description algorithm model was mainly composed of two parts: the loss of the feature point extraction network of the prefabricated building image, and the loss of the local image feature description network.
Based on the differences between the estimated value of the feature point positions of the prefabricated building image and the self-labeled feature point positions of the image, this paper used the cross entropy loss function, which better measured the differences between the two probability distributions for calculation. Let A be the network output, B be the truth value, and QD and FD be the width and height of the output feature map, respectively, then there was:
${{K}_{e}}\left( A,B \right)=\frac{1}{{{F}_{D}}{{Q}_{D}}}\sum\nolimits_{f=1,q=1}^{{{F}_{D}}{{Q}_{D}}}{{{k}_{e}}\left( {{a}_{fq}};{{b}_{fq}} \right)}$ (17)
The cross entropy loss value of single 8×8 local image block could be obtained by the following formula:
$k_e\left(a_{f q} ; b\right)=-\log \left(\frac{\exp \left(a_{f q b}\right)}{\sum\,\,_{l=1}^{65} \exp \left(a_{f q l}\right)}\right)$ (18)
This paper defined the loss function of feature point description network of prefabricated building image based on the Scale Invariant Feature Transform (SIFT) algorithm. After the nearest neighbors were found based on the feature point matching of the image, the distance ratio of the first and second nearest neighbors was compared, and the false positive matching result was proposed. Based on the distance matrix of the feature point descriptors in the prefabricated building image, obtained from the SIFT matching rules, let xi and ej be the matching descriptors, then the following formula gave the expression of distance matrix L2:
$c\left( {{x}_{i}},{{e}_{j}} \right)=\sqrt{2-2{{x}_{i}}{{e}_{j}}},i=1,...,n;j=1,...,m$ (19)
For a matching point pairs xi and ej of the feature points of the prefabricated building image, let xi be the anchor sample, ej be the positive sample, ejmin (the non-matching descriptor nearest to xi) be the negative sample, xi and ej be the matching descriptor pair, and ejmin be the non-matching descriptor nearest to xi.
The optimization of the feature extraction network loss function actually aimed to ensure that the distance between xi and ej was as close as possible, and the distance between xi and ejmin was as far as possible, which could be achieved by setting the triple loss function of xi, ej and ejmin to adjust the model weight. The following formula gave the loss function expression of the feature point description network branch of the prefabricated building image:
${{K}_{C}}=\frac{1}{M}\sum\nolimits_{i=1}^{M}{c\left( {{x}_{i}},{{e}_{j}} \right)}+\max \left( 0,n-c\left( {{x}_{i}},{{e}_{j\min }} \right) \right)$ (20)
This paper set the parameter μ to adjust the contributions of the triple loss function of feature point descriptors of prefabricated building image and the cross entropy loss function of layout calibration position in order to balance the two loss functions. Let A and A' be the extracted feature points of the prefabricated building image, C and C' be the descriptors, B and B' be the truth values of the feature point positions of the image, and R be the automatically constructed matching point pair relationship, then there was:
$\begin{align} & K\left( A,A',C,C';B,B',R \right)={{K}_{e}}\left( A,B \right) \\ & +{{K}_{e}}\left( A',B' \right)+\mu {{K}_{C}}\left( C,C',R \right) \\\end{align}$ (21)
In the transformation conditions, such as image scale, rotation, light, Gaussian blur and so on, the model, obtained through training, effectively extracted the feature points of the prefabricated building image, and maintained good distinguishability and invariability of the feature regions, thus finally generating 512-dimensional floating point descriptors. The model had a relatively high feature matching rate, but it took up a lot of computer memory resources because image feature descriptors based on high-dimensional floating point representation needed to be stored. At the same time, if the distance between descriptors was measured by Euclidean distance, it also caused the computer to bear a huge amount of computation, indicating infeasible practical application.
Let xi, ej and ejmin be the defined triple descriptors, respectively, and Cf ( ) be the Hamming distance, then the following single loss function could be set:
$\begin{align} & {{K}_{c}}\left( {{x}_{i}},{{e}_{j}},{{e}_{j\min }} \right)={{C}_{f}}\left( {{x}_{i}},{{e}_{j}} \right) \\ & +\max \left( 0,{{C}_{f}}\left( {{x}_{i}},{{e}_{j\min }} \right) \right) \\\end{align}$ (22)
The loss function of the whole prefabricated building image was given by the following formula:
${{K}_{C}}=\frac{1}{M}\sum\nolimits_{i=1}^{M}{{{K}_{c}}}\left( {{x}_{i}},{{e}_{j}},{{e}_{j\min }} \right)$ (23)
The loss function given in the above formula was discrete and difficult to optimize. In order to facilitate the calculation, this paper relaxed the function to change it into differentiable function. The distance between descriptors was measured by Euclidean distance, and its binary constraint was replaced with L1 regularization term.
$\begin{align} K{}_{C}=\frac{1}{M}\sum\limits_{i=1}^{M}{\left\{ c\left( {{x}_{i}},{{e}_{j}} \right)+\max \left( 0,n-c\left( {{x}_{i}},{{e}_{j\min }} \right) \right) \right.} \left. +\gamma \cdot \left( {{\left\| {{x}_{i}}-1 \right\|}_{1}}+{{\left\| \left| {{e}_{j}} \right|-1 \right\|}_{1}}+\left\| \left| {{e}_{j\min }} \right|-1 \right\| \right) \right\} \end{align}$ (24)
The constraint of L1 regularization term made the value of the feature descriptor of the prefabricated building image closer to +1 and -1. When calibrating the layout of feature points, the value was binarized based on the sign function, which generated a binary descriptor that solved the deep occupation of computer memory resources in the process of operation and storage.
Table 1. Repetition rate of feature points of prefabricated building image
|
Number of sample set |
Approaches |
Number of feature points |
||
|
400 |
700 |
1000 |
||
|
1 |
VGG |
0.575 |
0.674 |
0.751 |
|
PCA-Net |
0.481 |
0.615 |
0.628 |
|
|
Model in this paper |
0.234 |
0.203 |
0.215 |
|
|
2 |
VGG |
0.310 |
0.416 |
0.431 |
|
PCA-Net |
0.301 |
0.421 |
0.426 |
|
|
Model in this paper |
0.231 |
0.210 |
0.242 |
|
|
3 |
VGG |
0.934 |
0.917 |
0.951 |
|
PCA-Net |
0.956 |
0.984 |
0.985 |
|
|
Model in this paper |
0.294 |
0.364 |
0.248 |
|
Figure 5. Time consumption changes of models in cases of different image numbers and feature point numbers
Table 2. Position error and extraction accuracy of feature points
|
|
Position error of feature points |
Mean Average Precision (mAP) |
|
Harris |
1.978 |
0.657 |
|
Shi-Tomasi |
1.654 |
0.612 |
|
Moravec |
2.102 |
0.748 |
|
FAST |
1.131 |
0.845 |
|
Model in this paper |
0.901 |
0.984 |
Table 3. Repetition rate of feature points in complex scenes
|
Repetition |
60 view changing scenes |
60 light changing scenes |
|
Harris |
0.741 |
0.613 |
|
Shi-Tomasi |
0.614 |
0.574 |
|
Moravec |
0.622 |
0.574 |
|
FAST |
0.641 |
0.643 |
|
Model in this paper |
0.604 |
0.525 |
Figure 6. Comparison results of error rate of each key pixel before and after relaxing the loss function
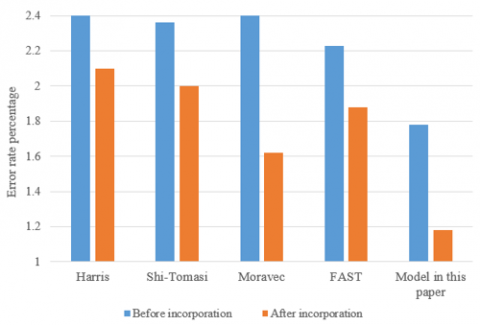
Figure 7. Statistics of layout calibration error rate before and after the incorporation of feature point probability information
This paper selected the sample set of self-built prefabricated building images of different styles for network training. The learning rate and batch processing scale of the network were set to 0.01 and 8, respectively. The adjustment range of light intensity, blur radius and the JPEG compression ratio of images were specified as [0.2,1], [0,5] and [0.2,1]. The rotation and scaling operations in affine transformation determined the rotation angle and scaling range as [0,360] and [0.9,1.1], respectively. Table 1 shows the repetition rate of feature points of the prefabricated building image. According to the table, the contrast models VGG and Progressive Co-Attention Network (PCA-Net) had high repetition rate indicators on the self-built sample set, while the model in this paper had low repetition rate indicators, mainly because the contrast models did not consider the slight affine transformation relationship contained in the prefabricated building image.
Figure 5 shows the time consumption changes of models in cases of different image numbers and feature point numbers, with sample set 1 as the sample set, and the PCA-Net model trained based on image blocks as the contrast model. According to the figure, the PCA-Net model is time-consuming because of its random sampling and image cropping operation, while the model in this paper, which directly generates response map based on convolution to extract feature points, has taken less calculation time.
In order to verify the quality of feature points extracted by the model for calibrating the prefabricated building layout, this paper calculated the error between the position estimation value of the feature points and the labeled information and the extraction accuracy rate. Table 2 shows the comparison of several common corner detection methods with the model in this paper in terms of error and mAP value. According to the table, the feature points provided by the model in this paper are more reliable when calibrating the layout of prefabricated buildings.
Table 3 shows the repetition rate of feature points in the complex scenes of changing view and light. According to the table, quality of the feature points, obtained based on the common corner detection methods, is poor in adapting to the scenes of changing view and light. However, this paper proposed to enhance the feature description of prefabricated building image blocks based on feature point location information, which was effective. In addition, the provided feature points had good feature point repeatability results when calibrating the prefabricated building layout in complex scenes.
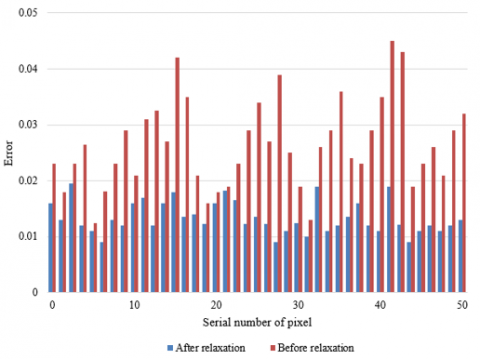
The extraction error rate of each key pixel of the test image sample was quantitatively measured. Figure 6 shows the comparison results of error rate for each key pixel before and after relaxing the loss function. The red column represents the calibration error rate of feature point layout of the prefabricated buildings, obtained by the model before the loss function was relaxed. The blue column represents the error rate, obtained by the model after the loss function was relaxed.
According to the figure, the model has achieved a lower error rate on almost all key pixels of the image after the loss function relaxation, and the error distribution is more average compared with the error distribution before the loss function relaxation. Therefore, the model in this paper was further used as the final model to calibrate the feature point layout of prefabricated buildings.
Finally, this paper discussed whether the probability information of feature points should be incorporated into feature point extraction of prefabricated buildings. Figure 7 shows the statistical results of layout calibration error rate before and after incorporating the feature point probability information. The blue column represents the calibration error rate of feature point layout of the prefabricated building, obtained by the model before the feature point probability information was incorporated. The orange column represents the error rate of the model after the feature point probability information was incorporated. According to the figure, each method has achieved lower calibration error of feature point layout after the feature point probability information was incorporated. However, the model in this paper has obtained the lowest calibration error no matter whether the probability information was incorporated or not.
This paper studied the calibration method of feature point layout of prefabricated buildings based on image recognition technology. Based on the elaboration of the core idea of the task of feature point extraction in the prefabricated building images, this paper proposed a new feature extraction network suitable for these feature points, and described in detail its principle. With the help of deep learning technology, this paper enhanced the feature description of prefabricated building image blocks based on feature point location information, and introduced in detail the feature point extraction and description algorithm model. Combined with the experiment, this paper gave the repetition rate of feature points of prefabricated building images. The results showed that the repetition rate indicators of the model constructed in this paper were lower on the self-built sample set, while the contrast models VGG and PCA-Net had higher repetition rate indicators. Then the paper gave the time consumption changes of models when the number of images and feature points was different, verifying that the model in this paper, which directly generated response map based on convolution to extract feature points, took less calculation time. In addition, the paper compared several common corner detection methods with the model in this paper in terms of error and mAP value, as well as gave the feature point repetition rate in the complex scenes of view and light transformation, which verified that the feature points provided by the model in this paper were more reliable when calibrating the prefabricated building layout. Finally, this paper discussed whether the probability information of feature points needed to be incorporated into the feature point extraction of prefabricated buildings, which verified that the model in this paper had the lowest calibration error of feature point layout regardless of whether the probability information was incorporated or not.
[1] Son, R.H., Han, K. (2023). Automated model-based 3d scan planning for prefabricated building components. Journal of Computing in Civil Engineering, 37(2): 04022058. https://doi.org/10.1061/%28ASCE%29CP.1943-5487.0001055
[2] Li, X., Xie, W., Yang, T., Lin, C., Jim, C.Y. (2023). Carbon emission evaluation of prefabricated concrete composite plates during the building materialization stage. Building and Environment, 232: 110045. https://doi.org/10.1016/j.buildenv.2023.110045
[3] Tan, Y., Chen, L., Wang, Q., Li, S., Deng, T., Tang, D. (2023). Geometric quality assessment of prefabricated steel box girder components using 3d laser scanning and building information model. Remote Sensing, 15(3): 556. https://doi.org/10.3390/rs15030556
[4] Wang, B. (2022). Systematic framework of economic KPIs for prefabricated building construction. In Proceedings of the 2022 International Conference on Green Building, Civil Engineering and Smart City, Guilin, China, pp. 403-411. https://doi.org/10.1007/978-981-19-5217-3_40
[5] Ding, H., Li, M., Zhong, R.Y., Huang, G.Q. (2023). Multistage self-adaptive decision-making mechanism for prefabricated building modules with IoT-enabled graduation manufacturing system. Automation in Construction, 148: 104755. https://doi.org/10.1016/j.autcon.2023.104755
[6] Song, Y., Wang, J., Lu, J., Si, X. (2023). Research on collaborative scheduling of multiple projects of prefabricated building based on the niche genetic-raccoon family optimization algorithm. Alexandria Engineering Journal, 64: 1015-1033. https://doi.org/10.1016/j.aej.2022.08.054
[7] Chen, Y., Qi, Y., Huang, H., Chen, J., Huang, K. (2022). Synthesis and application of tackifying resin in silane modified polyether adhesive for prefabricated building. In Proceedings of the 2022 International Conference on Green Building, Civil Engineering and Smart City, Guilin, China, pp. 176-184. https://doi.org/10.1007/978-981-19-5217-3_16
[8] Xiao, Y., Bhola, J. (2022). Design and optimization of prefabricated building system based on BIM technology. International Journal of System Assurance Engineering and Management, 13(S1): 111-120. https://doi.org/10.1007/s13198-021-01288-4
[9] Zhao, P., Liu, X., Liang, Z. (2022). Destruction feature extraction of prefabricated residential building components based on bim. Scientific Programming, 2022: 1-12. https://doi.org/10.1155/2022/5798625
[10] Wang, L., Zhang, Y., Huang, X. (2022). The site layout and optimization research on BIM-based prefabricated building construction. In Application of Intelligent Systems in Multi-modal Information Analytics: The 4th International Conference on Multi-modal Information Analytics (ICMMIA 2022), Huhehaote, China, pp. 154-161. https://doi.org/10.1007/978-3-031-05484-6_19
[11] Chang, C., Dai, B. (2022). Safety risk optimization of prefabricated building construction based on improved bat algorithm. In 2022 41st Chinese Control Conference (CCC), Hefei, China, pp. 2059-2064. https://doi.org/10.23919/CCC55666.2022.9902239
[12] Tanaka, K., Zhang, Y. (2022). Single-image camera calibration for furniture layout using natural-marker-based augmented reality. IEICE Transactions on Information and Systems, 105(6): 1243-1248. https://doi.org/10.1587/transinf.2021EDL8086
[13] Zou, J., Yang, D. (2022). Measurement accuracy analysis of multilateral method based on optimal layout with non-directional point calibration. Geomatics and Information Science of Wuhan University, 47(10): 1758-1765. https://doi.org/10.13203/j.whugis20220456
[14] Peng, C., Tang, F., Wang, X., Li, J. (2020). Calibration method of shear amount based on the optical layout of point source microscope for lateral shearing interferometric wavefront sensor. Optical Engineering, 59(9): 094106-094106. https://doi.org/10.1117/1.OE.59.9.094106
[15] Shimizu, H., Yamashita, R., Hashiguchi, T., Miyata, T., Tamaru, Y. (2018). Square layout four-point method for two-dimensional profile measurement and self-calibration method of zero-adjustment error. International Journal of Automation Technology, 12(5): 707-713. https://doi.org/10.20965/ijat.2018.p0707
[16] Du, Y., Wu, Z.X., Xie, M.W., Lü, F.X., Yu, G. (2018). Optimal layout of calibration target in terrestrial laser scanning. Guangxue Jingmi Gongcheng/Optics and Precision Engineering, 26(4): 757-763. https://doi.org/10.3788/OPE.20182604.0757
[17] Zhang, W., Lao, D., Zhou, W., Zhu, H. (2018). Self-calibration method based on multi-head reading layout. Acta Optica Sinica, 38(8): 0812001. https://doi.org/10.3788/AOS201838.0812001
[18] Wang, K., Shen, X., Xing, J., Liu, Q., Shi, X., Wu, K., Gu, Y., Zhang, R., Zhu, Y., Shao, F., Du, C. (2013). Limitation of layout correction on improvement of OPC model calibration. ECS Transactions, 52(1): 267. https://doi.org/10.1149/05201.0267ecst
[19] Cilento, T., Yun, C.S., Terterian, A., Lee, C.H., Moon, J.E., Lee, S.W., Kwon, H., Seung M. Lee, S. (2018). Investigation of layout effects in diode-triggered SCRs under very-fast TLP stress through full-size, calibrated 3D TCAD simulation. Microelectronics Reliability, 88: 1103-1107. https://doi.org/10.1016/j.microrel.2018.07.064
[20] Sansoni, G., Bellandi, P., Docchio, F. (2013). 3D system for the measurement of tube eccentricity: an improved, rugged, easy to calibrate layout. Measurement Science and Technology, 24(3): 035901. https://doi.org/10.1088/0957-0233/24/3/035901
[21] Feng, H.P., Zhang, L.W. (2020). Location of feature points in 3D reconstruction of multi vision color image based on principal component analysis. In Proceedings of the 13th EAI International Conference on Mobile Multimedia Communications, Mobimedia 2020, Harbin, China, EAI, https://doi.org/10.4108/eai.27-8-2020.2295947
[22] Cheng, W. (2022). Research on automatic tracking method of marker points in sports image sequence based on feature matching. In Proceedings of the 3rd Asia-Pacific Conference on Image Processing, Electronics and Computers, Dalian, China, Association for Computing Machinery, New York, United States, pp. 847-852. https://doi.org/10.1145/3544109.3544366
[23] Yin, T., Lv, Z. (2022). Optimal extraction method of feature points in key frame image of mobile network animation. Mobile Networks and Applications, 27: 2515-2523. https://doi.org/10.1007/s11036-022-02070-x
[24] Wang, F., Liu, Z., Zhu, H., Wu, P., Li, C. (2021). An improved method for stable feature points selection in structure-from-motion considering image semantic and structural characteristics. Sensors, 21(7): 2416. https://doi.org/10.3390/s21072416
[25] Guo, Q.D., Quan, Y.M. (2020). Coarse registration of dense point clouds based on image feature points. In 2020 4th Annual International Conference on Data Science and Business Analytics (ICDSBA), Changsha, China, IEEE, pp. 275-279. https://doi.org/10.1109/ICDSBA51020.2020.0007