Fatih Titrek*![]() | Ömer K. Baykan
| Ömer K. Baykan![]()
© 2023 IIETA. This article is published by IIETA and is licensed under the CC BY 4.0 license (http://creativecommons.org/licenses/by/4.0/).
OPEN ACCESS
Biometric Recognition Systems allow individuals to be automatically authenticated or identified by using their unique characteristics. Finger vein (FV), widely used for this purpose, has a crucial place among biometric systems because of its advantages, which are user-friendliness, ability to detect living tissue, high reliability, low system cost, and less area requirement in installation. It has a wide usage area, especially in places where personal safety is at the forefront. In this study, we examine the effect of the Horizontal and Vertical Total Proportion (HVTP) feature extraction algorithm on the success rate when the fusion technique is applied. Homomorphic Filter (HF) and Perona-Malik Anisotropic Diffusion (PMAD) are used to remove the noise and light scattering issue in the FV databases, and Gray Level Run Length Matrices (GLRLM), Gray Level Co-occurrence Matrices (GLCM), Segmentation-based Fractal Texture Analysis (SFTA), Horizontal Total Proportion (HTP), and Vertical Total Proportion (VTP) methods are applied to describe texture features. The fusion of multiple features instead of using only one type of feature can improve the accuracy of FV recognition systems. The novelty of the study is the fusion of HTP and VTP with the GLRLM, GLCM, and SFTA features by using Yang finger vein databases (Database_1) and MMCBNU_6000 (Database_2). Experimental results reveal that the HTP and VTP significantly improved the classification success in these FV image databases. The best success rate achieved in the Ensemble classifier is 99.7% using Database_1 and 97.6% using Database_2.
biometrics, feature extraction, finger vein, fusion, GLRLM, GLCM, HVTP, SFTA
In today's world, where security is becoming more important, personal authentication methods are also updating themselves to close existing security gaps with the developing technology. Although some Biometric Recognition methods, such as fingerprint [1-3], palmprint [4, 5], retina [6-8], iris [8, 9], and face recognition [10, 11], used for this purpose, are used for tracking, entry-exit access permission control, and security purposes, they have some disadvantages compared to FV recognition. Among them, fingerprint and palmprint recognition systems create a security vulnerability because of unable to control whether the tissue is alive or not, being on the exterior surface of the body, and copied easily. Although the recognition success is high in methods such as retina and iris recognition, it may result in people don’t want to use it due to the difficulties they have in keeping their eyes on a light source and the high installation costs. Therefore, it is not suitable for general use and is preferred in areas where security is high-level. Face recognition methods are not preferred by most institutions and organizations where security is at the forefront. Because in biometric systems where only face recognition is used, security can be easily circumvented by using the vulnerabilities of face recognition. These systems also have some disadvantages related to noise, sustainability problems, and security gaps. They also include concerns such as violations of rights and freedoms that may occur as a result of obtaining and processing face data without our consent by using cameras [12-14]. Vein recognition systems are preferred instead. FV recognition systems are used as an additional security measure by banks and large-scale financial sectors in various countries worldwide, due to their user-friendliness, ability to detect living tissue, high reliability, low system cost, and less area requirement in installation [15] compared to other biometric recognition systems [12, 16-19]. At the same time, it was mentioned in a study by Kumar, A. and Y. Zhou that despite being genetically identical, FV images are distinct among identical twins, and the FV meshwork is unique for every finger [20].
The theoretical base for FV recognition originated from the experience that hemoglobin in vessels can absorb specific near-infrared (NIR) rays within the range of 740-960 nm, which are capable of passing through human skin. As a result, regions of the tissue with high vein density appear dark due to the lower reflection of infrared rays in those areas. These veins can be visible using NIR sensitive Charge Couple Device (CCD) cameras [21]. Although FV systems possess unique features, discerning the vascular region presents some challenges due to the light scattering within the tissue. This light scattering problem reduces the veins' visibility and, hence, the success of the classification [22]. Therefore, the HF and PMAD were used to get rid of light scattering and noise, respectively, and our image was prepared to extract GLRLM, GLCM, and SFTA features. After that Niblack segmentation and morphological operations are used to extract the HTP and VTP features. The fusion of multiple features instead of using only one type of feature can improve the accuracy of FV recognition systems. In this study, the fusion of HVTP features with the GLRLM, GLCM, and SFTA features is examined by using Database_1 and Database_2. The best result achieved in the Ensemble classifier is 99.7% using Database_1 and 97.6% using Database_2.
This paper is structured as follows: Section 2 provides a review of the literature on FV recognition, while Section 3 outlines the flowchart of our proposed algorithm and the research methodology that we proposed. Section 4 contains details about the materials and methods used in the study. In Section 5, the results of our research are presented, and comparisons are interpreted with similar studies found in the literature. Finally, Section 6 concludes the study by summarizing the key findings.
The aspects of the research conducted in finger vein recognition processes that are examined in our study can be divided into two categories. The first category encompasses studies aimed at enhancing the quality of obtained finger vein images. The second category encompasses studies that concentrate on increasing the success rate through the development of new feature vectors and the application of fusion techniques.
Numerous studies have been conducted to enhance the quality of images, with respect to the poor quality of FV images. Fu et al. [23] combined Fuzzy and Retinex theory to enhance the contrast between the vein patterns and their surrounding areas in vascular images obtained by NIR sensitive cameras. The optimal fuzzy transformation was utilized to improve the overall contrast of the image. To address the limitation of the optimal fuzzy transformation in preserving image details, this method was applied to enhance the contrast between the finger vein patterns and the surrounding areas . In the study of Gao et al. [24], a filter is utilized in the image to increase the high frequency, and the histogram equalization method is used to boost contrast. Oh and Hwang [25] proposed a novel morphology-based HF technique to improve the contrast of the features in medical images. This approach involves breaking down an image into morphological sub-bands, which are enhanced using a HF. In order to optimize the image enhancement, they utilized a differential evolution algorithm to determine the most suitable gain and structuring element for each sub-band. In their study, Yang et al. [26] proposed an image restoration technique that utilizes scattering removal to enhance finger vein images. To describe the degradation of finger vein images, the authors used a biological optical model based on light scattering in living tissues. This method enhances the contrast of finger vein images and improves the accuracy of finger vein image matching. In the studies of Yang and Shi [27], an approach for enhancing the venous region and segmenting FV images using a Directional Filter method based on the Gabor Filter is proposed. Their approach also includes a matting-based segmentation method that can accurately extract the finger vein networks while accounting for variations in vein intensity and diameter. Shin et al. [28] presented a fuzzy-based fusion technique to improve the FV visibility by using the Gabor Filter in four directions and the Retinex Filter. A fuzzy-based method is used to decide optimal weights for combining the two filtered images produced after Gabor and Retinex filtering. The input features for the fuzzy rule and membership function are derived from local windows, and specifically, the means and standard deviations (SD) of the images within those windows are used. This method eliminates the need for additional training data in image enhancement.
The success rate of the studies in the Biometric Recognition Systems field by using the FV shows the effectiveness of biometric recognition processes using FV systems. Many methods have been employed to extract illustrative features from the finger vein databases and utilization of fusion techniques. A new feature extraction method, called principal component local conservation projections, based on a combination of principal component analysis and locality preserving projections (PCLPP) techniques, was proposed in 2022 by Feng et al. [29] The experiments revealed that the accuracy of classification using the feature vector extracted by the PCLPP technique of finger vein recognition outperforms both Principal Component Analysis (PCA) and Locality Preserving Projections (LPP). Additionally, PCLPP showed improved recognition rates across various categories compared to PCA and LPP. Lastly, the results indicated that PCLPP is less affected by noise compared to PCA and LPP. The highest recognition rate of the PCLPP technique is 92.33% using 600 classes of finger vein data. Zhang et al. [30] proposed an Adaptive Gabor Convolutional Neural Network (AGCNN) with receptive field properties to design Gabor convolutional layer in 2022. In the study, it is claimed that AGCNN possesses both characteristics of the Gabor Filter and those of a neural network. The study performed on the MMCBNU_6000 dataset revealed that the highest classification accuracy using the CNN-RAW model is 91.72%. In the study performed by Lu et al. [31] in 2021, a new region of interest extraction method was proposed depending on the characteristics of the FV image and compared with some representative methods. The equal error rates calculation of the proposed method on the MMCBNU_6000 dataset is 5.49% by using maximum curvature, and 3.33% by using repeated line tracking feature extraction method. A curvature algorithm is proposed to extract the feature by calculating the eigenvalues of the image’s Hessian matrix, Yong [32] in 2020. In 2019, a new method for feature extraction was proposed by Yang et al. [33] It is known as polarized depth-weighted binary direction coding, and it involves three components: polarized direction extraction, extended normalized angular binary coding, and self-adaptive depth-dependent weighting. On the other hand, Ma and Zhang [34] proposed a new technique involving the extraction of interested regions and oriented elements, based on finger vein patterns. The study employs a region of interest based on rotation rectification to mitigate the effects of rotation and translation during the acquisition of finger vein images. To extract the direction feature, the texture and stable orientation properties of finger vein images are utilized. This is accomplished by computing the gradient magnitude and orientation of points along the finger vein lines in the fuzzy segmentation region. The use of the extracted feature proves effective in addressing the challenge of geometric deformation. JosephP and Ezhilmaran [35] conducted a study in 2018, which examined the effectiveness of affine invariant attributes in FV images through the use of fuzzy image retrieval. To minimize the computational time of the affine invariant features, the database size is reduced through fuzzy-based image retrieval. According to the study, the experimental results demonstrate improved performance and significantly lower error rates compared to conventional feature matching algorithms. In 2017, Babu et al. [36] investigated two new score-level combinations, holistic and non-linear fusion, and check their effectiveness against more popular score-level fusion approaches. In 2016, Sikarwar and Manmohan [37] analyzed various techniques of local directional patterns to enhance the reliability of finger vein recognition. The local directional pattern was utilized to compute the edge response in eight directions and to assess each pixel position. The accuracy was evaluated using finger vein image samples, yielding a success rate of 86.1635%. Matsuda et al. [38] proposed a method for FV Authentication based on Feature Point Matching. The efficiency of this method evaluated the robustness against irregular shading and deformation. Matsuda et al. compared the accuracies of the study with some conventional methods based on template matching. Khellat-Kihel et al. [39] proposed an identification system using a multimodal-fusion technique by adopting several techniques at different levels. This multimodal-fusion technique utilizes the fusion of finger vein, finger-knuckle print, and fingerprint. The system employs a combination of methods at different levels for the multimodal-fusion, including feature-level fusion and decision-level fusion. An optimization method is introduced to improve the feature level fusion, which involves reducing the feature space by applying various methods. In 2015, Ma et al. [40] proposed a new FV and fingerprint authentication system based on multi-route detection. This study introduces a new biometric identity authentication system that combines fingerprint and finger vein recognition using a multi-route approach. The system first designs separate classifiers for fingerprint and finger vein images, then fuses the feature vectors extracted from the first stage to form a third classifier. The last recognition outcome is obtained by aggregating the results of the three classifiers at the decision level. The conclusion of the research shows that the algorithm surpasses the limitations of single-modal biometrics and enhances the overall recognition performance. Kaur and Mishra [41] emphasized improving the effectiveness of the finger vein networks by merging the repeated line tracking, Gabor Filter, and segmentation with Neural Networks. Rosdi et al. [42] used a feature extraction algorithm called local line binary pattern as a new texture descriptor. Unlike the local binary pattern that uses a square shape as the neighborhood configuration, the local line binary pattern uses a straight line configuration. In the study of Yang et al. [43], a novel approach is proposed that combines Gabor wavelets and circular Gabor filter. This method highlights the finger-vein networks and removes non-vascular regions. The process begins with the application of Gabor wavelets to improve the vascular regions in the image, followed by image restoration by a combination rule. Lastly, the extraction of finger veins is accomplished using a circular Gabor filter. Yang and Li's [44] study addressed the challenges of finger vein localization and feature extraction. The physical characteristics of human fingers are utilized to locate the Region of Interest (ROI) in the finger vein images based on inter-phalangeal joint information and eliminate non-informative vein content. Then, the vein images are characterized using a series of energy features obtained through the application of steerable filters and classified using the Nearest Neighbor Classification method. Despite the extensive research conducted in the literature, there is still a need for further efforts to obtain more discriminative features and new fusion techniques should be applied to achieve better results.
In this study, the effect of the HVTP feature, which was proposed as a novel feature extraction method in the study of Titrek and Baykan [45], on the success rate after using the fusion technique with GLRLM, GLCM, and SFTA feature extraction is investigated. HF and PMAD are employed to address the noise and light scattering issues in our FV image databases. Texture features are described using GLRLM, GLCM, SFTA, HTP, and VTP methods. The fusion of multiple features, as opposed to relying on a single feature, is expected to enhance the accuracy of FV recognition systems. The study's contribution lies in the fusion of HTP and VTP with GLRLM, GLCM, and SFTA features.
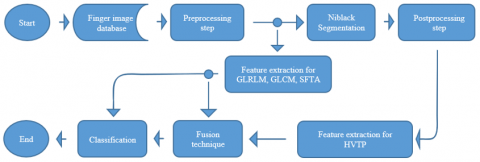
In the present study, the success rates of textural features such as GLRLM, GLCM, and SFTA, which are extracted from FV images enhanced with HF and PMAD, as a result of fusion with the HVTP features are concentrated. HVTP is a novel feature extraction algorithm proposed by Titrek and Baykan [45]. The finger vein recognition system is proposed in Figure 1. Niblack Segmentation algorithm is applied to the preprocessed images to obtain the HVTP features, and then morphological operations are performed in the postprocessing step to increase the vessel visibility. With the skeletonization algorithm, the vessel structure in the image is revealed and the HVTP features are obtained.
The most important step after extracting the features is the selection of the classifier. A proper classifier should be selected to obtain a successful result from the system. The classification is applied with Ensemble, K-Nearest Neighbors (KNN), Support Vector Machine (SVM), Decision Trees, and Discriminant Analysis methods, and the results of Ensemble and KNN classifier had the highest success rate, are given.
Figure 1. Flowchart of FV identification algorithm
One of the reasons for the low quality of the images obtained in biometric studies is the light scattering that occurs in the images obtained from the tissue. HF and PMAD are applied to the image to get rid of light scattering and noise. The preprocessing result obtained is shown in Figure 2. After the preprocessing step, the features are obtained from the image by using the GLRLM, GLCM, and SFTA feature extraction algorithms and moved to the classification step.
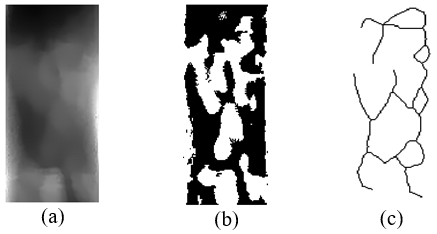
Figure 2. Result of preprocessing before GLRLM, GLCM, and SFTA is applied. (a) Input image (b) Preprocessing result
In this study, the HVTP features are made extractable by applying the Niblack Segmentation algorithm to the image obtained after the preprocessing step, so the vascular region and the non-vascular tissue are separated. The image is enhanced using morphological operators, and then the skeletonization technique is used. The skeleton of the vascular area is created, shown in Figure 3. HVTP features are obtained from this skeletonize image. After the HVTP features are extracted from the resulting image, these features make a fusion with the GLRLM, GLCM, and SFTA features are done, and then proceed to the classification step. The extracted feature set is classified by Ensemble, KNN, SVM, Decision Trees, and Discriminant Analysis classification methods, and success rates are obtained. Finally, the most distinctive attributes of the GLRLM + HVTP, GLCM + HVTP, and SFTA + HVTP feature sets are chosen by the Relieff algorithm [46].
Figure 3. Result of postprocessing before HVTP is applied. (a) Preprocessing result, (b) Result of Niblack segmentation, (c) Morphological process result
4.1 Finger vein image databases
Experiments are carried out on two different available databases for this study. First of them is the database used in [47] which will be referred to as Database_1 in this study. And the second one is the MMCBNU_6000 finger vein database which will be referred to as Database_2 [48].
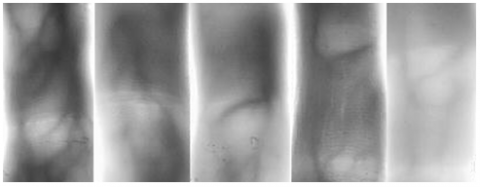
Yang and Zhang [47] from Tianjin Key Lab for Advanced Signal Processing were asked to submit a sample of the FV image databases they used in their study. The samples’ resolutions in the finger vein database, which consists of 15 index finger data of 64 individuals, are generally 170x80 pixels and stored in JPG format. Database_1 consists of 960 images total and FV images in this database were captured using a NIR sensitive CCD camera over a 760 nm wavelength NIR light source [44]. Figure 4 shows some FV images from Database_1.
Figure 4. Original images in Database_1 for separate classes
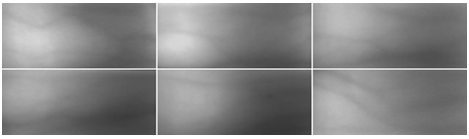
Database_2, also known as MMCBNU_6000, is a finger vein image database that contains images from 100 people. The images were collected by the Division of Electronic and Information Engineering at Chonbuk National University. Each person was requested to provide images of the index finger, middle finger, and ring finger from both the left and right hands. Thus, obtained 60 FV images by taking ten pictures from each of the six fingers of every volunteer. Hence, a total of 6000 FV images were obtained from 100 volunteers. The samples' resolutions in the finger vein database are 480x640. The extracted ROI images were normalized to 60x128 pixels and stored in BMP format [48]. The images taken from six separate fingers of both hands were accepted as different classes and increased the number of classes from 100 to 600. Figure 5 shows some FV images taken from six different fingers of a volunteer.
Figure 5. Original ROI images in different classes of each finger of a volunteer in Database_2
4.2 Homomorphic filter
The visibility of FV is significantly challenged by image distortion resulting from light scattering in the tissue. To address this issue, HF is applied to enhance the vein region visibility by removing the light scattering present in the image. HF works by eliminating local imbalances in the image exposure. The distribution of light in an image is determined by multiplying the reflectance of objects with the illumination of the scene, and this theory forms the basis of the HF.
$\operatorname{Img}(i, j)=\operatorname{LightSource}(i, j) \cdot \operatorname{RefObject}(i, j)$ (1)
Img(i,j) is the resulting image while LightSource(i,j) is the intensity of the illuminating Light source. RefObject(i,j) is the reflectance of the object scaled between 0 and 1. It is assumed that the illumination in the image possesses low pass characteristics [49]. That's why a high pass filter is needed after taking a Fourier Transform of the image. This process is followed by the inverse Fourier transform and the contributions of the light source are effectively separated from the image based on the quality of the filter choice. The application of the HF to the finger vein image eliminates light scattering from the image. Figure 6 shows a sample result of a HF.
Figure 6. Result of HF
4.3 Perona-Malik anisotropic diffusion
To achieve more successful segmentation of the veinous area in the image, which is free from light scattering, it is necessary to remove the noise in the image. This can be accomplished by applying a smoothing process to the image. The process of smoothing an image can be explained as the outcome of a diffusion process that does not compromise the important data content, which is based on Fick's law [50]. PMAD is a space-variant smoothing filter that employs non-linear anisotropic diffusion based on the content of the data. It is designed to reduce high frequency components while preserving important parts of the data. The filter achieves this by adjusting the diffusivity signal according to the content of the data. The diffusivity will change according to the selected diffusion coefficient (DC) between 0 and 1. When the DC is set to 1, the output obtained from PMAD will be the same as the Linear Diffusion filter [51]. However, as the process nears the significant parts of the data, the DC approaches to zero. The DC is calculated in Eq. (2) by utilizing the magnitude of the first derivative.
$\text{DC}=g{{(\frac{\partial }{\partial x}u)}^{2}}$ (2)
Through the use of Eq. (2), the PMAD equation [52] is obtained in Eq. (3) where u is the input data.
$\frac{\partial u}{\partial t}=\frac{\partial }{\partial x}(DC)$ (3)
The result is obtained in Eq. (4) where the λ is a contrast parameter that distinguishes between areas of forward diffusion and those of backward diffusion.
$g(\frac{\partial }{\partial x}u)=\frac{1}{(1+(\frac{{{(\frac{\partial }{\partial x}u)}^{2}}}{{{\lambda }^{2}}}))}$ (4)
Figure 2 depicts the resultant image obtained through the application of the PMAD to the output image of the HF.
4.4 Niblack segmentation
The FV images often exhibit light scattering and contrast issues, therefore, the use of a multi thresholding method is required. One of the locally adaptive multi thresholding algorithms is Niblack's Segmentation [53]. Threshold values are calculated at each pixel depending on the local mean and local SD of the neighboring pixels' intensity values by using Eq. (5).
$T(i, j)=m(i, j)+k \cdot \sigma(i, j)$ (5)
The algorithm uses a fixed-size window to calculate the mean of the sum of pixels (m) and the SD (σ) of the window. A constant value k is chosen by the user to adjust the threshold value. If the k is chosen as 0 then the threshold value is determined only by the local mean. The window dimension should be chosen to balance between preserving image details and reducing noise. An output image of Niblack’s Segmentation is shown in Figure 3.
4.5 Feature extraction methods
Textural features are a crucial component to characterize the spatial relationship between each pixel and its neighboring pixels. This technique characterizes images to determine changes in functional characteristics. In the present study, the feature sets were generated by using the gray level run length matrices, the gray level co-occurrence matrices, the segmentation-based fractal texture analysis, and the Horizontal and Vertical Total Proportion.
4.5.1 Gray level run length matrices method
GLRLM is a method of trying to obtain information about the texture feature of an image. This method is based on counting the number of pairs of gray level values and the length of runs in the ROI area with their directions. A gray level run can be expressed as a set of pixels with the same gray value distributed as successively and collinearly in the ROI along with some defined directions to the system. Thus, it is tried to obtain information about the texture feature of an image. The length of the gray level run refers to the number of pixels counted within a specific ROI [54, 55]. This value is also associated with each run, providing further information about the properties of the image. For a given image, gray level run length matrice P(i, j | θ) gives the number of occurrences for the pixel gray level ‘i’ in the direction ‘θ’ repeated consecutively for ‘j’ times. GLRLM is computed for each image in four directions, θ=0º, 45º, 90º, 135º. From each of the matrices, we have considered 11 statistical features derived in the study of Belur et al. [56-58]. Therefore, 4x11 feature vectors are created in total for every direction.
Five run length statistical features are derived by Galloway [58] using GLRLM P(i, j | θ) as follows. The equations use abbreviations for the terms Run Emphasis (RE), Gray Level (GL), and Gray Level Emphasis (GLE).
$Short\text{ }RE\text{ = }\frac{1}{{{n}_{r}}}\sum\limits_{i=0}^{{{N}_{GL}}-1}{ \sum\limits_{j=1}^{{{N}_{RL}}}{\frac{P(i,j\text{ }|\text{ }\theta )\text{ }}{{{j}^{2}}}}}$ (6)
$Long\text{ }RE\text{ = }\frac{1}{{{n}_{r}}}\sum\limits_{i=0}^{{{N}_{GL}}-1}{ \sum\limits_{j=1}^{{{N}_{RL}}}{P(i,j\text{ }|\text{ }\theta )\cdot {{j}^{2}}}}$ (7)
$GL\text{ }Nonuniformity\text{ = }\frac{1}{{{n}_{r}}}{{\sum\limits_{i=0}^{{{N}_{GL}}-1}{ \left( \sum\limits_{j=1}^{{{N}_{RL}}}{P(i,j\text{ }|\text{ }\theta )} \right)}}^{2}}$ (8)
$Run\text{ }Length\text{ }Nonuniformity\text{ = }\frac{1}{{{n}_{r}}}{{\sum\limits_{j=1}^{{{N}_{RL}}}{ \left( \sum\limits_{i=0}^{{{N}_{GL}}-1}{P(i,j\text{ }|\text{ }\theta )} \right)}}^{2}}$ (9)
$Run\text{ }Percentage\text{ = }\frac{{{n}_{r}}}{{{n}_{p}}}$ (10)
where, NGL is the number of gray levels, NRL is the maximum run length, nr is the total number of runs, and np is the total number of pixels in the image. The two more features of run length statistics based on the idea to highlight further the effect of gray level information derived by Chu et al. [57] are as follows.
$Low\text{ }GL\text{ }RE\text{ = }\frac{1}{{{n}_{r}}}\sum\limits_{i=0}^{{{N}_{GL}}-1}{ \sum\limits_{j=1}^{{{N}_{RL}}}{\frac{P(i,j\text{ }|\text{ }\theta )\text{ }}{{{i}^{2}}}}}$ (11)
Four more run length statistical features based on increasing the effect of gray level and run length information on the features are derived by Dasarathy and Holder [56] and presented as follows.
$Short\text{ }Run\text{ }Low\text{ }GLE\text{ = }\frac{1}{{{n}_{r}}}\sum\limits_{i=0}^{{{N}_{GL}}-1}{ \sum\limits_{j=1}^{{{N}_{RL}}}{\frac{P(i,j\text{ }|\text{ }\theta )\text{ }}{{{i}^{2}}\cdot {{j}^{2}}}}}$ (13)
$Short\text{ }Run\text{ }High\text{ }GLE\text{ = }\frac{1}{{{n}_{r}}}\sum\limits_{i=0}^{{{N}_{GL}}-1}{ \sum\limits_{j=1}^{{{N}_{RL}}}{\frac{P(i,j\text{ }|\text{ }\theta )\cdot {{i}^{2}}\text{ }}{{{j}^{2}}}}}$ (14)
$Long\text{ }Run\text{ }Low\text{ }GLE\text{ = }\frac{1}{{{n}_{r}}}\sum\limits_{i=0}^{{{N}_{GL}}-1}{ \sum\limits_{j=1}^{{{N}_{RL}}}{\frac{P(i,j\text{ }|\text{ }\theta )\cdot {{j}^{2}}\text{ }}{{{i}^{2}}}}}$ (15)
$Long\text{ }Run\text{ }High\text{ }GLE\text{ = }\frac{1}{{{n}_{r}}}\sum\limits_{i=0}^{{{N}_{GL}}-1}{ \sum\limits_{j=1}^{{{N}_{RL}}}{P(i,j\text{ }|\text{ }\theta )\cdot {{i}^{2}}\cdot {{j}^{2}}}}$ (16)
4.5.2 Gray level co-occurrence matrices method
Statistical features extracted from the relationship between the intensity values of the pixels are one of the methods used in recognizing and distinguishing objects. The features extracted by Haralick and Shanmugam [59] are applied to FV recognition systems, and their distinctiveness is examined in this study. These features make quadratic statistical inferences about the properties of the image by calculating the spatial relationship of the pixels. In general, the relationship between the structure of an image and the objects is assumed to be hidden in the spatial relationship of the gray tones in the image to each other. This texture-context information, expressed as P(i, j | d, θ) in our grayscale image, is assumed to be determined as the distance d at an angle θ for the i and j, which are two neighboring resolution pixel values. Matrice obtained from the grayscale image gives a function of the distance and angular relationship between neighbor resolution cells.
In the present study, 20 GLCM features based on the second-order statistical probability derived in the studies [59-62] are used. Let P(i, j) be the (i, j)th entry in a normalized gray level spatial dependence matrices and Ng be the number of distinct gray levels in the quantized image. The equations use abbreviations for the terms Inverse Difference (ID), Information Measures of Correlation (IMC), and Maximal Correlation Coefficient (MCC).
Suppose that,
$\begin{gathered}P_{x+y}(k)=\sum_{i=1}^{N_g} \sum_{i=1}^{N_g} \mathrm{P}(\mathrm{i}, \mathrm{j}), \mid i+j=k\left\{k=2,3, \ldots, 2 N_g\right\}, \\ P_{x-y}(k)=\sum_{i=1}^{N_g} \sum_{j=1}^{N_g} \mathrm{P}(\mathrm{i}, \mathrm{j}),|| i-j \mid=k\left\{k=0,1, \ldots, N_g-1\right\}, \\ P_x(i)=\sum_{j=1}^{N_g} \mathrm{P}(\mathrm{i}, \mathrm{j}) \text { and } P_y(j)=\sum_{i=1}^{N_g} \mathrm{P}(\mathrm{i}, \mathrm{j}) .\end{gathered}$
$Angular\text{ }Second\text{ }Moment\text{ = }\sum\limits_{i=1}^{{{N}_{g}}}{{}}\sum\limits_{j=1}^{{{N}_{g}}}{{{\{P(i,\text{ }j)\}}^{2}}}$ (17)
$Entropy\text{ = -}\sum\limits_{i=1}^{{{N}_{g}}}{{}}\sum\limits_{j=1}^{{{N}_{g}}}{P(i,j)\text{ }(\log \text{ }(P(i,\text{ }j))}$ (18)
$Dissimilarity\text{ = }\sum\limits_{i}^{{{N}_{g}}}{ \sum\limits_{j}^{{{N}_{g}}}{\left| i-j \right|\cdot \text{ }P(i,j)}}$ (19)
$ID\text{ = }\sum\limits_{i}^{{{N}_{g}}}{ \sum\limits_{j}^{{{N}_{g}}}{\frac{1\text{ }}{\text{ }1+(i-j)\text{ }}\text{ }P(i,j)}}$ (20)
$ID\text{ }Moment\text{ = }\sum\limits_{i}^{{{N}_{g}}}{ \sum\limits_{j}^{{{N}_{g}}}{\frac{1\text{ }}{\text{ }1+{{(i-j)}^{2}}\text{ }}\text{ }P(i,j)}}$ (21)
$Correlation\text{ = }\frac{\sum\limits_{i=1}^{{{N}_{g}}}{{}}\sum\limits_{j=1}^{{{N}_{g}}}{\left. \left\{ (i-{{\mu }_{x}})(j-{{\mu }_{y}})P(i,j) \right. \right\}}}{\text{ }{{\sigma }_{\text{x}}}{{\sigma }_{\text{y}}}\text{ }}$ (22)
where, $\mu_x, \mu_y, \sigma_x$, and $\sigma_y$ are the means and SD of Px and Py.
$Autocorrelation\text{ = }\sum\limits_{i=1}^{{{N}_{g}}}{{}}\sum\limits_{j=1}^{{{N}_{g}}}{\left( i\text{ }j \right)P(i,j)}$ (23)
$Contrast\text{ = }\sum\limits_{n=0}^{{{N}_{g}}-1}{{{n}^{2}} \left\{ \sum\limits_{i=1}^{{{N}_{g}}}{{}}\sum\limits_{j=1}^{{{N}_{g}}}{P(i,j)} \right\}}\text{ }\left| i-j \right|=n$ (24)
$Cluster\text{ }Shade\text{ = }\sum\limits_{i=1}^{{{N}_{g}}}{{}}\sum\limits_{j=1}^{{{N}_{g}}}{\left. \left\{ {{(i+j-{{\mu }_{x}}-{{\mu }_{y}})}^{3}}P(i,j) \right. \right\}}$ (25)
$Cluster\text{ Prominence =}\sum\limits_{i=1}^{{{N}_{g}}}{{}}\sum\limits_{j=1}^{{{N}_{g}}}{\left. \left\{ {{(i+j-{{\mu }_{x}}-{{\mu }_{y}})}^{4}}P(i,j) \right. \right\}}$ (26)
$Maximum\text{ Probability = max }P(i,j)\text{ for all (i, j)}$ (27)
$Sum\text{ }Of\text{ }Squares\text{ = }\sum\limits_{i=1}^{{{N}_{g}}}{{}}\sum\limits_{j=1}^{{{N}_{g}}}{{{(i-{{\mu }_{{}}})}^{2}}P(i,j)}$ (28)
$Sum\text{ }Average\text{ = }\sum\limits_{i=2}^{2{{N}_{g}}}{i {{P}_{x+y}}(i)}$ (29)
$Sum\text{ }Entropy\text{ = -}\sum\limits_{i=2}^{2{{N}_{g}}}{{{P}_{x+y}}(i)\text{ }(\log \text{ }({{P}_{x+y}}(i))}$ (30)
$Sum\text{ }Variance\text{ = }\sum\limits_{i=2}^{2{{N}_{g}}}{{{(i-{{f}_{SE}})}^{2}}\text{ }{{P}_{x+y}}(i)}$ (31)
$Difference\text{ }Variance\text{ = Var of }{{P}_{x-y}}(i)$ (32)
$Difference\text{ }Entropy\text{ = -}\sum\limits_{i=0}^{{{N}_{g}}-1}{{{P}_{x-y}}(i)}\text{ }(\log \text{ }({{P}_{x-y}}(i))$ (33)
$IM{{C}_{1}}\text{ = }\frac{{{H}_{xy}}-{{H}_{xy1}}}{max \left\{ {{H}_{x}},{{H}_{y}} \right\}}$ (34)
where,
$\begin{align} & {{H}_{xy}}=\text{ -}\sum\limits_{i=1}^{{{N}_{g}}}{{}}\sum\limits_{j=1}^{{{N}_{g}}}{P(i,j)\text{ }(\log \text{ }(P(i,j))}, \\ & {{H}_{xy1}}=\text{ -}\sum\limits_{i=1}^{{{N}_{g}}}{{}}\sum\limits_{j=1}^{{{N}_{g}}}{P(i,j)\text{ }\log \text{ }\{{{P}_{x}}(i)\text{ }{{P}_{y}}(j)\}}, \\ & {{H}_{xy2}}=\text{ -}\sum\limits_{i=1}^{{{N}_{g}}}{{}}\sum\limits_{j=1}^{{{N}_{g}}}{{{P}_{x}}(i)\text{ }{{P}_{y}}(j)\text{ }\log \{{{P}_{x}}(i)\text{ }{{P}_{y}}(j)\}}, \\ & {{H}_{x}}\text{ }and\text{ }{{H}_{y}}\text{ are entropies of }{{P}_{x}}\text{ and }{{P}_{y}}. \\\end{align}$
$IM{{C}_{2}}\text{ = }\sqrt{\text{(1- exp }\!\![\!\!\text{ -2}\text{.0 (}{{H}_{xy2}}-{{H}_{xy}})])}$ (35)
$MMC\text{ = }\sqrt{({{\text{2}}^{\text{th}}}\text{ largest eigenvalue of Q)}}$ (36)
where,
$Q(i,j)=\sum\limits_{k}^{{}}{\frac{P(i,k)P(j,k)\text{ }}{{{P}_{x}}(i){{P}_{y}}(k)}}$
4.5.3 Segmentation-based fractal texture analysis method
To implement the SFTA algorithm, a gray level image and the number of threshold levels to be used are required. There are two main steps in the implementation of the SFTA algorithm. In the first step, the multi-threshold levels are determined by applying the OTSU multilevel thresholding algorithm to the gray level image with the total number of threshold levels. The found n thresholds are stored in the vector $T=t_1, t_2, t_3, \ldots, t_n$. These thresholds are added in pairs to the vector $T_A=\left(\right.$Min$\left._{\text{Grayvalue}} \quad, t_1\right),\left(t_1, t_2\right) \ldots\left(t_{n-1}, t_n\right)$. After TA is completed, in vector TB all the threshold levels are stored as $T_B=\left(t_1, Max_{GrayVal}\right)\,\,,\left(t_2, Max_{{GrayVal }} \,\, \right), \ldots,\left(t_n, Max_{ {Grayval }}\,\,\right)$. These threshold pairs are applied separately to the gray image using the Two Threshold Binary Decomposition method, and the gray level image is converted into binary images.
${{I}_{b}}(x,y)\text{ = }\left\{ \begin{align} & \text{1, if }{{\text{t}}_{lower}}<{{I}_{g}}(x,y)\le {{\text{t}}_{upper}} \\ & \text{0, Otherwise} \\\end{align} \right.\text{ }$ (37)
Thus, our input image is converted into many different sub-binary images. $I_b: binary \,\,image, I_g: gray \,\,image,\,\,t_{\text {lower }}$ and $t_{u p p e r}$ values represent threshold pairs. In the second step, the features are extracted by using these binary images.
$\Delta (x,y)\text{ = }\left\{ \begin{align} & \text{1, }if\text{ }\exists \text{ }(x',y')\in {{N}_{8}}\text{ }\!\![\!\!\text{ }(x,y)]: \\ & \text{ }{{I}_{b}}(x',y')=0\text{ }\wedge \text{ }{{I}_{b}}(x,y)=1, \\ & \text{0, Otherwise} \\\end{align} \right.\text{ }$ (38)
N8[(x,y)] represents the eight pixels connected to (x,y), and $\Delta(x, y)$ represents the binary image boundary. Edge pixels in each of the resulting images are obtained, and the number of pixels is counted. By using the edge pixel coordinates, the average gray level values in the gray level images are calculated. The Fractal dimension information is obtained by using the box-counting method for each binary sub-image, and the feature vector is created [63].
4.5.4 Horizontal and vertical total proportion features
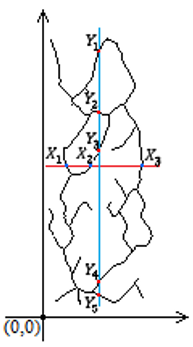
HTP and VTP are two methods that gather statistical information from FV images by using the intersection coordinates of the horizontal and vertical axes. The underlying principle of these methods is to calculate the proportion of distances between veins intersecting a horizontal or vertical plane in order to distinguish between different classes [45]. These features are extracted from the skeletonized FV images. Assuming (Ax, Ay) is the center of gravity of the FV image: The coordinates of the FV points, intersecting the horizontal and vertical lines, are determined as in Figure 7. In the horizontal plane, the intersection points are denoted as $X_1, X_2$, and $X_3$ with the maximum subscript number indicating the number of intersections (# of INTs) [45].
Figure 7. Definition of HTP and VTP features
HTP value is obtained by applying the formula in Eq. (39).
$HTP=(\frac{{{X}_{1}}}{{{X}_{2}}}+\frac{{{X}_{2}}}{{{X}_{3}}}+...)*(\#\text{ }of\text{ }INTs)$ (39)
The points where the veins intersect in the vertical plane are represented by $Y_1, Y_2, Y_3, Y_4$, and $Y_5$. The maximum subscript number indicates the total number of intersections in the vertical plane.
VTP value is obtained by applying the formula in Eq. (40).
$VTP=(\frac{{{Y}_{1}}}{{{Y}_{2}}}+\frac{{{Y}_{2}}}{{{Y}_{3}}}+...)*(\#\text{ }of\text{ }INTs)$ (40)
The features we obtained from the combination of the HTP and the VTP are called Horizontal and Vertical Total Proportion.
In this study, two finger vein databases were utilized. The first database, Database_1, consists of 15 index finger images from 64 individuals, yielding a total of 960 FV images that were obtained through the use of a NIR sensitive CCD camera and NIR light source [44]. The second database, Database_2, was constructed by creating six classes based on the utilization of six different fingers from each individual. Each class comprises 10 images, resulting in a total of 60 images captured from a single individual. With data from 100 individuals used, the database encompasses 600 classes and a cumulative total of 6000 FV images [48].
The classification was applied with Ensemble, KNN, SVM, Decision Trees, and Discriminant Analysis methods, and the results of Ensemble and KNN classifiers, which had the highest success rate, were given. The Ensemble classifier employed RUSBoost, AdaBoost, Bagged Tree (BT), and Subspace Discriminant (SD) methods, and SD achieved the highest success rate. The discriminant was determined as the learner type. The number of learners was set to 30. Subspace dimension changes according to the total number of features used. KNN classification was performed by selecting the values of 1, 2, 3, ..., and 10 individually for the number of neighbors (k), and the highest success rate was obtained in the case of k=1, which was called Fine KNN (f-KNN). Euclidean distance was used as the distance metric. In the SVM classifier, the classification process was performed by choosing Linear, Quadratic, Cubic, and Gaussian separately as Kernel functions. In the Decision Tree classification algorithm, the maximum number of the split was selected separately as 4, 20, and 100, but successful results could not be obtained. Linear and quadratic discriminant were used in the Discriminant Analysis method, and diagonal covariance was chosen for the regularization process. In addition, the reliability of the obtained success rates was increased by using the cross validation technique. The n-fold cross validation technique was used for n=3 and n=5.
5.1 Experimental results of feature extraction methods
GLRLM, GLCM, and SFTA features were extracted using the images, preprocessed by HF and PMAD methods, as shown in the flow diagram in Figure 1. In the GLRLM method, a total of 44 features were extracted using 11 features examined in four directions. 20 features extracted from the GLCM method were analyzed separately in two and four directions. As a result of examining in two directions, 40 features were extracted, and 80 features were obtained by examining in four directions. 39 features were obtained through the SFTA feature extraction method. The extracted features were sent to the classifier and classified using the n-fold cross validation technique, and success rates were obtained. According to Table 1, for Database_1, in the study using the GLRLM feature extraction algorithm, the highest success rate was achieved as 99.5% in both Ensemble and KNN classifiers with the 5-fold cross validation technique. The results achieved with Database_2 were also presented in Table 1. The study, which employed the GLRLM feature extraction algorithm, achieved the highest success rate through the use of the Ensemble classifier for Database_2. This was accomplished through the implementation of a 5-fold cross validation technique, yielding a success rate of 91.8%.
Table 1. GLRLM results for databases (%)
|
n-Fold |
|
Classifiers |
|
Database_1 |
|
Database_2 |
|
3 |
|
Ensemble (SD) |
|
99.2 |
|
91.3 |
|
|
KNN (f-KNN) |
|
99.4 |
|
82.9 |
|
|
5 |
|
Ensemble (SD) |
|
99.5 |
|
91.8 |
|
|
KNN (f-KNN) |
|
99.5 |
|
84.9 |
The results of the classification study conducted on Database 1 and Database 2 using the GLCM and cross-validation techniques with 3-fold and 5-fold are presented in Table 2. The feature vector was extracted by applying the GLCM feature extraction method in two and four directions. The study, utilizing the GLCM algorithm, achieved the highest accuracy with the Ensemble classifier on Database_1. This was accomplished through the implementation of a 5-fold cross validation technique in two directions, yielding a success rate of 99.3%. The highest success rate for Database_2 was attained through the use of the GLCM feature extraction algorithm in four directions and the Ensemble classifier. The application of a 5-fold cross validation technique on Database_2 resulted in a success rate of 91.1%.
Table 2. GLCM results for databases (%)
|
GLCM in two directions |
||||||
|
n-Fold |
|
Classifiers |
|
Database_1 |
|
Database_2 |
|
3 |
|
Ensemble (SD) |
|
99.2 |
|
83.2 |
|
|
KNN (f-KNN) |
|
97.8 |
|
58.1 |
|
|
5 |
|
Ensemble (SD) |
|
99.3 |
|
84.1 |
|
|
KNN (f-KNN) |
|
98.0 |
|
60.4 |
|
|
GLCM in four directions |
||||||
|
3 |
|
Ensemble (SD) |
|
99.1 |
|
91.0 |
|
|
KNN (f-KNN) |
|
97.5 |
|
63.9 |
|
|
5 |
|
Ensemble (SD) |
|
99.2 |
|
91.1 |
|
|
KNN (f-KNN) |
|
97.5 |
|
65.6 |
|
The results of the study on both databases using the SFTA with 3-fold and 5-fold cross validation techniques are presented in Table 3. The study on Database_1 using the SFTA feature extraction algorithm resulted in the highest success rate of 99.0% achieved by the Ensemble classifier through the use of the 5-fold cross validation technique. According to the results, for Database_2, the highest success rate was obtained for the 5-fold cross validation technique and achieved 84.8% in the Ensemble classifier.
Table 3. SFTA results for databases (%)
|
n-Fold |
|
Classifiers |
|
Database_1 |
|
Database_2 |
|
3 |
|
Ensemble (SD) |
|
98.9 |
|
83.7 |
|
|
KNN (f-KNN) |
|
98.4 |
|
77.0 |
|
|
5 |
|
Ensemble (SD) |
|
99.0 |
|
84.8 |
|
|
KNN (f-KNN) |
|
98.8 |
|
79.1 |
5.2 Experimental results of the fusion of HVTP with GLRLM, GLCM, and SFTA
To obtain the HVTP features, the Niblack segmentation algorithm was applied to the preprocessed images first, and then the image was enhanced using morphological operators. HTP and VTP features were calculated from the skeletonized image, and the HVTP features were obtained. The new feature set was obtained after the fusion of the HVTP with the GLRLM, GLCM, and SFTA features. The n-fold cross validation technique was applied, and success rates were obtained. The best scores are marked as bold in the tables.
Success rates were calculated by sending the feature set extracted from the GLRLM algorithm and the feature set obtained as a result of the fusion of the HVTP and GLRLM algorithms separately to different classifiers. The results of the classification study on Database_1 and Database_2 using 3-fold and 5-fold cross validation techniques are shown in Table 4. In the algorithm using the fusion of the HVTP and GLRLM feature extraction methods, the Ensemble classifier results improved to 99.7% for both 3-fold and 5-fold cross validation techniques in Database_1. The results indicate that the success rate of 99.2% obtained through the joint use of Fourier descriptors and the HVTP attribute in the study [45] has been increased to 99.7% for the same database. In the algorithm using the fusion of the HVTP and GLRLM feature extraction method, the Ensemble classifier results increased from 91.8% to 93.3% for the 5-fold cross validation techniques in Database_2, and the highest success rate was achieved. Table 4 shows that the HVTP feature extraction algorithm makes a positive contribution to the success rate of the Ensemble classifier. In both databases, the success rate in the Ensemble classifier was increased while using HVTP with the GLRLM feature extraction algorithm but did not show the same effect in the KNN classifier.
The results were computed by sending the feature set extracted from the GLCM algorithm and the feature set obtained as a result of the fusion of the HVTP and GLCM algorithms separately to different classifiers. The feature vector was extracted by examining the GLCM feature extraction algorithm in two and four directions for both databases. The results of the classification study on Database_1 and Database_2 by using 3-fold and 5-fold cross validation techniques are shown in Table 5. In the case of the fusion of the HVTP and two directional GLCM feature extraction algorithms, the highest success rate for Database_1 led to a rise from 99.2% to 99.5% in the Ensemble classifier with the 3-fold cross-validation. Additionally, with the fusion of the HVTP and four directional GLCM feature extraction algorithms, the success rate for Database_2 was increased from 91.1% to 91.8% in the Ensemble classifier by using the 5-fold cross-validation technique. The results in Table 5 demonstrate the positive effect of the HVTP feature extraction algorithm on the success rates across all attempts in both Ensemble and KNN classifiers for both databases.
The results of the study on Database_1 and Database_2 using HVTP and SFTA with 3-fold and 5-fold cross validation techniques are shown in Table 6. In the algorithm using the fusion of the HVTP and SFTA feature extraction methods, the Ensemble classifier results improved from 99.0% to 99.2% for the 5-fold cross validation technique in Database_1. According to the results for Database_2, the success rate was improved from 84.8% to 86.0% for the 5-fold cross validation techniques by using the Ensemble classifier. It is seen in Table 6 that the HVTP feature extraction algorithm makes positive contributions to the success rates for all tries in Ensemble and KNN classifiers.
Table 4. Fusion results of HVTP and GLRLM for databases
|
Database_1 |
||||||
|
n-Fold |
|
Classifiers |
|
Success (%) |
||
|
|
|
GLRLM |
|
HVTP + GLRLM |
||
|
3 |
|
Ensemble (SD) |
|
99.2 |
|
99.7 |
|
|
KNN (f-KNN) |
|
99.4 |
|
99.2 |
|
|
5 |
|
Ensemble (SD) |
|
99.5 |
|
99.7 |
|
|
KNN (f-KNN) |
|
99.5 |
|
99.3 |
|
|
Database_2 |
||||||
|
3 |
|
Ensemble (SD) |
|
91.3 |
|
92.9 |
|
|
KNN (f-KNN) |
|
82.9 |
|
81.6 |
|
|
5 |
|
Ensemble (SD) |
|
91.8 |
|
93.3 |
|
|
KNN (f-KNN) |
|
84.9 |
|
83.8 |
|
Table 5. Fusion results of HVTP and GLCM for databases (%)
|
GLCM in two directions |
||||||||||
|
n-Fold |
|
Classifiers |
|
Database_1 |
|
Database_2 |
||||
|
|
|
GLCM |
|
HVTP + GLCM |
|
GLCM |
|
HVTP + GLCM |
||
|
3 |
|
Ensemble (SD) |
|
99.2 |
|
99.5 |
|
83.2 |
|
84.7 |
|
|
KNN (f-KNN) |
|
97.8 |
|
98.0 |
|
58.1 |
|
64.8 |
|
|
5 |
|
Ensemble (SD) |
|
99.3 |
|
99.4 |
|
84.1 |
|
84.7 |
|
|
KNN (f-KNN) |
|
98.0 |
|
97.9 |
|
60.4 |
|
66.7 |
|
|
GLCM in four directions |
||||||||||
|
3 |
|
Ensemble (SD) |
|
99.1 |
|
99.3 |
|
91.0 |
|
91.1 |
|
|
KNN (f-KNN) |
|
97.5 |
|
97.8 |
|
63.9 |
|
67.0 |
|
|
5 |
|
Ensemble (SD) |
|
99.2 |
|
99.4 |
|
91.1 |
|
91.8 |
|
|
KNN (f-KNN) |
|
97.5 |
|
97.7 |
|
65.6 |
|
68.9 |
|
Table 6. Fusion results of HVTP and SFTA for databases
|
Database_1 |
||||||
|
n-Fold |
|
Classifiers |
|
Success (%) |
||
|
|
|
SFTA |
|
HVTP + SFTA |
||
|
3 |
|
Ensemble (SD) |
|
98.9 |
|
99.1 |
|
|
KNN (f-KNN) |
|
98.4 |
|
98.4 |
|
|
5 |
|
Ensemble (SD) |
|
99.0 |
|
99.2 |
|
|
KNN (f-KNN) |
|
98.8 |
|
98.4 |
|
|
Database_2 |
||||||
|
3 |
|
Ensemble (SD) |
|
83.7 |
|
84.9 |
|
|
KNN (f-KNN) |
|
77.0 |
|
80.0 |
|
|
5 |
|
Ensemble (SD) |
|
84.8 |
|
86.0 |
|
|
KNN (f-KNN) |
|
79.1 |
|
81.6 |
|
Table 7. Fusion results of HVTP and others for databases (%)
|
Methods |
|
Classifiers for Database_1 |
|
Classifiers for Database_2 |
||||
|
|
Ensemble (SD) |
|
KNN (f-KNN) |
|
Ensemble (SD) |
|
KNN (f-KNN) |
|
|
GLCM + GLRLM |
|
99.4 |
|
98.9 |
|
96.0 |
|
83.2 |
|
GLCM + GLRLM + HVTP |
|
99.6 |
|
99.0 |
|
96.1 |
|
84.0 |
|
GLCM + SFTA |
|
99.3 |
|
98.8 |
|
95.3 |
|
89.1 |
|
GLCM + SFTA + HVTP |
|
99.4 |
|
98.8 |
|
95.4 |
|
89.4 |
|
GLRLM + SFTA |
|
99.5 |
|
99.0 |
|
97.1 |
|
93.0 |
|
GLRLM + SFTA + HVTP |
|
99.6 |
|
99.2 |
|
97.2 |
|
93.1 |
|
GLCM + GLRLM + SFTA |
|
99.4 |
|
99.1 |
|
97.5 |
|
91.8 |
|
GLCM + GLRLM + SFTA + HVTP |
|
99.5 |
|
99.0 |
|
97.6 |
|
92.2 |
As a result of the fusion of the feature extraction algorithms in pairs, triplets, and quarts in Table 7, the effect of the HVTP feature extraction algorithm continued to be examined. When the HVTP was used as the fusion with the GLRLM, GLCM in four directions, and SFTA feature extraction algorithms, the success rates for both databases were increased in the Ensemble and KNN classifiers. As illustrated in Table 7 about Database_1, the feature vector obtained by the fusion of GLCM, GLRLM, and HVTP was classified using the Ensemble classifier and 5-fold cross-validation technique, and a success of 99.6% was obtained. Similarly, the same success rate was obtained for the same database by the fusion of GLRLM, SFTA, and HVTP under equivalent conditions. The highest success rate for Database_2 was obtained from the Ensemble classifier with 97.6%, when the 5-fold cross validation technique was used as a result of the fusion of GLCM, GLRLM, SFTA, and HVTP feature extraction algorithms. This is the best result obtained for Database_2 in this study. According to the results in Table 7, The HVTP feature extraction algorithm increased the success rate when the Ensemble classifier was used for both databases, while it increased the success rates for some feature extraction methods in the KNN classifier.
5.3 Experimental results of the feature selection method
Selection of the most distinctive and relevant features from a feature vector is important to learn the effect of features on the classification step and to achieve high performance and efficient computation. The process of reducing the number of features to retain the most informative ones is known as feature reduction. One of the well-known algorithms for feature reduction is the Relief Algorithm. This algorithm aims to select features that have a significant impact on class prediction. Using the Relief algorithm, it has been observed that the HTP or VTP features have a high distinctiveness among other features. And the success rates were examined by reducing the feature. The top 10 most distinctive features were extracted for each of the GLRLM+HVTP, GLCM+HVTP, and SFTA+HVTP feature groups using the Relieff algorithm, and classification was performed using the 5-fold cross validation technique. 10 attributes extracted from each feature group, using the Relieff algorithm, were combined with the fusion technique, and a feature set with 30 elements was obtained. The best success rates obtained as a result of the Ensemble classifier for the 5-fold cross validation technique are shown in Table 8. When the first 10 distinguishing features were used, the success rates for Database_1 ranged from 95.7% to 98.9%, while these features did not have sufficient distinctiveness for Database_2. The best success rate in the classification process using the top 30 most distinctive features was 99.3% for Database_1 and 91.0% for Database_2 with the Ensemble classifier. Other results are detailed in Table 8.
Table 8. Classification results by using top 10 / 30 most distinctive features for databases (%)
|
Methods with the first 10 features selected |
|
Classifiers |
|
Database_1 |
|
Database_2 |
|
HVTP + GLRLM |
|
Ensemble (BT) |
|
98.9 |
|
69.3 |
|
HVTP + GLCM |
|
Ensemble (BT) |
|
95.7 |
|
58.4 |
|
HVTP + SFTA |
|
Ensemble (BT) |
|
97.1 |
|
66.1 |
|
Methods with the first 30 features selected |
|
|
|
|
||
|
HVTP + GLRLM + GLCM + SFTA |
|
Ensemble (SD) |
|
99.3 |
|
91.0 |
5.4 Comparison with other studies
The results obtained from the use of Database_1, as displayed in Table 4, indicate that the highest success rate of 99.7% was achieved by the Ensemble classifier for the 3-fold and 5-fold cross validation technique using the fusion of the HVTP and GLRLM feature extraction algorithms. This result surpasses the success rate of 99.2% obtained through the classification of the General Fourier Descriptor and HVTP features, as described in study [45] using the KNN classifier.
The results of the conventional studies in the literature related to Database_2 are shown in Table 9. The success rate achieved in the present study surpasses those from other relevant studies in the literature for Database_2.
Table 9. Conventional model results for Database_2 (%)
|
Model |
|
Success (%) |
|
CNN-ROI [30] |
|
91.51 |
|
CNN-RAW [30] |
|
91.72 |
|
AGCNN-ROI [30] |
|
91.06 |
|
AGCNN-RAW [30] |
|
86.38 |
|
Maximum Curvature [31] |
|
EER: 5.49 |
|
Repeated Line Tracking [31] |
|
EER: 3.33 |
|
Reduced Field of View [64] |
|
97.10 |
|
Our study (HVTP, GLRLM, GLCM, SFTA) |
|
97.60 |
The research conducted in this study on finger vein recognition processes can be divided into two categories. The first category focuses on enhancing the quality of finger vein images to be used, while the second category focuses on improving the success rate through the creation of novel feature vectors or the implementation of fusion techniques. In this study, the first category involved the use of a HF and PMAD to enhance the finger vein images in the databases. The main focus of this study was on the second category, which aimed to evaluate the impact of the HVTP feature extraction method on the success rate when used in fusion with GLRLM, GLCM, and SFTA features. The resulting feature vectors were classified in Ensemble and KNN classifiers, where the best success was obtained. Results from the study on Database_1 showed that the highest success rate of 99.7% was achieved through the fusion of HVTP with GLRLM features. On the other hand, the highest success rate of 97.6% was recorded in the study on Database_2, which was obtained through the fusion of HVTP with GLCM, GLRLM, and SFTA features. Experimental results demonstrated that HVTP features significantly improve the classification success in the case of using the fusion technique with GLRLM, GLCM, and SFTA.
[1] Almajmaie, L., Ucan, O.N., Bayat, O. (2019). Fingerprint recognition system based on modified multi-connect architecture (MMCA). Cognitive Systems Research, 58: 107-113. https://doi.org/10.1016/j.cogsys.2019.05.004
[2] Yadav, J.K.P.S., Singh, L., Jaffrey, Z.A. (2022). A robust automatic fingerprint recognition system using multi-connection Hopfield neural network. Traitement Du Signal, 39(2): 683-694. https://doi.org/10.18280/ts.390232
[3] Seng, D.W., Zhang, H.Q., Fang, X.J., Zhang, X.F., Chen, J. (2018). An improved fingerprint image matching and multi-view fingerprint recognition algorithm. Traitement Du Signal, 35(3-4): 341-353. https://doi.org/10.3166/Ts.35.341-354
[4] Zhong, D.X., Du, X.F., Zhong, K.C. (2019). Decade progress of palmprint recognition: A brief survey. Neurocomputing, 328: 16-28. https://doi.org/10.1016/j.neucom.2018.03.081
[5] Aydogdu, O., Sadreddini, Z., Ekinci, M. (2018). A study on liveness analysis for palmprint recognition system. In 2018 41st International Conference on Telecommunications and Signal Processing (Tsp), pp. 303-306. http://dx.doi.org/10.1109/TSP.2018.8441311
[6] Sultan, S.A., Ghanim, M.F. (2020). Human retina based identification system using Gabor filters and GDA technique. Journal of Communications Software and Systems, 16(3): 243-253. https://doi.org/10.24138/jcomss.v16i3.1031
[7] Kose, C., Ikibas, C. (2011). A personal identification system using retinal vasculature in retinal fundus images. Expert Systems with Applications, 38(11): 13670-13681. https://doi.org/10.1016/j.eswa.2011.04.141
[8] Conti, V., Rundo, L., Militello, C., Salerno, V.M., Vitabile, S., Siniscalchi, S.M. (2021). A multimodal retina-iris biometric system using the Levenshtein distance for spatial feature comparison. Iet Biometrics, 10(1): 44-64. https://doi.org/10.1049/bme2.12001
[9] Bulut, F., Shehu, H.A., Ince, I.F. (2022). Performance boosting of image matching-based iris recognition systems using deformable circular hollow kernels and uniform histogram fusion images. Journal of Electronic Imaging, 31(5). https://doi.org/10.1117/1.Jei.31.5.053036
[10] Baykara, M., Das, R. (2013). Real time face recognition and tracking system. In 2013 International Conference on Electronics, Computer and Computation (Icecco), pp. 159-163. https://doi.org/10.1109/ICECCO.2013.6718253
[11] Shahid, A.M., Fraz, M.M., Shahzad, M. (2021). Large scale face recognition in the wild: technical challenges and research directions. In 2021 International Conference on Digital Futures and Transformative Technologies (Icodt2). https://doi.org/10.1109/ICoDT252288.2021.9441525
[12] Jain, A.K., Nandakumar, K., Ross, A. (2016). 50 years of biometric research: Accomplishments, challenges, and opportunities. Pattern Recognition Letters, 79: 80-105. https://dx.doi.org/10.1016/j.patrec.2015.12.013
[13] Palma, D., Montessoro, P.L. (2022). Biometric-based human recognition systems: An overview. Recent Advances in Biometrics, 1-21. http://dx.doi.org/10.5772/intechopen.101686
[14] Shaheed, K., Mao, A.H., Qureshi, I., Kumar, M., Abbas, Q., Ullah, I., Zhang, X.M. (2021). A systematic review on physiological-based biometric recognition systems: current and future trends. Archives of Computational Methods in Engineering, 28(7): 4917-4960. https://doi.org/10.1007/s11831-021-09560-3
[15] Fang, Y.X., Wu, Q.X., Kang, W.X. (2018). A novel finger vein verification system based on two-stream convolutional network learning. Neurocomputing, 290: 100-107. https://dx.doi.org/10.1016/j.neucom.2018.02.042
[16] Chaa, M., Akhtar, Z., Attia, A. (2019). 3D palmprint recognition using unsupervised convolutional deep learning network and SVM classifier. Iet Image Processing, 13(5): 736-745. https://doi.org/10.1049/iet-ipr.2018.5642
[17] Yang, J.F., Wei, J.Z., Shi, Y.H. (2019). Accurate ROI localization and hierarchical hyper-sphere model for finger-vein recognition. Neurocomputing, 328: 171-181. https://dx.doi.org/10.1016/j.neucom.2018.02.098
[18] von Graevenitz, G.A. (2007). Biometric authentication in relation to payment systems and ATMs. Datenschutz und Datensicherheit - DuD, 31(9): 681-683. https://dx.doi.org/10.1007/s11623-007-0223-9
[19] Watanabe, M. (2008). Palm vein authentication. Advances in Biometrics, 75-88. https://dx.doi.org/10.1007/978-1-84628-921-7_5
[20] Kumar, A., Zhou, Y. (2012). Human identification using finger images. IEEE Trans Image Process, 21(4): 2228-2244. https://dx.doi.org/10.1109/TIP.2011.2171697
[21] Luo, H., Yu, F.X., Pan, J.S., Chu, S.C., Tsai, P.W. (2010). A survey of vein recognition techniques. Information Technology Journal, 9(6): 1142-1149. https://dx.doi.org/10.3923/itj.2010.1142.1149
[22] You, W.H., Zhou, W.K., Huang, J., Yang, F., Liu, Y.Q., Chen, Z.Y. (2019). A bilayer image restoration for finger vein recognition. Neurocomputing, 348: 54-65. https://dx.doi.org/10.1016/j.neucom.2018.06.085
[23] Fu, B., Cui, J., Xiong, X. (2010). A novel adaptive vein image contrast enhancement method based on fuzzy and retinex theory. In The 2010 IEEE International Conference on Information and Automation, pp. 2447-2450. https://dx.doi.org/10.1109/ICINFA.2010.5512278
[24] Gao, X., Ma, J., Wu, J. (2010). The research of finger-vein image enhancement algorithm. Optical Instruments, 32: 29-32. https://dx.doi.org/10.3969/j.issn.1005-5630.2010.04.007
[25] Oh, J., Hwang, H. (2010). Feature enhancement of medical images using morphology-based homomorphic filter and differential evolution algorithm. International Journal of Control, Automation and Systems, 8(4): 857-861. https://dx.doi.org/10.1007/s12555-010-0418-y
[26] Yang, J., Zhang, B., Shi, Y. (2012). Scattering removal for finger-vein image restoration. Sensors (Basel), 12(3): 3627-3640. https://dx.doi.org/10.3390/s120303627
[27] Yang, J., Shi, Y. (2013). Finger-vein network enhancement and segmentation. Pattern Analysis and Applications, 17(4): 783-797. https://dx.doi.org/10.1007/s10044-013-0325-y
[28] Shin, K., Park, Y., Nguyen, D., Park, K. (2014). Finger-vein image enhancement using a fuzzy-based fusion method with Gabor and retinex filtering. Sensors, 14(2): 3095. https://dx.doi.org/10.3390/s140203095
[29] Feng, D.Z., He, S.Y., Zhou, Z.H., Zhang, Y. (2022). A finger vein feature extraction method incorporating principal component analysis and locality preserving projections. Sensors, 22(10). https://doi.org/10.3390/s22103691
[30] Zhang, Y., Li, W., Zhang, L., Ning, X., Sun, L., Lu, Y. (2022). AGCNN: Adaptive Gabor convolutional neural networks with receptive fields for vein biometric recognition. Concurrency and Computation: Practice and Experience, 34(12): e5697. https://doi.org/10.1002/cpe.5697
[31] Lu, H.M., Wang, Y.F., Gao, R.R., Zhao, C.C., Li, Y. (2021). A novel ROI extraction method based on the characteristics of the original finger vein image. Sensors, 21(13). https://doi.org/10.3390/s21134402
[32] Yong, Y. (2020). Research on technology of finger vein pattern recognition based on FPGA. Journal of Physics: Conference Series, 1453: 012037. https://doi.org/10.1088/1742-6596/1453/1/012037
[33] Yang, W.M., Ji, W.Y., Xue, J.H., Ren, Y., Liao, Q.M. (2019). A hybrid finger identification pattern using Polarized depth-Weighted Binary Direction Coding. Neurocomputing, 325: 260-268. https://dx.doi.org/10.1016/j.neucom.2018.10.042
[34] Ma, H., Zhang, S.Y. (2019). Contactless finger-vein verification based on oriented elements feature. Infrared Physics & Technology, 97: 149-155. https://doi.org/10.1016/j.infrared.2018.12.021
[35] JosephP, R.B., Ezhilmaran, D. (2018). A smart computing algorithm for finger vein matching with affine invariant features using fuzzy image retrieval. Procedia Computer Science, 125: 172-178. https://doi.org/10.1016/j.procs.2017.12.024
[36] Babu, G.S., Bobby, N.D., Bennet, M.A., Shalini, B., Srilakshmi, K. (2017). Multistage feature extraction of finger vein patterns using gabor filters. Iioab Journal, 8(2): 84-91.
[37] Sikarwar, P., Manmohan. (2016). Finger vein recognition using local directional pattern. In 2016 International Conference on Inventive Computation Technologies (Icict), 1: 21-25. https://doi.org/10.1109/INVENTIVE.2016.7823248
[38] Matsuda, Y., Miura, N., Nagasaka, A., Kiyomizu, H., Miyatake, T. (2016). Finger-vein authentication based on deformation-tolerant feature-point matching. Machine Vision and Applications, 27(2): 237-250. https://dx.doi.org/10.1007/s00138-015-0745-3
[39] Khellat-Kihel, S., Abrishambaf, R., Monteiro, J.L., Benyettou, M. (2016). Multimodal fusion of the finger vein, fingerprint and the finger-knuckle-print using Kernel Fisher analysis. Applied Soft Computing, 42: 439-447. https://doi.org/10.1016/j.asoc.2016.02.008
[40] Ma, H., Popoola, O.P., Sun, S.L. (2015). Research of dual-modal decision level fusion for fingerprint and finger vein image. International Journal of Biometrics, 7(3): 271-285. https://dx.doi.org/10.1504/IJBM.2015.071949
[41] Kaur, A., Mishra, A. (2015). Finger Vein Image Enhancement Using RPL, Segmentation with Neural Networks.
[42] Rosdi, B.A., Shing, C.W., Suandi, S.A. (2011). Finger vein recognition using local line binary pattern. Sensors, 11(12): 11357. https://dx.doi.org/10.3390/s111211357
[43] Yang, J., Yang, J., Shi, Y. (2009). Combination of gabor wavelets and circular gabor filter for finger-vein extraction. Emerging Intelligent Computing Technology and Applications, 346-354. https://dx.doi.org/10.1007/978-3-642-04070-2_39
[44] Yang, J., Li, X. (2010). Efficient finger vein localization and recognition. In 2010 20th International Conference on Pattern Recognition, pp. 1148-1151. https://dx.doi.org/10.1109/ICPR.2010.287
[45] Titrek, F., Baykan, O.K. (2020). Finger vein recognition by combining anisotropic diffusion and a new feature extraction method. Traitement Du Signal, 37(3): 433-441. https://doi.org/10.18280/ts.370310
[46] Robnik-Sikonja, M., Kononenko, I. (2000). An adaptation of relief for attribute estimation in regression. In ICML '97: Proceedings of the Fourteenth International Conference on Machine Learning.
[47] Yang, J.F., Zhang, X. (2012). Feature-level fusion of fingerprint and finger-vein for personal identification. Pattern Recognition Letters, 33(5): 623-628. https://dx.doi.org/10.1016/j.patrec.2011.11.002
[48] Lu, Y., Xie, S.J., Yoon, S., Yang, J.C., Park, D.S. (2013). Robust Finger Vein ROI Localization Based on Flexible Segmentation. Sensors, 13(11): 14339-14366. https://doi.org/10.3390/s131114339
[49] Al-amri, S.S., Kalyankar, N., Khamitkar, S. (2010). Linear and non-linear contrast enhancement image. International Journal of Computer Science and Network Security, 10(2): 139-143.
[50] Flynn, G.L., Yalkowsky, S.H., Roseman, T.J. (1974). Mass transport phenomena and models: Theoretical concepts. Journal of Pharmaceutical Sciences, 63(4): 479-510. https://dx.doi.org/10.1002/jps.2600630403
[51] Perona, P., Malik, J. (1990). Scale-space and edge detection using anisotropic diffusion. IEEE Transactions on Pattern Analysis and Machine Intelligence, 12(7): 629-639. https://dx.doi.org/10.1109/34.56205
[52] You, Y.L., Xu, W., Tannenbaum, A., Kaveh, M. (1996). Behavioral analysis of anisotropic diffusion in image processing. IEEE Trans Image Process, 5(11): 1539-1553. https://dx.doi.org/10.1109/83.541424
[53] Niblack, W. (1986). An Introduction to Digital Image Processing. Prentice Hall.
[54] Zhang, H.Y., Hung, C.L., Min, G.Y., Guo, J.P., Liu, M.Y., Hu, X.Y. (2020). GPU-Accelerated GLRLM algorithm for feature extraction of MRI. Scientific Reports, 10(1). https://doi.org/10.1038/s41598-019-46622-w
[55] Tang, X.O. (1998). Texture information in run-length matrices. IEEE Transactions on Image Processing, 7(11): 1602-1609. https://doi.org/10.1109/83.725367
[56] Belur, V.D., Edwin, B.H. (1991). Image characterizations based on joint gray level—run length distributions. Pattern Recognition Letters, 12(8): 497-502. https://doi.org/10.1016/0167-8655(91)80014-2
[57] Chu, A., Sehgal, C.M., Greenleaf, J.F. (1990). Use of gray value distribution of run lengths for texture analysis. Pattern Recognition Letters, 11(6): 415-419. https://doi.org/10.1016/0167-8655(90)90112-F
[58] Mary, M.G. (1975). Texture analysis using gray level run lengths. Computer Graphics and Image Processing, 4(2): 172-179. https://doi.org/10.1016/S0146-664X(75)80008-6
[59] Haralick, R.M., Shanmugam, K., Dinstein, I. (1973). Textural features for image classification. IEEE Trans Syst Man Cybern, SMC-3, 610-621. https://doi.org/10.1109/TSMC.1973.4309314
[60] Aziz, A.A., Izhar, L.I., Asirvadam, V.S., Tang, T.B., Ajam, A., Omar, Z., Muda, A.S. (2021). Detection of Collaterals from Cone-Beam CT Images in Stroke. Sensors (Basel, Switzerland), 21. https://doi.org/10.3390/s21238099
[61] Clausi, D.A. (2002). An analysis of co-occurrence texture statistics as a function of grey level quantization. Canadian Journal of Remote Sensing, 28(1): 45-62. https://doi.org/10.5589/m02-004
[62] Soh, L.K., Tsatsoulis, C. (1999). Texture analysis of SAR sea ice imagery using gray level co-occurrence matrices. IEEE Transactions on Geoscience and Remote Sensing, 37(2): 780-795. https://doi.org/10.1109/36.752194
[63] Costa, A.F., Humpire-Mamani, G., Traina, A.J.M. (2012). An Efficient Algorithm for Fractal Analysis of Textures. In The 2012 25th SIBGRAPI Conference on Graphics, Patterns and Images, pp. 39-46. https://dx.doi.org/10.1109/SIBGRAPI.2012.15
[64] Jin, J., Di, S., Li, W., Sun, X., Wang, X. (2021). Finger vein recognition algorithm under reduced field of view. Iet Image Processing, 15(4): 947-955. https://doi.org/10.1049/ipr2.12075