Rakhi Y. Jadhav | Anurag Mahajan*
© 2022 IIETA. This article is published by IIETA and is licensed under the CC BY 4.0 license (http://creativecommons.org/licenses/by/4.0/).
OPEN ACCESS
This paper proposed wavelet-based design using Discrete Wavelet Transform to compress smart grid electrical signals and to reduce noise. For the Smart Grid’s smooth functioning, the power signal must be monitored, and proper actions must be taken quickly for any abnormality. The compressed data takes less time to communicate the disturbances. The proposed design is tested for the phasor measurement unit, which monitors and records the status of the smart grid hence circulating extensive data to utilities, control centers, etc. It is also tested for load voltage data. Effective data compression can reduce the cost of data storage and transmission. Noise dramatically affects the effectiveness of the techniques detecting the disturbances. Hence data compression and denoising the data with minimum distortion is essential. The proposed design is simpler as it uses fewer filters and less number of decomposition level as compared to the existing design. Simulation results show that compression ratio and signal-to-noise ratios are increased as compared to existing design.
Daubechies, discrete wavelet transform, embedded zero-tree wavelet transform, singular value decomposition, smart grid, wavelet packet decomposition
Electrical supply is provided by conventional sources like thermal, hydroelectric, and nuclear power plants and recently using renewable energy sources like solar, wind, biomass, etc. More intelligent technology is needed to accommodate those renewable sources for the smooth functioning of the present grid. A smart grid is an electrical system that can intelligently combine the working of all users connecting generators to consumers for continuous, economical, and reliable electricity. It transmits energy effectively and restores quickly. It has extensive integration of renewable energy and informs operators to use it. It is digital, self-monitoring, and has sensors. It avoids blackouts. It has bilateral communication between smart meters, electrical utilities, and an intelligent protection system [1]. Power line Communications can provide bidirectional electrical energy and communication [2]. The Smart Grid data is vast as it is monitored and measured by smart meters and phasor measurement units [3]. There is a burden on the system due to data storage and needs large bandwidth for data exchange; hence data compression is essential [4]. It can restore effective reduction with low computational complexity after disturbance [5]. Data compression and encryption can improve the quality of service in smart grid [6].
There are two data-compression methods viz lossy and lossless. The lossy method can obtain a high compression ratio. The lossy compression methods are (i) Parametric, (ii)Mixed Parametric, and Transform (iii)Transform based. The transform-based techniques compress the signal better and reduce the noise. The Discrete Fourier Transform and Discrete Cosine Transform analyze sinusoidal, stationary, and periodic signals due to sound localization in the frequency domain. Discrete Fourier Transform cannot represent non-periodic transients and variable frequency signals. Hence Wavelet transforms, and Wavelet Packet Transforms are widely used for compression as they have sound localization in the time and frequency domain. It can concentrate significant signals in a few coefficients in the transient and non-periodic pattern. It represents the signal better and preserves the features [7]. The lossy Singular value decomposition has complexity in computations [8-10]. The signal-processing methods have various applications in smart grids [11].
It uses Wavelet transform at level 3 with Daubechies wavelet having four coefficient filters [12]. The Slantlet Transform, an orthogonal discrete wavelet transform, is used by Panda et al. [13]. Power quality transient data are compressed using B-splines up to scale three, and then S-transform analyses reconstructed data [14]. The discrete Wavelet transform with multi-resolution analysis with threshold and vector Quantization coding is used with Daubechies 4 at level 3 [15]. It has introduced a wavelet transform-based enhanced data compression method with Daubechies 4 at level 6 [16]. Discrete Wavelet Transform based multi-resolution analysis is used with Db5 and scale 2 [17]. The Embedded Zero-tree Wavelet Transform is used with biorthogonal wavelet(bior4.4) at level 3 [18]. Minimum Description Length with Discrete wavelet transform and Wavelet Packet Transform are used at the 4th level with symlet 7 wavelet [19]. Wavelet decomposition with spline interpolation is used by Gäşpäresc [20]. Wavelet packet transform with Minimum Description Length is applied with a modified form of Shannon Entropy [21]. A wavelet packet enhanced with arithmetic coding is used by Huang and Jou [22].
From the studies [12-22], only Santoso et al. [12] and Karthika and Rathika [17] have used Discrete wavelet transform, and Santoso et al. [12] could achieve the compression ratio of 16.67%, normalized mean square error 10-5 to 10-6, and Signal to noise ratio 30dB with actual power disturbance data. It has achieved a 35% compression ratio, mean square error of 14.05, and signal-to-noise ratio of 28.88dB for smart grid signal [17]. There is computational complexity as wavelet transform is used with some other technique or combined with coding to improve the results [13-16, 18-22].
Three mother wavelet functions, db2 to db14, coif1 to coif5, and sym2 to sym13, i.e., 30 candidate wavelets, are tested [23]. Twenty random signals of the phasor measurement unit are generated with disturbances related to frequency, voltage, and current and decomposed by Wavelet packet decomposition for 2 to 11 levels. The best wavelet retains the highest total energy for most ten levels. The best level of decomposition has the highest energy for most of the 30 wavelets. Daubechies order two wavelets at level 6 are used for compression and denoising. The set of bases is found using the algorithm by Coifman and Wickerhauser for representing the best sub-tree of a particular cost function based on a normalized Shannon entropy. The suitable threshold is decided by calculating level wise noise of the signal. Wavelet packet decomposition can give a compression ratio of up to 2%, signal to noise ratio of up to 30dB, and NRMSE in the range of 10-5. This method has computational complexity, as in wavelet packet decomposition, the signal is passed through more filters than in wavelet decomposition.
Wavelet packet transform is used for compression and denoising the smart grid signal. The best basis is obtained from weighted entropy [24]. 15 candidate wavelet functions sym2 to sym10, coif1 to coif5, and db2 to db10 are used for decomposing disturbance data at 2 to 8 levels for 19 test signals. Here sym8 and level 4 of decomposition are selected. Several bases are obtained from the best basis algorithm with a cost function. The entropy function is proposed to calculate the cost of representing the data. The best basis depends on the minimum cost function. The thresholding is done for denoising based on the proposed modified minimum description length; hence not required to calculate noise. For the desired compression ratio, the detail coefficients are arranged in descending order of their absolute values, and the suitable percentages of the lower coefficients are thresholded to zero. For the practical phasor measurement unit data, the compression ratio is 20%, and NRMSE is 15.2x10⁻⁹. The method has computational complexity as more filters are used.
Data is compressed at the 6th level using wavelet packet decomposition [23], and the 4th level using wavelet packet transform [24]. These methods have computational complexity, and still, there is a scope to improve compression ratio, signal-to-noise ratio, and reconstruction error.
Hence the new design is proposed using Discrete Wavelet Transform with different wavelet filters at each level with appropriate thresholds. The presented algorithm will reduce the computational complexity by achieving a better compression ratio at the 4th level of decomposition with minimum degradation and better quality of the signal.
This section presents a proposed design for the compression of smart grid signal using Discrete wavelet transform. Wavelet transform of discrete data a0=f of N numbers of samples of the time domain signal x(t) is represented as:
$\alpha=W f$ (1)
where, α holds N number of coefficients and W indicates NxN orthogonal matrix. The low-pass filter (LPF) is called the scaling filter, and the high-pass filter (HPF) is called the wavelet filter, where g and h are their respective filter matrices, and G and H are their conjugates. The one-dimensional discrete Wavelet transform (DWT) can be given by the following recursive formula (Pyramid Algorithm) as:
$a^m=g a^{m-1}$ and $d^m=h a^{m-1}$ (2)
where, m indicates the resolution level and m=1, 2, ….., log2N.
Figure 1. Signal decomposition using Level 1 DWT [12]
The compressed signal has wavelet transform coefficients with disturbance and discards coefficients free from disturbance. Some of the information is lost. The noise is suppressed before the signal is regenerated. Hence the detail coefficients dm below a predefined threshold $\eta^m$ are set to zero, where dmm is the detail coefficients after thresholding at the associated level $\mathrm{m}$. The threshold is based on the absolute maximum value of the detail coefficients at the related level $\mathrm{m}$.
$\eta^m=(1-u) x \max \left|d^m\right|$ (3)
where, 0≤u≤1 [12]. If u=0.01, the threshold is 99% of the maximum value of the detail coefficients. Compression ratio and signal to noise ratio improve as many high-frequency detail coefficients are thresholder:
$d^{m m}= \begin{cases}d^m & \left|d^m\right| \geq \eta^m \\ 0 & \left|d^m\right|<\eta^m\end{cases}$ (4)
The signal is reconstructed using the recursion algorithm in reverse, i.e., inverse discrete wavelet transform (IDWT), as below [19].
$a^{(m-1)(m-1)}=G a^m+H d^{m m}$ (5)
Figure 2. Signal reconstruction using Level 1 IDWT [12]
It aims to reduce the complexity; hence Daubechies filters Db1, Db2, and Db3, and decomposition level 4 are selected. In the proposed method, Daubechies filters Db1, Db2, and Db3 will be chosen as Db3, Db2, Db2, and Db1 at levels 1, 2, 3, and 4, respectively, for decomposition and Db1, Db2, Db2, Db3 in reverse for reconstruction as shown in Figure 3. The original signal a0 is decomposed to level 4 using a discrete wavelet transform. The signal a44 is reconstructed using inverse discrete wavelet transform (IDWT) with inputs as approximation coefficients a4 and detail coefficients d44 after thresholding at the fourth level. The reconstruction process is continued till the original signal a0 is regenerated.
Figure 3. Proposed design for data compression and noise reduction using DWT and IDWT
The DWT and IDWT functions indicated in Figure 3 are explained in Figures 1 and 2, respectively. The thresh
CR$=\frac{\text { No of non zero coefficients by threshold }}{\text { No. of samples in the original signal }} \times 100 \%$ (6)
The number of non-zero coefficients in the noisy signal after decomposition and thresholding at level 4 is the addition of approximation coefficients $\mathrm{a}^4$ at level 4 , detail coefficients $\mathrm{d}^{44}$ at level 4 after thresholding, detail coefficients $\mathrm{d}^{33}$ at the level 3 after thresholding, detail coefficients $\mathrm{d}^{22}$ at the level 2 after thresholding and detail coefficients $\mathrm{d}^{11}$ at level 1 after thresholding.
$N R M S E=\frac{\sqrt{\frac{\sum_{i=0}^{N-1} \quad \left[x(i)-x^{\prime}(i)\right] \quad ^2}{N}}}{\bar{x}}$ (7)
$\bar{x}=\max (x(i))-\min (x(i))$ (8)
$\operatorname{SNR} 1=\left(\frac{\sum_{i=0}^{N-1} x_n(i)^2}{\sum_{i=0}^{N-1}\left[x_n(i)-x(i)\right]^2}\right)$ (9)
$\operatorname{SNR} 2=\left(\frac{\sum_{i=0}^{N-1} x^{\prime}(i)^2}{\sum_{i=0}^{N-1}\left[x^{\prime}(i)-x(i)\right]^2}\right)$ (10)
here, x(i) is noise free original signal, xn which is the noisy signal, x'(i) is the reconstructed signal at the ith sample, and N is the total number of the original signal samples. SNR1 and SNR2 are signal-to-noise ratios on the transmission and receiving sides, respectively.
The MATLAB simulation results are presented for the wavelet-based proposed data compression and noise reduction design. The proposed design is applied to the simulated data of phase current signal from the Phasor measurement Unit (PMU) at the fault location. Run the event data file 30 seconds, 8-12 seconds before the fault, and 18-22 seconds after a fault to differentiate between the faulty and standard signals. It can locate and detect the fault and helps in fault analysis. One thousand twenty-four samples of the sampled data are selected at the disturbance location. The proposed design results for 1024 samples of noisy PMU data at different noise levels are shown in Figure 5 to Figure.8 and Table 1. The results are further compared [23, 24].
The proposed design is also applied to the simulated data of load voltage signal during earthing fault. Run the event data file 30 seconds, 8-12 seconds before the fault, and 18-22 seconds after a fault to differentiate between the faulty and standard signals. It can locate and detect the fault and helps in fault analysis. One thousand twenty-four samples of the sampled data are selected at the disturbance location. The results of the proposed design for 1024 samples of noisy load voltage data at different noise levels are shown in Figure 10 to Figure 13 and presented in Table 2. The results are further compared with the studies [23, 24].
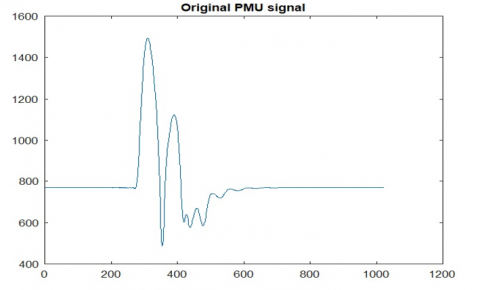
Figure 4. Original PMU current signal for 1024 samples
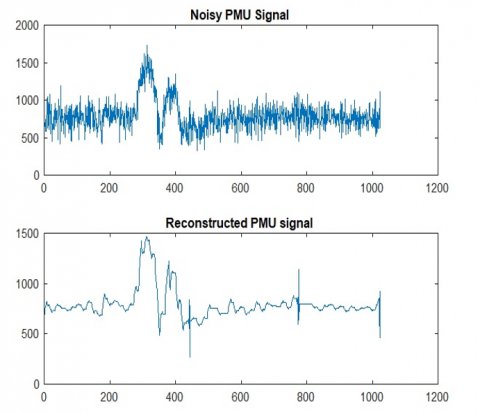
Figure 5. Reconstructed Signal of SNR 62.59 dB from noisy PMU signal of SNR 15.89 dB by proposed design
Figure 4 shows the original PMU phase current signal for 1024 samples at the fault location. The noise levels are added to the original signal to get the noisy signal at the transmission end. The noisy signal is compressed while transmitting and then reconstructed at the receiving end by the proposed design for 1024 samples. The reconstructed signals for different noisy levels are shown in Figure 5 to Figure 8. When the noisy signal is denoised, the compression ratio is the by-product of this denoising process. The compressed signal can be transferred quickly. The denoised reconstructed signal has power quality and can communicate the fault in the signal very well.
Figure 6. Reconstructed Signal of SNR 60.02 dB from noisy PMU signal of SNR 24.541 dB by proposed design
Figure 7. Reconstructed Signal of SNR 60.46 dB from noisy PMU signal of SNR 30.316 dB by proposed design
Figure 8. Reconstructed Signal of SNR 61.22 dB from noisy PMU signal of SNR 35.349 dB by proposed design
Table 1. Results of noisy PMU signal of 1024 samples
|
|
Original signal SNR (dB) |
% CR |
SNR2 (dB) |
NRMSE |
|
Proposed design |
15.89 |
6.93 |
62.59 |
0.0524 |
|
[23] |
15.89 |
15.2 |
52.393 |
0.436x10⁻⁵ |
|
[24] |
15.89 |
- |
37.764 |
12.65x10⁻⁵ |
|
Proposed design |
18.927 |
6.93 |
55.22 |
0.0434 |
|
[23] |
18.931 |
15.5 |
54.92803 |
0.243x10⁻⁵ |
|
[24] |
18.927 |
- |
40.842 |
6.229x10⁻⁵ |
|
Proposed design |
24.541 |
7.32 |
60.02 |
0.0357 |
|
[23] |
24.547 |
15.3 |
58.07 |
0.118x10⁻⁵ |
|
[24] |
24.541 |
- |
46.394 |
1.734x10⁻⁵ |
|
Proposed design |
27.82 |
6.93 |
68.54 |
0.034 |
|
[23] |
27.826 |
15.4 |
59.151 |
0.092x10⁻⁵ |
|
[24] |
27.82 |
- |
49.526 |
0.843x10⁻⁵ |
|
Proposed design |
30.316 |
7.13 |
60.46 |
0.033 |
|
[23] |
30.321 |
15.4 |
59.653 |
0.082x10⁻⁵ |
|
[24] |
30.316 |
- |
51.807 |
0.499x10⁻⁵ |
|
Proposed design |
35.349 |
7.03 |
61.22 |
0.0324 |
|
[23] |
35.778 |
15.5 |
60.029 |
0.075x10⁻⁵ |
|
[24] |
35.349 |
- |
54.882 |
0.246x10⁻⁵ |
Figure 9. Original load voltage signal for 1024 samples
From Table 1, it is observed that the proposed design has improved compression ratio (CR) and signal to noise ratio (SNR) for noisy PMU phase current signal at different noise levels [23, 24], and the results are satisfactory. The proposed design has obtained the best compression ratio of 6.93% and signal to noise ratio of 68.54 dB. In the lossy compression method, the lost data is the distortion between the original and the reconstructed signals. The proposed design calculates it by normalized root mean square error NRMSE. From Table 1, for the noisy signal with SNR 24.541dB, the signal is reconstructed with NRMSE 0.0357; hence the loss rate of the data signal is 3.57%.
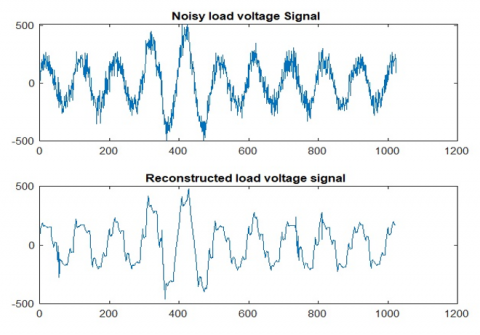
Figure 10. Reconstructed signal of SNR 41.07 dB from noisy load voltage signal of SNR 4.861 dB by proposed design
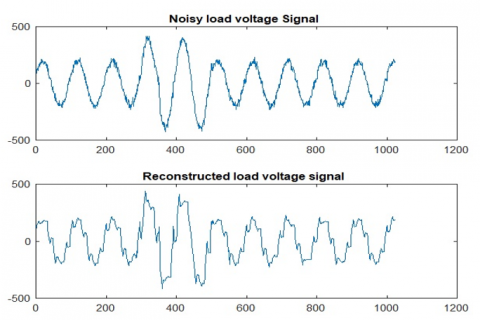
Figure 9 shows original load voltage signal for 1024 samples. The noise levels are added to the original signal to get the noisy load voltage signal. The noisy load signal is compressed while transmitting and then reconstructed at the receiving end by the proposed design for 1024 samples. The reconstructed signals for different noisy levels are shown in Figure 10 to Figure 13.
Figure 11. Reconstructed signal of SNR 37.49 dB from noisy load voltage signal of SNR 9.661 dB by proposed design
Figure 12. Reconstructed signal of SNR 36.07 dB from noisy load voltage signal of SNR 16.591 dB by proposed design
Figure 13. Reconstructed signal of SNR 41.22 dB from noisy load voltage signal of SNR 19.668 dB by proposed design
From Table 2, it is observed that the proposed design has improved compression ratio (CR) and signal-to-noise ratio (SNR) for noisy load voltage signals at different noise levels [23, 24]. The proposed design has obtained the best compression ratio of 7.13%, and signal-to-noise ratio of 43.16 dB. From Table 2, for the noisy signal with SNR 22.742 dB, the signal is reconstructed with NRMSE 0.0486; hence the loss rate of the data signal is 4.86%.
Table 3 shows that the proposed design has used Db3, Db2, Db2, and Db1 wavelets from the first to fourth decomposition levels, whereas [23] has used six levels of decomposition with Db2 wavelet and [24] has used four levels of decomposition with higher order sym8 wavelet. The proposed design has used fewer filters as it decomposes only approximation coefficients further, whereas, in the studies [23, 24], they use more filters to further decompose both approximation and detail coefficients. Hence the proposed method has less complexity than the studies [23, 24].
Table 2. Results of noisy load voltage signal of 1024 samples
|
Original signal SNR (dB) |
% CR |
SNR2 (dB) |
NRMSE |
|
|
Proposed design |
4.861 |
7.13 |
41.07 |
0.068 |
|
[23] |
4.914 |
12.5 |
22.219 |
12.338x10⁻⁵ |
|
[24] |
4.861 |
- |
24.419 |
1.497x10⁻⁴ |
|
Proposed design |
9.661 |
7.13 |
37.49 |
0.058 |
|
[23] |
9.409 |
13 |
24.969 |
6.543x10⁻⁵ |
|
[24] |
9.661 |
- |
28.542 |
0.578x10⁻⁴ |
|
Proposed design |
12.169 |
7.32 |
38.87 |
0.0542 |
|
[23] |
12.423 |
13.2 |
26.049 |
5.100x10⁻⁵ |
|
[24] |
12.169 |
- |
29.775 |
0.435x10⁻⁴ |
|
Proposed design |
16.591 |
7.13 |
36.07 |
0.0538 |
|
[23] |
16.698 |
13.4 |
26.654 |
4.437x10⁻⁵ |
|
[24] |
16.591 |
- |
30.996 |
0.328x10⁻⁴ |
|
Proposed design |
19.668 |
7.23 |
41.22 |
0.0534 |
|
[23] |
19.749 |
13.6 |
27.160 |
3.949x10⁻⁵ |
|
[24] |
19.668 |
- |
31.398 |
0.299x10⁻⁴ |
|
Proposed design |
22.742 |
7.13 |
43.16 |
0.0486 |
|
[23] |
22.649 |
14.5 |
28.019 |
3.242x10⁻⁵ |
|
[24] |
22.742 |
- |
31.607 |
0.285x10⁻⁴ |
Table 3. Comparison of complexity of proposed design
|
Details |
Proposed design |
[23] |
[24] |
|
Technique |
Discrete Wavelet Transform |
Wavelet Packet Decomposition |
Wavelet packet Transform with Weighted entropy and modified MDL |
|
Level of Decomposition |
4 |
6 |
4 |
|
Wavelets |
Db3, Db2, Db2, Db1 |
Db2 |
Sym8 |
|
Complexity |
Less complex |
More complex |
More complex |
The proposed wavelet-based design using Discrete Wavelet Transform is developed to reduce the smart grid data and improve the signal's quality by noise reduction. The proposed design has reduced the computational complexity in the studies [23, 24] by achieving a better compression ratio and signal-to- noise ratio at the 4th level of decomposition using Daubechies filters db3, db2, db2, and db1 for 1024 samples. The proposed design is the best after different combinations of the above four wavelets at four levels. The results are improved for compression ratio up to 6.93% for PMU signal and 7.13% for load voltage signal. The results are improved for the signal-to- noise ratio of 68.54dB for the PMU signal and 43.16 dB for the load voltage signal. The reconstruction error is NRMSE 0.0324 for the PMU signal and NRMSE 0.0486 for the load voltage signal. It has reduced the cost of data compression and data storage and increased the data transfer by using a smaller number of filters [23, 24]. However, the proposed method has limitation in terms of NRMSE. It can be further improved by using higher number of decomposition level.
[1] Asaad, M., Ahmad, F., Alam, M.S., Sarfraz, M. (2021). Smart grid and Indian experience: A review. Resources Policy, 74: 101499. https://doi.org/10.1016/j.resourpol.2019.101499
[2] Berger, L.T., Schwager, A., Escudero-Garzás, J.J. (2013). Power line communications for smart grid applications. Journal of Electrical and Computer Engineering, 2013. https://doi.org/10.1155/2013/712376
[3] Wen, L., Zhou, K., Yang, S., Li, L. (2018). Compression of smart meter big data: A survey. Renewable and Sustainable Energy Reviews, 91: 59-69. https://doi.org/10.1016/j.rser.2018.03.088
[4] Bhuiyan, B.A., Absar, M.W., Roy, A. (2017). Performance comparison of various wavelets in compression of PMU generated data in smart grid. In 2017 3rd International Conference on Electrical Information and Communication Technology (EICT), pp. 1-6. https://doi.org/10.1109/EICT.2017.8275177
[5] Unterweger, A., Engel, D. (2014). Resumable load data compression in smart grids. IEEE Transactions on Smart Grid, 6(2): 919-929. https://doi.org/10.1109/TSG.2014.2364686
[6] Singh, S. (2019). Improving quality of service in the smart grid using data compression and encryption technique. International Journal of Advance Research, Ideas and Innovations in Technology, 5(3): 2172–2176.
[7] Tcheou, M.P., Lovisolo, L., Ribeiro, M.V., Da Silva, E.A.B., Rodrigues, M.A.M., Romano, J.M.T., Diniz, P.S.R. (2014). The compression of electric signal waveforms for smart grids: State of the art and future trends. IEEE Trans. Smart Grid, 5(1): 291-302.
[8] De Souza, J.C.S., Lessa Assis, T.M., Pal, B.C. (2017). Data compression in smart distribution systems via singular value decomposition. IEEE Transactions on Smart Grid, 8(1): 275-284. https://doi.org/10.1109/TSG.2015.2456979
[9] Li, Q., Zhang, M., He, S., Li, S. (2018). Instructions data compression for smart grid monitoring using wavelet domain singular value decomposition. Proceedings of the 30th Chinese Control and Decision Conference, CCDC 2018, pp. 5171-5175. https://doi.org/10.1109/CCDC.2018.8408029
[10] Karthika, S., Rathika, P. (2019). An efficient data compression algorithm for smart distribution systems using singular value decomposition. IEEE International Conference on Intelligent Techniques in Control, Optimization and Signal Processing, INCOS2019, pp. 1-7. https://doi.org/10.1109/INCOS45849.2019.8951340
[11] Uddin, Z., Ahmad, A., Qamar, A., Altaf, M. (2018). Recent advances of the signal processing techniques in future smart grids. Human-centric Computing and Information Sciences, 8(1): 1-15. https://doi.org/10.1186/s13673-018-0126-9
[12] Santoso, S., Powers, E.J., Grady, W.M. (1997). Power quality disturbance data compression using wavelet transform methods. IEEE Transactions on Power Delivery, 12(3): 1250-1256. https://doi.org/10.1109/61.637001
[13] Panda, G., Dash, P.K., Pradhan, A.K., Meher, S.K. (2002). Data compression of power quality events using the Slantlet transform. IEEE Transactions on Power Delivery, 17(2): 662-667. https://doi.org/10.1109/61.997957
[14] Dash, P.K., Panda, G., Sahoo, D.K., Panigrahi, B.K. (2002). Power quality disturbance data compression, detection, and classification using integrated spline wavelet and S-transform. IEEE Power Engineering Review, 22(7): 61. https://doi.org/10.1109/MPER.2002.4312423
[15] Wu, C.J., Fu, T.H., Huang, H.P. (2003). Data compression technique in recording electric arc furnace voltage and current waveforms for tracking power quality. In Proceedings of the IEEE Power Engineering Society Transmission and Distribution Conference, pp. 383-388. https://doi.org/10.1109/tdc.2003.1335253
[16] Ribeiro, M.V., Romano, J.M.T., Duque, C.A. (2004). An improved method for signal processing and compression in power quality evaluation. IEEE Transactions on Power Delivery, 19(2): 464-471. https://doi.org/10.1109/TPWRD.2003.822497
[17] Karthika, S., Rathika, P. (2018). Wavelet transform based compression of electric signal waveforms for smart grid applications. 7(4): 5419-5426. https://doi.org/10.14419/ijet.v7i4.23269
[18] Khan, J., Bhuiyan, S., Murphy, G., Arline, M. (2015). Embedded zerotree wavelet based data denoising and compression for smart grid. IEEE Transactions on Industry Applications, 9994(c): 1-11. https://doi.org/10.1109/TIA.2015.2420613
[19] Hamid, E.Y., Kawasaki, Z.I. (2002). Wavelet-based data compression of power system disturbances using the minimum description length criterion. IEEE Transactions on Power Delivery, 17(2): 460-466. https://doi.org/10.1109/61.997918
[20] Gäşpäresc, G. (2010). Data compression of power quality disturbances using wavelet transform and spline interpolation method. 2010 9th Conference on Environment and Electrical Engineering. EEEIC2010, pp. 285-288. https://doi.org/10.1109/EEEIC.2010.5489992
[21] Bhuiyan, S., Khan, J., Murphy, G. (2018). Weighted entropy for data compression in smart grid. 2018 IEEE Industry Applications Society Annual Meeting, IAS2018, pp. 1-6. https://doi.org/10.1109/IAS.2018.8544486
[22] Huang, S.J., Jou, M.J. (2004). Application of arithmetic coding for electric power disturbance data compression with wavelet packet enhancement. IEEE Transactions on Power Systems, 19(3): 1334-1341. https://doi.org/10.1109/TPWRS.2004.825899
[23] Khan, J., Bhuiyan, S., Murphy, G., Williams, J. (2016). Data denoising and compression for smart grid communication. IEEE Transactions on Signal and Information Processing over Networks, 2(2): 200-214. https://doi.org/10.1109/TSIPN.2016.2539680
[24] Khan, J. (2021). Weighted entropy and modified MDL for compression and denoising data in smart grid. International Journal of Electrical Power and Energy Systems, 133: 107089. https://doi.org/10.1016/j.ijepes.2021.107089