Hande Yuksel Bayram | Harun Bingol | Bilal Alatas*
© 2022 IIETA. This article is published by IIETA and is licensed under the CC BY 4.0 license (http://creativecommons.org/licenses/by/4.0/).
OPEN ACCESS
Tomatoes are preferred by farmers because of their high productivity. This fruit has a fibrous structure and contains plenty of vitamins. Tomato diseases are generally observed on stem, fruit, and leaves. Early diagnosis of the disease in plants is of vital importance for the plant. This is very important for farmers who expect economic gain from that plant. Because if the disease is not treated early, these tomatoes should be destroyed. For these reasons, systems to diagnose the disease early are very important. In this study, a tomato leaf diseases classification model developed with deep learning methods, which is one of the most popular artificial intelligence techniques, is proposed in order to eliminate the possibility of the human eye being mistaken. In this study, 6 different Convolutional Neural Network (CNN) architectures were used. In the first stage of this study, which consists of two stages, the classification process was carried out with the Alexnet, Googlenet, Shufflenet, Efficientb0, Resnet50, and Inceptionv3 architectures that were previously trained. In the second stage, feature maps of tomato leaf images in the dataset were obtained using the six pre-trained deep learning architectures. In the hybrid model proposed in this study, the feature maps extracted using the best two of the six deep learning models are concatenated. Then, the Neighborhood Component Analysis (NCA) method was applied to the extracted features in order to speed up the system, unnecessary features were removed and optimized. The optimized feature map is classified by traditional intelligent classification models. As a result of experimental studies, the average accuracy rate of the proposed model is 99.50 percent.
NCA, CNN, machine learning, tomato leaf image, classifiers
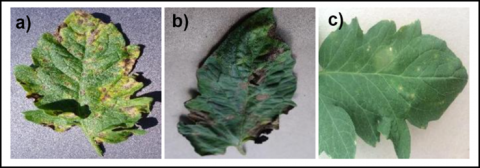
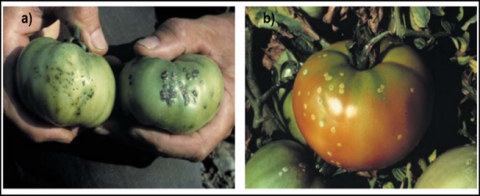
Tomato fruit is one of the most consumed nutrients in the world [1]. Therefore, its production is quite high all over the world. This is a source of livelihood for most people. It is very important for the farmers that the tomato plant is healthy and yields abundant products in terms of economic gain. Tomatoes can be affected by environmental conditions and climatic features, just like other plants, and they can get diseases. Changing climatic conditions, international travel, trade of plant materials cause new virus species to enter the production system [2]. Tomato diseases can be caused by fungal and bacterial as well as viruses. Fungal diseases are usually seen as a small water-soaked spot on the leaf of the tomato, and they become round spots 0.3 cm in diameter in a short time [3]. In bacterial diseases, hot and rainy weather facilitates the progression of the disease. In Bacterial spot disease caused by the bacteria Xanthomonas campestris pv vesicatoria, the spots appearing on the leaves are small in the initial stage of the disease, but later they take on a dark brown irregular shape with pits of 0.6 cm to 1.2 cm in size on the tomato and leaf [3]. Early diagnosis of tomato leaf diseases is very important for the treatment of the plant. Yellow leaf curl virus, bacterial spot, mosaic virus, septoria leaf spot, leaf mold, late blight, powdery mildew and early blight diseases are the most common tomato leaf diseases [4]. Image samples of some diseased leaves are shown in Figure 1 and image samples of tomatoes infected with some bacterial diseases are shown in Figure 2.
Figure 1. Diseased tomato leaves a) Septoria leaf spot disease b) Early blight disease c) Late blight disease
Figure 2. Diseased tomatoes caused by bacteria a) Green b) Red [3]
It is a very difficult task that requires expertise to distinguish diseases from each other, since there are many types of deformations caused by viruses, bacteria or fungi that cause disease in tomato leaves, and deformations caused by physical destruction on the leaf surface. In cases where there are not enough specialists or even if there are enough specialists, deep learning technologies are used so that the existing specialists do not spend too much time on the classification process by distinguishing the diseases from each other and not experiencing a loss of workforce. The establishment of automatic detection systems will be useful in the diagnosis of diseased leaves, especially in planting activities where the area to be planted is quite large and a lot of budgets is allocated. There are many models developed with deep learning technologies. The most used model in the field of image classification is the CNN model. In this study, experiments were carried out using six of the most well-known and proven CNN architectures. During the experiments, the publicly available Taiwan tomato leaf dataset containing six classes was used. In our study, a hybrid architecture was proposed in order to increase the classification accuracy of tomato leaf disease images and to obtain more effective results. In this way, it is aimed to increase the production amount by detecting diseases on tomato leaves earlier. In this model proposed in this paper; Googlenet and Resnet50, which are the most successful, are used as the architectural basis. The feature maps obtained from the Googlenet and Resnet50 architectures were concatenated and then the unnecessary features were extracted with the NCA method, which is a feature selection method. In this way, the training time of the model is reduced. Then, the classification process was carried out using K-Nearest Neighbors (KNN), Support Vector Machine (SVM), Naive Bayes (NB), and Decision Tree (DT) machine learning methods.
The contribution of the study to the literature is as follows:
The remaining parts of this study are as follows. In the second section, scientific studies on the classification of tomato leaf diseases are presented. In the third section, the CNN models, classification methods and feature selection algorithm used in the experiments are explained. In the fourth section, information is given about the proposed hybrid model and the datasets used. Experimental results are included in the fifth section. Discussions and results are presented in the sixth and last section.
Many scientific studies have been carried out in the literature for the detection of tomato diseases. Some of these studies are:
Cengil and Cinar [4] used 2 datasets to classify tomato leaf diseases in their study. They applied the mRMR feature selection technique to the features obtained from Alexnet, VGG16, and Resnet50 deep learning architectures. These features were used by the classification algorithms. They stated that the accuracy in the Taiwan dataset was 96.5%, while the accuracy in the Tomato diseases dataset was 98.3%.
Tm et al. [5] used a dataset containing approximately 18160 leaf images with 10 classes to classify diseased tomato leaves in their study. The images in the dataset are given as input to the Lenet architecture. They stated that the average accuracy rate they obtained was 94-95%. The use of more up-to-date architectures, whose performance has been accepted by the whole scientific world, can increase the success of the study.
Hasan et al. [6] tried to detect areas with high disease in farms using CNN architectures. They used drones to identify diseased areas. In addition, they used a 3-class dataset consisting of a total of 2600 tomato leaf images, 2100 of which they obtained from the internet and the other 500 obtained from farms. They reported that 99% accuracy was achieved when the training rate was 85%. There are datasets with more classes and more images in the literature. It is thought that the number of images contained in this data set is not sufficient for the effective operation of CNN architectures.
Agarwal et al. [7] tried to classify tomato leaf disease on a 10-class dataset using CNN architectures. Their average accuracy rate was 91.2%. The number of images in the classes in the dataset is unstable. Therefore, they stated that data duplication techniques are used, thus making the data set stabled.
In their study, Basavaiah and Anthony [8] used color histograms, hu moments, haralick, and local binary pattern feature extraction methods together to extract features such as color, texture, and shape in order to increase the accuracy rate in the classification process of tomato leaf images. They applied classification process on a data set consisting of 500 tomato leaf images with 4 classes. While the accuracy obtained in the DT classifier was 90%, they reported the accuracy rate obtained from the Random Forest (RF) classifier as 94%. The number of images in the dataset used in their study is quite low.
Rangarajan et al. [9], in their study, classified 13262 tomato leaf images in the 7-class PlantVillage dataset with Alexnet and VGG16 architectures, which are deep learning architectures. While the accuracy value obtained by the Alexnet architecture was 97.29%, the accuracy obtained by the VGG16 architecture was 97.49%. Researchers used pre-trained models in their study. New models can be developed to increase the existing accuracy value obtained.
Chen et al. [10] used a dataset containing 8616 images to describe and classify tomato leaf diseases. In the study, they used the BWTR method to reduce noise and remove noise from leaf images. Then, they separated the tomato leaves from the background with the ABC algorithm. Finally, they used the B-ARNet model based on the main body of the ResNet50 network to describe the images. It was stated that the accuracy of their proposed model was 89%.
Zhang et al. [11] used transfer learning methods Alexnet, Resnet, and Googlenet to identify tomato leaf diseases in their study. They used a dataset containing 5550 images and disease classes. The highest accuracy value was obtained from Resnet architecture with 97.28%.
In their study, Elhassouny and Smarandache [12] classified tomato disease images using the Mobilenet model, which is a CNN architecture. They designed a system in which tomato leaf images taken with a mobile phone camera are first applied by transfer learning methods and then these images are classified. The dataset they used during the experiments includes 7176 images with 10 classes. It is stated that the accuracy rate obtained when the learning rate value of 0.001 is selected is 90.3%.
Batool et al. [13] tried to classify tomato leaf diseases using many CNN architectures in their study. They used a 9-class dataset with a total of 450 images, 270 images for training purposes and 180 images for testing purposes. Since the tomato leaf images they used were different in size, they resized these images to 227×227. The k-NN classifier was used to classify the images. It was emphasized that the highest accuracy value of 76.1% was obtained with the Alexnet architecture. In this study, deep learning architectures were tried to be used with very little data. There is limited data in this study.
3.1 Classification methods
SVM classifier is one of the most widely used and known classical machine learning techniques. It was recommended by Vapnik [14]. SVM offers four types of cores due to its structure. These are radial basis function, polynomial, sigmoid and linear. The linear one of these kernel types is used effectively especially in large data sets. The mathematical expression for the linear kernel is shown in Eq. (1) [15].
$K\left(x_i, x_j\right)=\left(x_i \cdot x_j+c\right)$ (1)
The working logic of the KNN classifier is quite simple. Samples are classified according to the class of their nearest neighbors [16]. In determining the class, k nearest neighbors are taken into account. This classification technique is also known as memory-based classification, since the training samples must be in memory at the time of study [17].
The NB classifier makes learning significantly easier by assuming that the features are independent of the given classes [18]. NB is a classifier inspired by Bayes theorem shown in Eq. (2), which is largely based on the conditional probability calculation method. While the algorithm is running, it first calculates the probability of all possible states for each element. Then, it includes each element in the class with the highest probability [19].
$U(x=c y)=\frac{U(y x=c) U(x=c)}{U(y)}$ (2)
DT works by continuously dividing the data contained in the dataset. A test node computes some results based on the attribute values of a sample. Here each possible outcome is associated with one of the subtrees. An example is classified starting from the root node of the tree [20]. For datasets with too many features, DT learns slowly.
3.2 Pre-trained CNN models
A total of 6 pre-trained deep models, Alexnet, Googlenet, Resnet50, Efficientnetb0, Inceptionv3, and Shufflenet architectures, were used during the experiments. The Alexnet architecture was proposed by Krizhevsky et al. It was introduced in the Imagenet 2012 competition. It is one of the most popular deep learning architectures. Alexnet accepts 227×227 images [21]. Although the Googlenet architecture is similar to the Inception architecture, it was developed to achieve better computational capacity [22]. The Efficientnetb0 architecture is a member of the Efficientnet family, which includes 8 different architectures from b0 to b7. It is an architecture that achieves very successful results. Efficientnetb0 accepts 224x224 images [23]. Shufflenet is a deep model designed to provide effective results even on devices with low computing power. This model accepts 224×224 images [24, 25]. Resnet50 architecture accepts 224×224 images just like Googlenet and Shufflenet architectures. Resnet50 structurally adopted batch normalization [26-28]. The Inceptionv3 architecture has been developed with features inherited from the Inceptionv1 and Inceptionv2 architectures. The Inceptionv3 architecture, which consists of 315 layers, accepts images with a size of 299×299 [29].
3.3 NCA method
NCA is used to reduce computational cost and to obtain more useful feature maps with smaller size. Thanks to this method, lower-dimensional feature maps are obtained by optimizing the matrix without losing valuable information. The NCA method is one of the optimization methods that is used effectively to remove less valuable features from the feature map and to reduce the time consumption cost. This also reflects positively on classification costs.
The publicly available Taiwan tomato leaves dataset was used in the experiment [30]. There are 4976 tomato leaf images in the data set. In this data set, there are a total of 6 classes, 1 of which is healthy.
These classes are Black mold, Bacterial spot, Gray spot, Late blight, Powdery mildew, and Healthy. The number of images of tomato leaf diseases in the data set is presented in Table 1.
Googlenet and Resnet50 architectures, which have been very popular in recent years, have been used as the basis for the proposed model. Thanks to these architectures, different features of the images in the Taiwan dataset were obtained. The size of the feature map obtained in each architecture is 4976×1000. Then, a feature map of 4976×2000 size was obtained by concatenating the obtained feature maps. NCA dimension reduction method was utilized to decrease the size of the obtained feature map. After applying the NCA size reduction method, the size of the resulting feature map was 4976×253. Finally, the optimized feature map is classified by traditional machine learning methods. The block diagram of our proposed method is demonstrated in Figure 3.
Table 1. Architectural design of the proposed hybrid model
|
Disease classes |
Bacterial spot |
Black mold |
Gray spot |
Late blight |
Powdery mildew |
Healthy |
Total |
|
The number of images |
880 |
536 |
672 |
784 |
1256 |
848 |
4976 |
Figure 3. Architectural design of the proposed hybrid model
It was carried out with Matlab 2021b program on a computer with i7 processor, 8 GB RAM and 6 GB graphics card. Confusion matrix was used to evaluate the performance metrics of the models. They are TP (True Positive), FP (False Positive), FN (False Negative), and TN (True Negative). An example of the confusion matrix is given in Table 2.
Table 2. Confusion matrix
|
Actual Class |
1 |
TP |
FP |
|
2 |
FN |
TN |
|
|
|
|
1 |
2 |
|
|
|
Prediction Class |
|
The performances of deep models during the experiments are calculated using the confusion matrix. There are many evaluation methods available. In this study, accuracy, sensitivity, specificity, and F1_Score were used to evaluate the performance of the models as shown in Eq. (3), Eq. (4), Eq. (5), and Eq. (6), respectively [22].
Accuracy $=\frac{T P+T N}{T P+T N+F P+F N}$ (3)
Sensitivity $=\frac{T P}{T P+F N}$ (4)
Specificity $=\frac{T N}{T N+F P}$ (5)
$F 1_{-}$Score $=\frac{2 * T P}{(2 * T P+F P+F N)}$ (6)
Firstly, results were obtained in six different pre-trained CNN architectures to compare the performance of the model proposed in this study. In the experiments, the data set was divided into 80% as training and 20% as testing. The accuracy values obtained in these architectures are listed in Table 3.
When Table 3 is examined, Inceptionv3 has the highest accuracy value of 92.82% among 6 different CNN architectures, and Shufflenet architecture has the lowest accuracy value with 87.85%. Table 4 shows the confusion matrices showing the accuracy values of the 6 CNN architectures. In addition, in Table 4, Bacterial spot, Black mold, Gray spot, Late blight, Health and, Powdery mildew classes are expressed as 1, 2, 3, 4, 5 and 6, respectively.
In the proposed hybrid method, feature maps from the highest performing Resnet50 and Googlenet architectures were concatenated. NCA dimension reduction method was applied to the concatenated feature map. In this way, the training phase of the model will take less time. Many machine learning classifiers were used while testing the proposed model. The results obtained are presented in Table 5. The accuracy value of the proposed model is indicated in bold.
Table 3. Accuracy values from CNN architectures
|
Efficientnetb0 |
Resnet50 |
Inceptionv3 |
Alexnet |
Googlenet |
Shufflenet |
|
58.29 |
75.48 |
73.57 |
73.27 |
75.68 |
69.75 |
Table 4. Confusion matrices of CNN architectures
Table 5. Results obtained with different machine learning methods (%)
|
Model |
Accuracy |
|
Googlenet+Resnet+NCA+NB |
64.60 |
|
Googlenet+Resnet+NCA+SVM |
98.40 |
|
Googlenet+Resnet+NCA+DT |
62.20 |
|
Googlenet+Resnet+NCA+KNN |
99.50 |
Table 6. The confusion matrix of the proposed model (Googlenet+Resnet50+NCA+KNN)
|
Actual Class |
1 |
873 |
1 |
1 |
1 |
|
4 |
|||
|
2 |
1 |
533 |
1 |
1 |
|
|
||||
|
3 |
2 |
|
667 |
2 |
|
1 |
||||
|
4 |
|
|
|
784 |
|
|
||||
|
|
5 |
|
|
|
|
848 |
|
|||
|
|
6 |
7 |
|
|
1 |
|
1248 |
|||
|
|
|
1 |
2 |
3 |
4 |
5 |
6 |
|||
|
|
|
Prediction Class |
|
|
|
|||||
Finally, the optimized feature map was classified in the KNN method. The accuracy of the proposed model was 99.50%. The confusion matrix obtained in this model is shown in Table 6.
Our proposed model classified 4953 of the 4976 tomato leaf images correctly, while misclassifying 23 of them. Our proposed model did not make any incorrect predictions in the Late blight and Health classes. The average accuracy value obtained in the proposed model was 99.50%. This average accuracy value obtained is higher than the accuracy values produced by the standard CNN architectures used during the experiments of the proposed model. The performance evaluation criteria obtained in our model are shown in Table 7.
Table 7. Performance evaluation of the proposed model on the basis of class (%)
|
|
Accuracy |
Sensitivity |
Specificity |
F1_Score |
|
Bacterial spot |
99.20 |
98.86 |
99.82 |
99.03 |
|
Black mold |
99.44 |
99.81 |
99.93 |
99.62 |
|
Gray spot |
99.25 |
99.70 |
99.86 |
99.47 |
|
Late blight |
100 |
99.36 |
100 |
99.68 |
|
Powdery mildew |
100 |
100 |
100 |
100 |
|
Healthy |
99.36 |
99.60 |
99.78 |
99.48 |
Table 8. Comparison of methods on classification of tomato diseases
|
Author / Year |
Dataset / Class Number |
Method |
Accuracy (%) |
|
Cengil and Cinar / 2021 [4] |
Tomato diseases / 10 |
CNN, mRMR, and QDVM |
98.30 |
|
Cengil and Cinar / 2021 [4] |
Taiwan / 6 |
CNN and KNN |
96.50 |
|
Tm et al. / 2018 [5] |
PlantVillage / 10 |
LeNet |
94.00-95.00 |
|
Hasan et al. / 2019 [6] |
2600 image / 3 |
Inceptionv3 |
99 |
|
Agarwal et al. / 2020 [7] |
PlantVillage / 10 |
CNN |
91.20 |
|
Basavaiah and Anthony / 2020 [8] |
500 image / 4 |
Handcrafted and DT |
90 |
|
Basavaiah and Anthony / 2020 [8] |
500 image / 4 |
Handcrafted and RF |
94 |
|
Rangarajan et al. / 2018 [9] |
PlantVillage / 7 |
VGG16 |
97.49 |
|
Rangarajan et al. / 2018 [9] |
PlantVillage / 7 |
AlexNet |
97.29 |
|
Chen et al. / 2020 [10] |
8616 image / 5 |
ABCK, BWTR, and B-ARNet |
89 |
|
Zhang et al. / 2018 [11] |
5550 image / 9 |
ResNet |
97.28 |
|
Elhassouny and Smarandache / 2019 [12] |
7176 image / 10 |
MobileNet |
90.30 |
|
Batool et al. / 2020 [13] |
450 image / 9 |
AlexNet |
76.10 |
|
Proposed Model / 2022 |
Taiwan Tomato Leaves / 6 |
Googlenet, Resnet50, NCA, KNN |
99.50 |
A diseased tomato leaf can often be seen with the naked eye. However, it is quite a matter of expertise to understand which leaf disease this disease is. These diseases can often be confused with each other. In this study, popular CNN networks were used as base to classify tomato leaf diseases. The aim here is to diagnose the diseases in the tomato leaves early and to start the treatment process of the plant early, in fact to prevent the spread of this disease. In this way, product quality and quantity will increase. In this study, 6 different CNN architectures, which are frequently used in the literature with proven success, were adapted. Two of the most successful of these were adjusted as the base in the hybrid model, which was first proposed in this article. There are different studies in the literature to classify tomato leaf diseases. These studies are shown in Table 8. When the hybrid model we proposed was compared with state-of-the-arts works, it was seen that it achieved very promising and competitive results. Testing the proposed model on a data set is the limitation of our study. In our future studies, it is among our goals to work with a data set containing images collected from more regions.
[1] Smith, A.F. (2001). The tomato in America: Early History, Culture, and Cookery. University of Illinois Press.
[2] Hanssen, I.M., Lapidot, M., Thomma, B.P. (2010). Emerging viral diseases of tomato crops. Molecular Plant-Microbe Interactions, 23(5): 539-548. https://doi.org/10.1094/MPMI-23-5-0539
[3] Gleason, M.L., Edmunds, B.A. (2005). Tomato diseases and disorders. Ames, IA: Iowa State University, University Extension.
[4] Cengil, E., Çınar, A. (2022). Hybrid convolutional neural network based classification of bacterial, viral, and fungal diseases on tomato leaf images. Concurrency and Computation: Practice and Experience, 34(4): e6617. https://doi.org/10.1002/cpe.6617
[5] Tm, P., Pranathi, A., SaiAshritha, K., Chittaragi, N.B., Koolagudi, S.G. (2018). Tomato leaf disease detection using convolutional neural networks. In 2018 Eleventh International Conference on Contemporary Computing (IC3), Noida, India, pp. 1-5. https://doi.org/10.1109/IC3.2018.8530532
[6] Hasan, M., Tanawala, B., Patel, K.J. (2019). Deep learning precision farming: tomato leaf disease detection by transfer learning. In Proceedings of 2nd International Conference on Advanced Computing and Software Engineering (ICACSE). https://dx.doi.org/10.2139/ssrn.3349597
[7] Agarwal, M., Singh, A., Arjaria, S., Sinha, A., Gupta, S. (2020). ToLeD: Tomato leaf disease detection using convolution neural network. Procedia Computer Science, 167: 293-301. https://doi.org/10.1016/j.procs.2020.03.225
[8] Basavaiah, J., Anthony, A.A. (2020). Tomato leaf disease classification using multiple feature extraction techniques. Wireless Personal Communications, 115(1): 633-651. https://doi.org/10.1007/s11277-020-07590-x
[9] Rangarajan, A.K., Purushothaman, R., Ramesh, A. (2018). Tomato crop disease classification using pre-trained deep learning algorithm. Procedia Computer Science, 133: 1040-1047. https://doi.org/10.1016/j.procs.2018.07.070
[10] Chen, X., Zhou, G., Chen, A., Yi, J., Zhang, W., Hu, Y. (2020). Identification of tomato leaf diseases based on combination of ABCK-BWTR and B-ARNet. Computers and Electronics in Agriculture, 178: 105730. https://doi.org/10.1016/j.compag.2020.105730
[11] Zhang, K., Wu, Q., Liu, A., Meng, X. (2018). Can deep learning identify tomato leaf disease? Advances in Multimedia, 2018: 6710865. https://doi.org/10.1155/2018/6710865
[12] Elhassouny, A., Smarandache, F. (2019). Smart mobile application to recognize tomato leaf diseases using convolutional neural networks. In 2019 International Conference of Computer Science and Renewable Energies (ICCSRE), Agadir, Morocco, pp. 1-4. https://doi.org/10.1109/ICCSRE.2019.8807737
[13] Batool, A., Hyder, S.B., Rahim, A., Waheed, N., Asghar, M.A. (2020). Classification and identification of tomato leaf disease using deep neural network. In 2020 International Conference on Engineering and Emerging Technologies (ICEET), pp. 1-6.
[14] Vapnik, V. (1999). The Nature of Statistical Learning Theory. Springer Science & Business Media. https://doi.org/10.1007/978-1-4757-3264-1
[15] Terzı, M.B., Arikan, O. (2018). Detection of acute myocardial ischemia based on support vector machines. In 2018 26th Signal Processing and Communications Applications Conference (SIU), pp. 1-4. https://doi.org/10.1109/SIU.2018.8404733
[16] Dasarathy, B.V. (1991). Nearest neighbor (NN) norms: NN pattern classification techniques. IEEE Computer Society Tutorial.
[17] Cunningham, P., Delany, S.J. (2021). K-nearest neighbour classifiers-A tutorial. ACM Computing Surveys (CSUR), 54(6): 1-25. https://doi.org/10.1145/3459665
[18] Rish, I. (2001). An empirical study of the naive Bayes classifier. In IJCAI 2001 Workshop on Empirical Methods in Artificial Intelligence, 3(22): 41-46.
[19] Soria, D., Garibaldi, J.M., Ambrogi, F., Biganzoli, E.M., Ellis, I.O. (2011). A ‘non-parametric’version of the naive Bayes classifier. Knowledge-Based Systems, 24(6): 775-784. https://doi.org/10.1016/j.knosys.2011.02.014
[20] Quinlan, J.R. (1996). Learning decision tree classifiers. ACM Computing Surveys (CSUR), 28(1): 71-72.
[21] Krizhevsky, A., Sutskever, I., Hinton, G.E. (2012). Imagenet classification with deep convolutional neural networks. Advances in Neural Information Processing Systems, 25: 1097-1105. https://doi.org/10.1145/3065386
[22] Szegedy, C., Liu, W., Jia, Y., Sermanet, P., Reed, S., Anguelov, D., Erhan, D., Vanhoucke, V., Rabinovich, A. (2015). Going deeper with convolutions. In Proceedings of the IEEE Conference on Computer Vision and Pattern Recognition, pp. 1-9. https://doi.org/10.1109/CVPR.2015.7298594
[23] Benyahia, S., Meftah, B., Lézoray, O. (2021). Skin lesion classification using convolutional neural networks based on multi-features extraction. In: Tsapatsoulis, N., Panayides, A., Theocharides, T., Lanitis, A., Pattichis, C., Vento, M. (eds) Computer Analysis of Images and Patterns. CAIP 2021. Lecture Notes in Computer Science(), vol 13052. Springer, Cham. https://doi.org/10.1007/978-3-030-89128-2_45
[24] Zhang, X., Zhou, X., Lin, M., Sun, J. (2018). Shufflenet: An extremely efficient convolutional neural network for mobile devices. In Proceedings of the IEEE Conference on Computer Vision and Pattern Recognition, pp. 6848-6856. https://doi.org/10.1109/CVPR.2018.00716
[25] Ozyurt, F., Mira, A., Coban, A. (2022). Face mask detection using lightweight deep learning architecture and raspberry pi hardware: An approach to reduce risk of coronavirus spread while entrance to indoor spaces. Traitement du Signal, 39(2): 645-650. https://doi.org/10.18280/ts.390227
[26] Bingol, H., Alatas, B. (2021). Classification of brain tumor images using deep learning methods. Turkish Journal of Science and Technology, 16(1): 137-143.
[27] Yildirim, M., Çinar, A. (2021). A new model for classification of human movements on videos using convolutional neural networks: MA-Net. Computer Methods in Biomechanics and Biomedical Engineering: Imaging & Visualization, 9(6): 651-659.
[28] Eroglu, Y., Yildirim, K., Çinar, A., Yildirim, M. (2021). Diagnosis and grading of vesicoureteral reflux on voiding cystourethrography images in children using a deep hybrid model. Computer Methods and Programs in Biomedicine, 210: 106369. https://doi.org/10.1016/j.cmpb.2021.106369
[29] Eroglu, Y., Yildirim, M., Cinar, A. (2022). mRMR‐based hybrid convolutional neural network model for classification of Alzheimer's disease on brain magnetic resonance images. International Journal of Imaging Systems and Technology, 32(2): 517-527. https://doi.org/10.1002/ima.22632
[30] Huang, M.L., Chang, Y.H. (2020). Dataset of tomato leaves. Mendeley Data, V1. https://doi.org/10.17632/ngdgg79rzb.1