Shunye Wang* | Limin Cheng | Dayong Liu | Junqiao Qin | Guohua Hu
© 2022 IIETA. This article is published by IIETA and is licensed under the CC BY 4.0 license (http://creativecommons.org/licenses/by/4.0/).
OPEN ACCESS
Classroom emotion is an important dimension to evaluate teaching effect, and the application of image processing to online teaching emotion analysis has become an inevitable trend of development. Aiming at the problems of low accuracy of expression recognition, unclear emotion scheme for online teaching evaluation, and low applicability of expression recognition model in existing methods, this paper conducts a research on classroom video image emotion analysis method for online teaching quality evaluation. First, the classroom video image emotion analysis task is divided into facial expression recognition task and facial feature point location task, and multi-task learning is carried out to achieve real-time switching between the two tasks for different types of input. The tag attention mechanism is proposed to deeply mine the key areas of the face in the classroom video image, so as to maintain the compactness of the distribution of the center sample of the classroom video image and its neighborhood samples in the feature space. Finally, based on the expression activity of teachers and students in the online classroom, the online classroom teaching emotion is analyzed, and the online teaching quality is evaluated from the side. The experimental results verify the validity of the model.
classroom emotion, classroom video, online teaching quality evaluation, image emotion analysis
Classroom teaching is a process of emotional communication between teachers and students. Whether online or offline, facial expressions are more explicit behaviors that can reflect the emotions of teachers and students than body movements and speech behaviors [1-5]. It is more direct and effective to capture the emotional changes of teachers and students and classroom emotions through facial expressions. In recent years, with the development of facial expression recognition technology, it has become an inevitable trend to promote the application of image processing in online teaching classroom emotion analysis [6-14].
Classroom emotion is an important dimension to evaluate classroom effect. From a micro perspective, online teaching quality evaluation based on image emotion analysis can help teachers obtain students’ classroom responses and judge the classroom atmosphere [15-19]. From a macro perspective, online teaching quality evaluation based on image emotion analysis has promoted the development of online teaching supported by facial expression recognition technology, making online teaching methods more abundant and diversified. Therefore, online teaching quality evaluation based on image emotion analysis has extremely important exploration value and application value.
Online teaching has the advantage of not being limited by location and space, but it also has some disadvantages. Wu and Huwan [20] analyzed and modeled the facial expression features of learners in the situations collected and extracted by the students of the project group, and integrated the time consumption, space occupation and classification effect of feature vectors generated by the improved model. The literature [21] aims to verify the application effect of online automatic evaluation system in English translation teaching, and understand students’ satisfaction with different feedback methods. Using the methods of questionnaire and comparative experiment, this paper makes a comparative analysis of three feedback methods: teacher feedback, online automatic feedback and teacher feedback combined with online automatic feedback. The study will help teachers better understand the deficiencies in translation teaching, so that they can take effective measures to solve these problems in the follow-up teaching process and improve the teaching effect. Compared with other models, facial expression plays a crucial role in emotion recognition. In this work, Saxena et al. [22] proposed an integrated network, which can use depth learning technology to recognize the level of emotional intensity in facial images in real time. Research on facial expression cognition based on expression intensity level is very useful in medical care, collaboration, Industry 4.0 and other applications. This work suggests using two other important parameters, namely, valence and emotion intensity, to enhance emotion recognition. This helps the machine to make a better automatic response to emotions. The proposed architecture achieves 99.1% and 99.11% accuracy for the price model and discrete model of offline image data, respectively. With the progress of machine learning, facial expression recognition (FER) has been greatly improved, which is mainly due to the development of deep learning methods for automatic facial expression classification. In the literature [23], the performance evaluation of the pre-training open source model for emotion facial expression recognition was conducted for images with different facial expression intensities. A total of 1,512 video frames from the ADFES-BIV dataset were submitted to five pre-training machine learning models for performance evaluation. The results show that the tested pre-training machine learning model is very sensitive to changes in facial expression intensity. In addition, a large recall variation rate was observed between different facial expressions.
According to the current research situation at home and abroad, the online teaching quality evaluation based on image emotion analysis is still in the stage of theoretical research and practical exploration, with low accuracy of expression recognition, unclear emotional scheme for evaluating online teaching, and low applicability of expression recognition model. In order to solve the above problems, this paper studies the method of classroom video image emotion analysis for online teaching quality evaluation. First, in the second part of this paper, the classroom video image emotion analysis task is divided into facial expression recognition task and facial feature point location task, and multi-task learning is carried out to achieve real-time switching between the two tasks for different types of input. In the third part of the article, this paper proposes to use the tag attention mechanism to deeply mine the key areas of the face in the classroom video image, and always maintain the compactness of the distribution of the center sample of the classroom video image and its neighborhood samples in the feature space. Finally, the fourth part of the article analyzes the online classroom teaching emotion based on the expression activity of teachers and students in the online classroom, and evaluates the online teaching quality from the side. The experimental results verify the validity of the model.
In this paper, the classroom video image emotion analysis task is divided into facial expression recognition task and facial feature point location task. Because facial expression recognition is a multi-classification problem, it is assumed that the classroom video image set used in this paper has L facial expression categories. Classroom video image sample ai is calculated by facial expression recognition model, and the jth output generated at the last full connection layer of the model is represented by Cji. Then the probability Rji that each classroom video image sample ai belongs to the jth type expression can be obtained by the following formula:
$R_j^i=\frac{p^{C_j^i}}{\sum_{j=1}^L p^{C_j^i}}$ (1)
Each classroom video image sample ai corresponds to a label b, then the loss function expression of facial expression recognition task can be given:
$K_i^{F E R T}=-\sum_{j=1}^L 1\left\{b_i=j\right\} \cdot \log \left(R_j^i\right)$ (2)
It is assumed that 1{bFERTi=j} is an indicative function, which satisfies that 1{class video image sample label is the jth-type}=1, 1{class video image sample label is not the jth-type}=0. The probability of the output label corresponding to the class is expressed by E(bi|ai). The above formula can be simplified as follows:
$K_i^{F E R T}=-\log E\left(b_i \mid a_i\right)$ (3)
Figure 1. Example of facial feature point location task
Figure 2. Multi-task learning model structure based on two tasks
The task of locating facial feature points is to identify the coordinates of the eyes, nose and two corners of the mouth of the task in the classroom video image samples. See Figure 1 for an example. The facial expression recognition model predicts the coordinates of the five points in the image, and ensures that the prediction results are as close as possible to the known feature point coordinate labels. In this paper, the learning objective of facial feature point location task is regarded as a regression problem, so the following loss function is constructed for each classroom video image sample ai. Assuming that the coordinate set predicted by the model is represented by biLA and the label coordinate set is represented by ḃiLA, then:
$K_i^{L A}=\left\|\dot{b}_i^{L A}-b_i^{L A}\right\|_2^2$ (4)
For the two tasks of facial expression recognition and facial feature point location, this paper conducts multi task learning, and switches the two tasks in real time for different types of input. Figure 2 shows the structure of the multi task learning model based on two tasks. That is to set the KiLA result to 0 when calculating KiFERT. Assuming that the task category is represented by d, and the weight set for each task is shown by φd, the overall learning objective function can be set as:
$\min \sum_{i=1}^n \sum_{d \in(f e r, L A)} \quad\phi_d \gamma_i^d K_i^d$ (5)
When part of the classroom video image is occluded, if the facial expression recognition model constructed can still recognize the corresponding facial expression category, it shows that the reserved area of the classroom video image is more important for facial expression recognition at this time. In addition, because there are large intra-class differences in facial expression recognition, the distribution of facial expression features extracted from the model in the class is relatively decentralized. For this reason, this paper proposes to use the tag attention mechanism to deeply mine the key areas of the face in the classroom video image, and always maintain the compactness of the distribution of the center sample and its neighborhood samples in the feature space of the classroom video image, so as to complete the correction of the feature distribution of the center sample. The structure of the model is shown in Figure 3.
The facial expression recognition model uses KL divergence and JS divergence to measure the difference between the two distributions. The formula is as follows:
$S U(E \| W)=\sum E(a) \cdot \log \frac{E(a)}{W(a)}$ (6)
$J S(E \| W)=\frac{1}{2} K L\left(E(a) \| \frac{E(a)+W(a)}{2}\right)$ $+\frac{1}{2} K L\left(W(a) \| \frac{E(a)+W(a)}{2}\right)$ (7)
Because the reserved classroom video image area is the key area in the task of facial expression recognition. If the parameters of a certain location area of the facial expression recognition model are updated violently, then the information of the location area is considered to be more important for the recognition performance of the model. Therefore, this paper constructs an importance matrix to reflect the importance of each position on the image. Specifically, each sample is adaptively calculated based on the sample labels of classroom video images nd gradient of model parameters.
Figure 3. Schematic diagram of model structure
The input image sample SR={(a1, b1)}, ..., (am, bm)} is provided, including m classroom video images and corresponding digital tags. The digital tag of image ai is represented by bi∈{1,..., d}, and the number of expression categories is represented by d. Supposing that the value of the dth position of the classification layer in the facial expression recognition model is represented by POSd, and the feature mapping of the lth channel of the feature map in a certain convolution layer is set. The corresponding POSbi is set according to ai and bi, and the importance weight xbil of each channel on X through the gradient between POSbi and Xlis calculated. The calculation formula is as follows:
$x_l^{b_i}=\frac{1}{v \times u} \sum_{i=1}^v \sum_{j=1}^u \frac{\partial P O S^{b_i}}{\partial X^l}$ (8)
xbil can be seen as the sum of gradients at each pixel in Xl, which indicates the importance of Xl to xbil. Next, the linear weighting operation of the image is performed:
$C V I=\sum_{l=1}^{S U} x_l^{b_i} X^l$ (9)
It is supposed that the channel number of X is represented by SU, then CVI∈Rv×u. In order to retain the pixels at the key positions in the image, this paper sets the threshold value of filtering the pixels at the unimportant positions in the CVI of classroom video images. Because Xl is the facial expression feature extracted from the deeper network of the model, the following activation operations are carried out to CVI in this paper, and the activation function used is ReLU function:
$C V I_{\operatorname{ReLU}}=\operatorname{ReLU}\left(C V I-\frac{1}{v \times u} \sum_{i=1}^v \sum_{j=1}^u C V I_{i j}\right)$ (10)
Finally, CVIReLU is normalized and sampled until an image with the same size as the original image is obtained. Assuming that the importance matrix is represented by N∈Rf*q, the function Max() is used to calculate the maximum value. The input characteristic graph is bilinear interpolated and represented by BI( ), then:
$I M=B I\left(\frac{M a p_{\mathrm{Re} L U}}{\operatorname{Max}\left(M a p_{\mathrm{Re} L U}\right)}, f, q\right)$ (11)
Based on the acquired importance matrix IM, the pixels of the classroom video image sample aiare processed as follows:
$\bar{a}_i=I M \cdot a_i$ (12)
For processed image āi, since the value range of all elements in the importance matrix IM is [0, 1], so the degree of retention of pixels at partial position of āi that is not 0 will correspond to the size of all elements in IM. Because the labels of āi and ai are the same, so the cross entropy loss function CE can be calculated based on the same label:
$C E_{C L}=C E\left(a_i, b_i\right)+C E\left(\tilde{a}_i, b_i\right)$ (13)
An ideal facial expression recognition model expects that when an image with partial occluded area is input network, the facial expression feature information extracted by the model is basically consistent with the feature information extracted when the original image sample is input, so it can be considered that the constructed model has a good performance in filtering redundant information in the image sample. Following the reference domain adaptive algorithm idea, this algorithm takes the original image ai as the source domain, and the image āi with area occluded is taken as the target domain, and the distance between the source domain and the target domain in the feature space is shortened based on the maximum mean difference. Let the data after occluding some pixels be represented by SR*={(a_1,b1),...,(a_m,bm)}, and the mapping function is represented by ψ(), then the distance between the source domain and the target domain can be calculated by the following formula:
$\operatorname{DIS}\left(S R, S R^*\right)=\left\|\frac{1}{m} \sum_{i=1}^m \psi\left(a_i\right)-\frac{1}{m} \sum_{i=1}^m \bar{a}_j\right\|_F^2$ (14)
There are different forms of ψ() for different tasks, and the above equation can be expanded by adopting kernel function technique:
$D I S\left(S R, S R^*\right)$ $=\left\|\begin{array}{l}\frac{1}{m^2} \sum_{i=1}^m \sum_{i^*}^m l\left(a_i, a_i^*\right) \\ -\frac{1}{m^2} \sum_{i=1}^m \sum_{j=1}^m l\left(a_i, \bar{a}_j\right)+\frac{1}{m^2} \sum_{j=1}^m \sum_{j^*}^m l\left(\bar{a}_j, \bar{a}_j^*\right)\end{array}\right\|_F$ (15)
In order to obtain the distribution difference between the source domain and the target domain in the feature space, this paper measures the distance between them in the kernel space based on the maximum mean difference. It is assumed that the depth information corresponding to āi and ai is represented by ḡi and gi, then the following distribution loss DLDIS is as follows:
$D L_{D I S}=D I S\left(g, \bar{g}_i\right)$ (16)
Because the emotions of teachers and students in online classes are complex and changeable, it is not appropriate to use traditional facial expression labels. In addition, for facial expression recognition tasks with large intra class differences, it is necessary to properly constrain the feature distribution in their feature space. In view of the above problems, this paper takes certain measures from the level of classroom video image samples. Considering the original image and the image with partial occluded area, the algorithm in this chapter ensures that the key area information of the neighborhood image is consistent with the information of the corresponding area in the original image by finding the neighborhood of each center classroom video image sample.
The cascade features [gi, ḡi] of gi and ḡi are clustered , and n neighborhood images {a-1i,…,ani} is found for classroom video image sample ai. Because this paper comprehensively considers the global and local information of facial expression, the feature information of neighborhood images in local areas is ensured to have certain similarity. Next, n neighborhood images are sent into the built facial expression recognition model. The feature {gi1,...,gin} extracted from the model gives a confidence degree to each classroom video image sample in the neighborhood by measuring the distance between gi and {gi1,...,gin}, that is, the feasibility of the feature of neighborhood image ani to modify the feature of ai, which is represented by δji and calculated by the following formula:
$\delta_i^j=p^{-\frac{\left\|g_i-g_i^j\right\|\quad^2}{2^* \varepsilon^2}}$ (17)
KL divergence is used to measure the distribution difference between two classroom video image samples. Assuming that the probability distribution of classroom video image sample ai generated by the facial expression recognition model constructed is represented by Ei, and the probability distribution of the jth sample in the neighborhood of classroom video image sample ai is represented by Eji, then there is the following modified loss expression:
$C L_{A M}=\frac{1}{m} \sum_{i=1}^m \sum_{j=1}^n \delta_i^j \bullet K L\left(E_i^j, E_i\right)$ (18)
Through the correction loss of the construction, the facial expression recognition model constructed avoids the negative impact of the label problem in the optimization process, while maintaining the compactness of the intra class distribution. Assuming that the super parameters used to control the loss ratio are represented by γ and α, to sum up, the following formula gives the expression of the total loss function of the model training:
$L O S S=C E_{C L}+\gamma \cdot D L_{D I S}+\alpha \cdot C L_{A M}$ (19)
This paper analyzes the online classroom teaching emotion based on the expression activity of teachers and students in the online classroom, and evaluates the online teaching quality from the side. It is assumed that the cumulative total number of teachers’ and students’ expressions is shown by CUO_TO and the total number of accumulated teachers’ expression is demonstrated by CUO_TE. When the student’s output expression classification result is positive expression, the positive expression counter is accumulated, and the number is expressed by CUR+. When the student’s output expression classification result is negative expression, the negative expression counter is accumulated, and the number is expressed by CUR-. The total number of expressions of the ith student is shown by CURi_TO, and the teacher’s expression activity BHDO can be calculated by the following formula:
$B H D_O=\frac{C U_{O_{-} T E}}{C U_{O_{-} T O}}$ (20)
The positive expression activity BHDRi+ of the ith student can be calculated by the following formula:
$B H D_{R_i+}=\frac{C U_{R_i+}}{C U_{R_{i_{-}} T O}}$ (21)
The negative expression activity BHDRi- of the ith student can be calculated by the following formula:
$B H D_{R_i-}=\frac{C U_{R_i-}}{C U_{R_{i_{-}} T O}}$ (22)
Class activity HY is determined by BHDO, BHDRi+, and BHDRi-. Supposing that the weight of teachers’ expression activity is determined by μO and that the weight of students’ expression activity is determined by μR, and μO+μR=1, μR<μO, then
$H Y=\mu_O \times B H D_T+\mu_R \times \frac{1}{j} \sum_{i=1}^j\left(B H D_{R_{i^{+}}}-B H D_{R_{i^{-}}}\right)$ (23)
The threshold value O1 and O2 whose value range is (0,1) are set, and O1<O2. HY is compared with O1 and O2 to obtain the online teaching quality evaluation conclusion OTQ. If the online teaching quality is excellent, it is expressed by EX, good by GO, and average by AV, then there is an evaluation formula:
Res $=\left\{\begin{array}{l}A V, H Y \in\left[0, O_1\right) \\ G O, H Y \in\left[O_1, O_2\right) \\ \text { EX, Activity } \in\left[O_2, 1\right]\end{array}\right.$ (24)
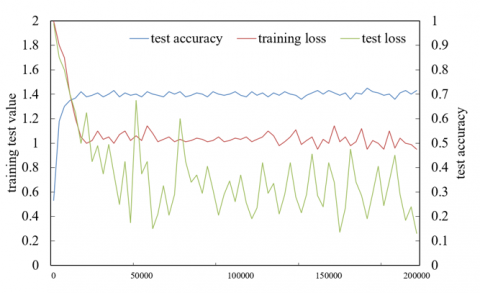
In order to test the model, 1,250 online classroom video images were selected in this paper. Each image was set with emotion tags including pleasure, stability, anxiety, helplessness, frustration, anger, disgust, fear, sadness, and surprise, etc. Figure 4 shows the training and testing of the constructed model characterized by three indicators: test accuracy, training loss and test loss. It can be seen from the figure that the output of the model is basically stable after 20,000 iterations, and the recognition accuracy can reach 72.4%.
Figure 4. Training and testing of the constructed model
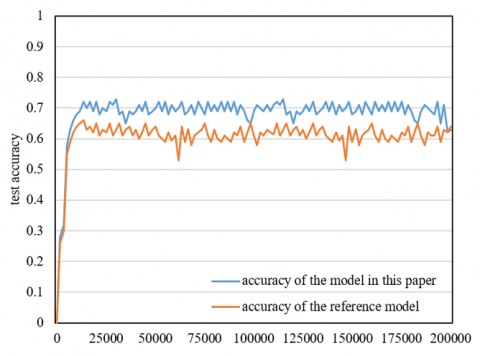
Figure 5. Comparison of test accuracy rates of different models
In order to verify that the model constructed in this paper has more effective facial expression recognition capability than the traditional convolutional neural network model, the test results of this model and the convolutional neural network expression recognition model are compared. Figure 5 shows the test accuracy comparison results of the two models. It can be seen from the figure that the convergence speed of the model in this paper is faster and the recognition accuracy is higher. This verifies the advantages of the model in high-quality facial expression feature extraction. Table 1 shows the test accuracy confusion matrix of different models. The facial expression recognition accuracy of frustration category is the highest, while that of anxiety category is the lowest.
In order to analyze the impact of the constructed model on the intra class distribution of facial expression recognition tasks, this paper visualizes the facial expression features generated by the model training in this paper, and the visualization results are shown in Figure 6. It is obvious from Figure 6 that the interval of different categories in the feature space embedded in the model is obvious and the distribution within the category is relatively compact.
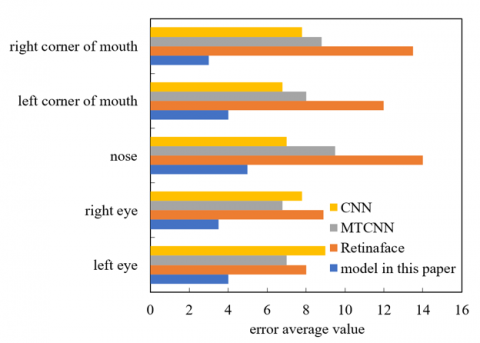
Facial feature point localization is an auxiliary task of facial expression recognition. In order to verify that the model constructed in this paper has a good performance in facial feature point locating, in this paper, the average detection error of selected eyes, nose, and two corners of mouth is taken as the performance evaluation index. Figure 7 shows the average detection error comparison of facial feature point locating. It can be seen from the figure that compared with the traditional convolutional neural network model, the traditional multitask convolutional neural network and the Retinaface model, the feature point positioning performance of the model in this paper is more ideal, which verifies the practicability of its online classroom video image facial expression recognition.
Table 1. Confusion matrix of test accuracy of different models
|
|
|
Happy |
Placid |
Restless |
Frustrated |
Angry |
Hateful |
Scared |
Sad |
Surprised |
|
Traditional convolutional neural network model |
Happy |
52.9 |
1.2 |
7.3 |
4.5 |
15.8 |
1.7 |
2.6 |
5.1 |
1.2 |
|
Placid |
5.1 |
75.4 |
3.6 |
5.8 |
7.1 |
3.5 |
1.9 |
2.2 |
1.9 |
|
|
Restless |
16.8 |
0.2 |
41.8 |
6.3 |
15.9 |
8.9 |
12.4 |
1.4 |
8.9 |
|
|
Frustrated |
2.1 |
0.6 |
1.5 |
85.7 |
3.6 |
1.5 |
4.8 |
3.2 |
1.9 |
|
|
Angry |
7.8 |
0.2 |
8.9 |
11.2 |
56.4 |
1.7 |
15.6 |
1.5 |
2.2 |
|
|
Hateful |
2.5 |
0.1 |
7.5 |
8.6 |
4.3 |
75.4 |
4.9 |
1.9 |
2.6 |
|
|
Scared |
4.2 |
0.6 |
5.8 |
8.1 |
16.9 |
1.5 |
63.8 |
1.1 |
1.3 |
|
|
Sad |
3.1 |
1.4 |
4.6 |
3.7 |
1.1 |
0.1 |
7.1 |
55.2 |
2.9 |
|
|
Surprised |
1.4 |
6.1 |
3.7 |
3.9 |
1.8 |
2.3 |
5.5 |
1.2 |
69.7 |
|
|
Model in this paper |
Happy |
62.8 |
1.2 |
5.5 |
4.1 |
15.8 |
1.3 |
9.6 |
6.9 |
1.6 |
|
Placid |
3.1 |
75.8 |
3.9 |
5.7 |
7.5 |
5.9 |
0.2 |
5.9 |
5.1 |
|
|
Restless |
16.2 |
0.4 |
45.1 |
6.9 |
18.7 |
8.5 |
16.7 |
3.7 |
2.5 |
|
|
Frustrated |
1.6 |
0.8 |
1.6 |
85.6 |
2.3 |
1.7 |
4.5 |
3.3 |
2.7 |
|
|
Angry |
7.4 |
0.6 |
6.9 |
8.5 |
51.7 |
1.2 |
16.3 |
6.7 |
2.2 |
|
|
Hateful |
2.2 |
0.3 |
7.5 |
5.9 |
3.1 |
71.4 |
2.1 |
1.1 |
1.4 |
|
|
Scared |
3.6 |
0.8 |
4.1 |
7.3 |
15.9 |
2.5 |
68.4 |
5.8 |
6.3 |
|
|
Sad |
1.1 |
1.4 |
2.6 |
8.4 |
6.1 |
3.7 |
3.1 |
55.2 |
2.9 |
|
|
Surprised |
2.1 |
3.3 |
5.9 |
1.5 |
2.8 |
2.3 |
5.5 |
1.2 |
69.7 |
Table 2. Online teaching quality evaluation results of different models
|
|
Traditional convolutional neural network model |
Model in this paper |
||||
|
Scene |
Fragment 1 |
Fragment 2 |
Fragment 3 |
Fragment 1 |
Fragment 2 |
Fragment 3 |
|
Teacher expression activity |
0.7182 |
0.5369 |
0.3427 |
0.7481 |
0.5347 |
0.3802 |
|
Student 1 Positive expression activity |
0.6427 |
0.4517 |
0.3915 |
0.6135 |
0.4158 |
0.3114 |
|
Student 1 Negative expression activity |
0.3629 |
0.5362 |
0.6428 |
0.3692 |
0.5036 |
0.6352 |
|
Student 2 Positive expression activity |
0.5104 |
0.4185 |
0.3416 |
0.5241 |
0.4253 |
0.2041 |
|
Student 2 Negative expression activity |
0.4362 |
0.5926 |
0.6351 |
0.4358 |
0.5917 |
0.7485 |
|
Student 3 Positive expression activity |
0.7845 |
0.5038 |
0.2847 |
0.7415 |
0.5362 |
0.2639 |
|
Student 3 Negative expression activity |
0.2635 |
0.4152 |
0.7162 |
0.2639 |
0.4857 |
0.7135 |
|
Emotional activity in the classroom |
0.6142 |
0.3957 |
0.158 |
0.7842 |
0.3629 |
0.1528 |
|
Teaching quality evaluation |
Good |
Good |
Average |
Excellent |
Good |
Average |
Table 3. Manual evaluation results of online teaching quality
|
Name of video |
Teacher’s emotion evaluation |
Student’s emotion evaluation |
Classroom emotion evaluation |
Evaluation of teaching effect |
|
Video 1 |
Fairly good |
Medium |
Good |
Medium |
|
Video 2 |
Medium |
Fairly good |
Excellent |
Good |
|
Video 3 |
Fairly good |
Fairly good |
Medium |
Medium |
Figure 6. Facial expression feature distribution
Figure 7. Comparison of average detection errors of face feature point positioning
The traditional convolutional neural network model and the model constructed in this paper are used for online teaching emotion evaluation experiment. In this paper, three real online teaching videos are selected and input into the trained models. Table 2 shows the online teaching quality evaluation results of different models.
After many tests and experiments, this paper sets the weight of teachers’ expression activity and students’ expression activity as 0.6 and 0.4, and the threshold values as 0.4 and 0.6. Table 3 shows the results of manual evaluation of online teaching quality, which provides a reference for the experiment.
It can be seen from Table 2 and Table 3 that the traditional convolutional neural network model and the model constructed in this paper distinguish that there are certain differences between the classroom emotional activity of teachers and students in the three video clips and the online classroom quality evaluation results, but the evaluation results of the model constructed in this paper are more consistent with the results of manual evaluation, reflecting that the actual effect of classroom emotional performance is relatively ideal. Due to the correction loss of the construction, the model avoids the negative impact of the label problem in the optimization process, while maintaining the compactness of the intra class distribution. Therefore, the model constructed has better performance in online teaching emotional evaluation, and has certain feasibility and application significance.
This paper studies the method of classroom video image emotion analysis for online teaching quality evaluation. First, the classroom video image emotion analysis task is divided into facial expression recognition task and facial feature point locating task, and multi task learning is carried out to achieve real-time switching between the two tasks for different types of input. The tag attention mechanism is proposed to deeply mine the key areas of the face in the classroom video image, so as to maintain the compactness of the distribution of the center sample of the classroom video image and its neighborhood samples in the feature space. Finally, based on the expression activity of teachers and students in the online classroom, the online classroom teaching emotion is analyzed, and the online teaching quality is evaluated from the side. The test accuracy comparison results between the model in this paper and the reference model are given through experiments, and the test accuracy confusion matrix of different models is given, which verifies the advantages of the model in high-quality facial expression feature extraction. The facial expression features generated by the model training in this paper are visualized, and the visualization results are given. The average detection error of eyes, nose, and two corners of mouth is selected as the performance evaluation index, and the average detection error of facial feature point location is compared, which verifies that the model in this paper has certain practicality in online classroom video image facial expression recognition. Finally, the evaluation results of online teaching quality of different models are presented.
This paper was supported by Humanities and Social Science Research Project of Hebei Education Department named Research on Intelligent Evaluation of Classroom Teaching in University Based on Multi-modal Emotion Recognition between Teachers and Students (Grant No.: SD2022041).
[1] Wang, P., Li, P., Cuntapay, M. C. (2022). Recognition of student emotions in classroom learning based on image processing. Traitement du Signal, 39(4): 1331-1337. https://doi.org/10.18280/ts.390426
[2] Liu, R., Kang, J., Wang, L., Fan, M. (2022). Exploring primary school students' academic emotions and learning achievement in an immersive virtual reality science classroom. In 2022 International Symposium on Educational Technology (ISET), Hong Kong, China, pp. 163-167. https://doi.org/10.1109/ISET55194.2022.00042
[3] Gold, B., Windscheid, J. (2020). Observing 360-degree classroom videos–Effects of video type on presence, emotions, workload, classroom observations, and ratings of teaching quality. Computers & Education, 156: 103960. https://doi.org/10.1016/j.compedu.2020.103960
[4] Delamarre, A., Lisetti, C., Buche, C. (2020). Modeling emotions for training in immersive simulations (metis): a cross-platform virtual classroom study. In 2020 IEEE International Symposium on Mixed and Augmented Reality Adjunct (ISMAR-Adjunct), Recife, Brazil, pp. 78-83. https://doi.org/10.1109/ISMAR-Adjunct51615.2020.00036
[5] Taladriz, C.C. (2019). Technology to empower relationships, interactions and emotions in the classroom. In 2019 IEEE Global Engineering Education Conference (EDUCON), Dubai, United Arab Emirates, pp. 1493-1498. https://doi.org/10.1109/EDUCON.2019.8725076
[6] Xia, Y., Yu, H., Wang, X., Jian, M., Wang, F.Y. (2021). Relation-aware facial expression recognition. IEEE Transactions on Cognitive and Developmental Systems, 14(3): 143-1154. https://doi.org/10.1109/TCDS.2021.3100131
[7] Li, S., Deng, W. (2020). Deep facial expression recognition: A survey. IEEE Transactions on Affective Computing, 13(3): 1195-1215. https://doi.org/10.1109/TAFFC.2020.2981446
[8] Wang, C., Xue, J., Lu, K., Yan, Y. (2021). Light attention embedding for facial expression recognition. IEEE Transactions on Circuits and Systems for Video Technology, 32(4): 1834-1847. https://doi.org/10.1109/TCSVT.2021.3083326
[9] Dang, V.T., Do, H.Q., Vu, V.V., Yoon, B. (2021). Facial expression recognition: A survey and its applications. In 2021 23rd International Conference on Advanced Communication Technology (ICACT), PyeongChang, Korea (South), pp. 359-367. https://doi.org/10.23919/ICACT51234.2021.9370369
[10] Guo, P., Song, C. (2022). Facial expression recognition with squeeze-and-excitation network. In 2022 7th International Conference on Intelligent Computing and Signal Processing (ICSP), Xi'an, China, pp. 962-967. https://doi.org/10.1109/ICSP54964.2022.9778358
[11] Kim, S., Nam, J., Ko, B. C. (2022). Facial expression recognition based on squeeze vision transformer. Sensors, 22(10): 3729. https://doi.org/10.3390/s22103729
[12] Huang, K.X., He, R.J., Yao, F., et al. (2022). Facial expression recognition for ood generation using risk extrapolation. In 2022 7th International Conference on Cloud Computing and Big Data Analytics (ICCCBDA), Chengdu, China, pp. 295-299. https://doi.org/10.1109/ICCCBDA55098.2022.9778906
[13] Xu, X., Tao, R., Feng, X., Zhu, M. (2022). A lightweight facial expression recognition network based on dense connections. In International Conference on Knowledge Management in Organizations, Hagen, Germany, pp. 347-359. https://doi.org/10.1007/978-3-031-07920-7_27
[14] Yang, C., Gong, W. (2022). Research on facial expression recognition based on improved inception network. Journal of Physics: Conference Series, 2171(1): 012013. https://doi.org/10.1088/1742-6596/2171/1/012013
[15] Li, M., Chen, L., Wu, M., Pedrycz, W., Hirota, K. (2022). Dynamic expression recognition-based quantitative evaluation of teaching validity using valence-arousal emotion space. In 2022 13th Asian Control Conference (ASCC), Jeju, Korea, pp. 1079-1083. https://doi.org/10.23919/ASCC56756.2022.9828302
[16] Zhang, S., Li, C. (2022). Research on feature fusion speech emotion recognition technology for smart teaching. Mobile Information Systems, 2022: 7785929. https://doi.org/10.1155/2022/7785929
[17] Wang, Y. (2022). Optimization of the music teaching management system based on emotion recognition. Computational Intelligence and Neuroscience, 2022: 4568041. https://doi.org/10.1155/2022/4568041
[18] Wang, X. (2022). Influences of learning emotion on learning outcome in online teaching mode. International Journal of Emerging Technologies in Learning, 17(8): 126-139. http://dx.doi.org/10.3991/ijet.v17i08.30459
[19] Li, L. (2022). Emotion analysis method of teaching evaluation texts based on deep learning in big data environment. Computational Intelligence and Neuroscience, 2022: 9909209. https://doi.org/10.1155/2022/9909209
[20] Wu, H., Huwan, T. (2022). Analysis of affective factors and optimization strategies of emotion in online teaching based on improved SVM model. Security and Communication Networks, 2022: 2334544. https://doi.org/10.1155/2022/2334544
[21] Li, Y., Shu, W. (2022). Wireless network access and emotion recognition of online english translation teaching system from the perspective of artificial intelligence. Wireless Communications and Mobile Computing, 2022: 1238932. https://doi.org/10.1155/2022/1238932
[22] Saxena, S., Tripathi, S., Sudarshan, T.S.B. (2022). An intelligent facial expression recognition system with emotion intensity classification. Cognitive Systems Research, 74: 39-52. https://doi.org/10.1016/j.cogsys.2022.04.001
[23] de Araujo, H.F., Nunes, F.L., Machado-Lima, A. (2022). The impact of different facial expression intensities on the performance of pre-trained emotion recognition models. In Proceedings of the 37th ACM/SIGAPP Symposium on Applied Computing, New York, United States, pp. 41-48. https://doi.org/10.1145/3477314.3507268