Irfan Kilic* | Galip Aydin
© 2022 IIETA. This article is published by IIETA and is licensed under the CC BY 4.0 license (http://creativecommons.org/licenses/by/4.0/).
OPEN ACCESS
Today, traffic lights are widely used in places with high vehicle traffic. Especially in autonomous vehicles, fast and high accuracy detection and recognition of traffic lights are critical. Machine learning methods are generally used to do this. Deep learning models give more successful results than machine learning methods in detecting the exact location of traffic lights in different climatic conditions. In this study, Faster R-CNN Inception v2 deep learning model was trained and tested on two different datasets that we prepared and published publicly under variable traffic and climatic conditions in Turkey. Successful results were obtained with fewer data by using the Transfer Learning method with the help of TensorFlow Object Detection API in the training of the model. It has been shown that the datasets we have prepared can be developed considering the conditions in other countries and successful results will be obtained.
traffic lights, deep learning, benchmark datasets, TensorFlow object detection API, object detection and recognition, Faster R-CNN
1.1 Background
With urbanization, heavy vehicle traffic occurs. Traffic signs and traffic lights provide important guidance to drivers and vehicles in the course of traffic. Along with high technology, autonomous vehicle systems are also developing. Multinational companies such as Alphabet and Tesla have autonomous cars, self-driving vehicles, etc. work is progressing rapidly. Traffic signs and lights play an important role in the decision-making processes of autonomous vehicles. Therefore, correct detection and recognition of traffic signs and lights are critical. Traffic lights are crucial to maintaining order in traffic.
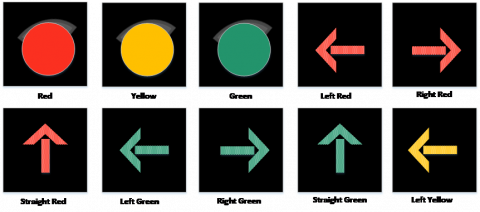
Figure 1. Traffic light types for TTLRv1
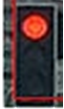
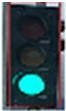
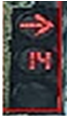
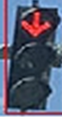
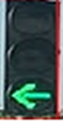
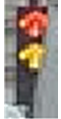
In this study, a web application and two different traffic light datasets specific to Turkey were prepared. For the Turkish Traffic Lights Dataset 1 (TTLRv1) designed in this study, there are ten types of traffic lights, as can be seen in Figure 1. These are respectively; red, yellow, green, left red, right red, straight red, left green, right green, straight green, and left yellow. In this dataset (TTLRv1), only the region with light is tagged. As can be seen in Figure 2 for the Turkish Traffic Lights Dataset 2 (TTLRv2), there are 13 types of traffic lights. These are respectively; red, yellow, green, left red, right red, straight red, red yellow, left green, right green, straight green, straight red yellow, left red yellow, and right red yellow. In the TTLRv2 Dataset, the entire region of the traffic light is tagged. Most of the datasets in the literature were prepared in this way.
Figure 2. Traffic light types for TTLRv2
1.2 Literature review
When the studies in the literature are examined; machine learning methods such as Adaptive Templates, Prior Map, HSI, SVM, and Segmentation in recognition of traffic lights and DBN, DBN+, CNN, YOLOv1,v2,v3, Faster R-CNN, and LeNet DNN, etc. It has been observed that deep learning methods are used. Three different approaches are seen in the studies.
(a) Only Machine Learning methods
(b) Deep Learning methods
(c) Combined use of Machine Learning and Deep Learning
BSLTD, LISA TLD, IARA TLD, hciLab Driving Dataset, DTLD, and TLR were used as a dataset. Classical machine learning methods and deep learning methods given in Table 1 were trained and tested using different image resolutions and datasets.
If we take a look at some studies that only use machine learning;
In the study conducted by De Charette and Nashashibi [1], a real-time traffic light recognition system was proposed for on-board camera applications. This recommendation has done well in urban videos. With this method, which is called "Adaptive Templates", it is possible to recognize different traffic lights in different countries. The method was performed in real time on 640x480 images [1]. The goal is to design a modular algorithm for Traffic Light Recognition (TLR) that can detect traffic lights in a dynamic urban environment. The layout of the TLR algorithm consists mainly of three steps, as shown in Figure 3. Adaptive templates are a very useful tool for easily identifying new traffic lights templates [1].
In the study by Fairfield and Urmson [2], using a priority map, a perception system estimates the locations of traffic lights. In this way, it has been observed that the detection of the light situation can be improved. The priority map can also encode control semantics of traffic lights. In this study, methods have been proposed for automatic mapping of the three-dimensional positions of traffic lights and for powerful detection of traffic light status in vehicles with cameras. With these methods, more than four thousand traffic lights are matched. In this way, built-in traffic light detection for thousands of drivers over intersection points has been made [2]. The traffic light types detected in the study are given in Figure 4.
Figure 3. TLR algorithm diagram [1]
Figure 4. General types of traffic lights [2]
Table 1. Summary of literature for traffic lights detection and recognition
|
Reference |
Year |
Model/Method NameNotes |
Dataset |
MetricsNotes |
|
De Charette and Nashashibi [1] |
2009 |
Adaptive Templates, TLR Algoritm |
- |
Pre: 0.9538 Rec: 0.9841 |
|
Fairfield and Urmson [2] |
2011 |
Prior Map |
Own Dataset |
Pre: 0.99 Rec: 0.62 |
|
Wang et al. [3] |
2011 |
Segmentation, HSI |
- |
Pre: 0.967, Rec: 0.923 |
|
Shi et al. [4] |
2016 |
AdaBSF [4], SVM |
TLR |
Pre: 0.922 Rec: 0.9469 |
|
Weber et al. [5] |
2016 |
DeepTLR |
- |
(640x480) Pre:0.856 Rec: 0.907 F1: 0.881 (1280x960) Pre:0.956 Rec:0.914 F1:0.935 |
|
Behrendt et al. [6] |
2017 |
YOLO, specified CNN |
BSLTD |
- |
|
Jensen et al. [7] |
2017 |
YOLOv1,v2,v3 |
LISA TLD |
AUC: 0.9049 |
|
Lee and Park [8] |
2017 |
LeNet DNN |
LISA TLD |
Pre: (green) 83.94, (red) 74.08 Rec: (green) 74.08, (red) 78.48 |
|
Pon et al. [9] |
2018 |
Faster R-CNN |
BSLTD |
Acc: 0.75, Rec: 0.70, AP: 0.54 |
|
Munoz-Organero et al. [10] |
2018 |
DBN, DBN+, GPS Sensör, KNN+SVM |
hciLab Driving Dataset |
Pre: 0.76 Rec: 0.69 |
|
Possatti et al. [11] |
2019 |
YOLOv3, Prior Maps |
DTLD [14], LISA TLD [6], IARA TLD |
(DTLD) Pre:88.59 Rec: 86.50 AP: 85.62 (LISA-TLD) Pre: 66.45 Rec: 54.82 AP: 50.59 (IARA-TLD) Pre: 69.53 Rec: 57.16 AP: 55.21 |
|
Carvalho Barbosa et al. [12] |
2020 |
PVIDNet |
COCO API, VOC, Google images, and IMAGINET |
Acc: 0.95 |
|
Che et al. [13] |
2020 |
SqueezeNet, YOLOv3 |
LARA |
Pre: 0.904 Rec: 0.897 |
|
Wang et al. [14] |
2022 |
CNN, ICFT |
BDD100K |
Pre: 0.853 Rec: 0.842 |
Notes: 1. TLR: Traffic Light Recognition. 2. AdaBSF: Adaptive Background Suppression Filter. 3. SVM: Support Vector Machine. 4. HSI: Hue, Saturation, Intensity. 5. ICFT: Integrated Channel Feature Tracking. 6. YOLO: You Only Look Once. 7. CNN: Convolutional Neural Network. 8. DNN: Deep Neural Network. 9. DBN: Deep Belief Network. 10. KNN: K Nearest Neighbor. 11. PVIDNet: Priority Vehicle Image Detection Network. 12. Pre: Precision. 13. Acc: Accuracy. 14. Rec: Recall. 15. AP: Average Precision. 16. AUC: Area Under Curve. 17. Acc: Accuracy
In the study conducted by Wang et al. [3], an automatic system for reliable and real-time detection and recognition of traffic lights on smart vehicles is proposed. The method, which applies image processing and pattern recognition theory, consists of three stages. First, the candidate regions of the traffic lights are extracted using the color threshold segmentation method. In the second stage, two types of filtering were applied to the candidate regions, which take into account noise removal and shape information. In the third step, pattern matching was used using normalized cross-correlation techniques to validate the traffic lights candidate. The results of the study indicate that the proposed method is an effective and robust method for traffic light recognition in dense urban environments [3].
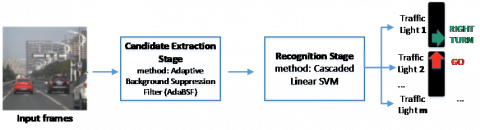
In the study by Shi et al. [4], a vision-based traffic light detection method, which provides fast and robust results for vehicles in different lighting conditions, was proposed. The proposed method consists of two stages. The first stage is the nomination stage, the second stage is the recognition stage. In the first step, an adaptive background suppression algorithm is proposed to foreground traffic light candidate regions and ignore unwanted backgrounds. In the second step, each candidate area is verified so that the different traffic lights are classified according to the appropriate classes. The results show that the proposed method can achieve a desired detection result with high quality and robustness at the same time. The detection system is able to meet the real-time processing requirement of about 15 fps in videos. As shown in Figure 5, AdaBSF was used for traffic light detection and SVM was used to recognize traffic light [4].
Figure 5. Recommended method for traffic light detection
If we take a look at some of the studies that use only deep learning and deep learning + machine learning methods;
DeepTLR, a camera-based system for real-time detection and classification of traffic lights, has been proposed for the detection and classification of traffic lights in the study by Weber et al. [5]. As deep convolutional networks are a powerful tool for visual object detection, a single deep CNN network in Deep TLR can detect traffic lights on the raw image without using temporal information, traffic light location, and pre-segmentation. It has been seen that DeepTLR can operate with appropriate frame rates for real-time applications by detecting light with a bounding box regression method.
Behrendt et al. [6] modified YOLO [14] to detect traffic light candidates. A special CNN was used for classification. In this study, a 3-stage system consisting of a traffic light detector, tracking and classifier based on stereo vision of traffic lights in real time and vehicle odometry is proposed. Three contributions were made at the end of the study. The first is a unique dataset called Bosch Small Traffic Lights Dataset (BSLTD) [15]. It features the largest publicly tagged traffic lights dataset at the time of study, and includes tags up to 1 pixel wide. The second is that it is a traffic light detector that can detect traffic lights as small as 4 pixels wide by operating at 10 frames per second in HD images. The third contribution is that it is a traffic light tracker that uses stereo vision and vehicle odometry to calculate the motion prediction of traffic lights and neural network. The general operation of the study is given in Figure 6.
Figure 6. Detector, tracer, classification line. The classifier works twice to filter out tracer entrainments and false positives [6]
In a detailed study on traffic light detection using YOLO by Jensen et al. [7], the YOLO real-time object detection system was applied to the public LISA Traffic Light dataset [16], which includes a high number of annotated traffic lights. The YOLO object detector achieved an impressive 90.49% AUC. Using exactly the same training configuration as the ACF detector, the YOLO detector achieved an AUC of 58.3%, an increase of 18.13% [7].
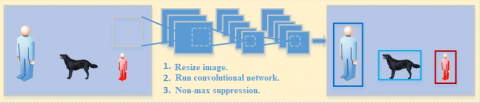
A new approach to object detection was presented in the YOLO study by Joseph Redmon et al. [17]. This study considers object detection as a regression problem to spatially separate the bounding boxes and associated class probabilities. A single neural network predicts bounding boxes and class probabilities in a box directly from full images. Since the entire detection pipeline is a single network, it can be optimized end-to-end in direct detection performance [14]. The unified architecture used in the study works very fast. The basic YOLO model processes images in real time at 45 frames per second. A smaller version of the network, Fast YOLO doubles the mAP of other real-time detectors, processing an astonishing 155 frames per second. Compared to state-of-the-art detection systems, YOLO makes more localization errors, but is less likely to predict false positives in the background. Finally, YOLO can learn very general representations of objects. It outperforms other detection methods, including DPM and R-CNN, when generalized from natural images to other areas such as imagery [14]. YOLO's object detection system is given in Figure 7. YOLO can also be used for traffic light detection. In another study using YOLO, vehicle classification and vehicle counting can also be performed [18].
Figure 7. YOLO object detection system [17]
In the study by Gwang–Gook Lee and Byung Kwan Park [8], a fast but less error-prone approach is proposed to overcome the errors of traditional traffic light detection methods. Although this approach is not suitable for detecting small objects, a Deep Neural Network is proposed that combines a very powerful classifier [8]. LISA traffic lights dataset was used for the proposed method [17].
With the study by Pon et al. [9], by changing some features of Faster R-CNN [19], traffic lights and traffic signs can be detected simultaneously. A deep hierarchical architecture is presented using a mini-batch selection mechanism that allows a network to detect both traffic lights and signs from training on separate traffic light and beacon datasets. The proposed method solves the overlap problem where samples in one dataset are not tagged in the other dataset. It is the first study to do common detection for traffic lights and signs. Tsinghua-Tencent 100K dataset was used for network traffic sign detection and Bosch Small Traffic Lights dataset was used for traffic light detection. When this study was done, it outperformed the state-of-the-art method with the Bosch Small Traffic Light dataset [15].
In the study by Munoz-Organero et al. [10], a new mechanism for the generation of street maps is presented that focuses on the automatic detection of street maps such as traffic lights, street crossings and intersections. In order to minimize system requirements and facilitate data collection by the user, only traces of GPS data taken from a mobile device while driving are used. Velocity and acceleration time series have been obtained from GPS data. A pinpoint detection algorithm was first used to detect abnormal driving positions. With the proposed algorithm, a combined recall of 0.89 and a combined precision of 0.88 for classification are obtained.
• Deep Belief Networks (DBN) and Mobile device GPS sensors are used.
• 2 different data sets were used. The first of these is a specially designed dataset created using the driving path. The other used a Real World Driving Dataset to Evaluate Driver Workload [20]. Dataset address: https://www.hcilab.org/automotive/
In this study, a new mechanism is presented that automatically detects road infrastructure based on the use of GPS sensor data while driving. The mechanism was validated using two different datasets [10].
In the study by Possatti et al. [11], it is stated that an additional solution is required for traffic light detection and recognition. In this study, state-of-the-art deep detectors were used to locate and recognize traffic lights from 2D camera images. This study proposes to integrate the power of deep learning-based detection with priority maps used by vehicle platforms IARA (short for Intelligent Autonomous Robotic Car) to recognize traffic lights of predefined routes [11]. DriveU Traffic Lights Dataset (DTLD) [21] and LISA Traffic Lights Dataset [16] were used as datasets.
In the study by Ren et al. [19], a District Recommender Network (RPN) is presented that provides site recommendations at almost no cost. An RPN is a fully unified network capable of simultaneously presenting object boundaries and objectivity scores at any position. The RPN is end-to-end trained to generate high-quality site recommendations that are used to be detected by Fast R-CNN. By combining RPN and Fast R-CNN in a single network at the same time, sharing their intertwined features, the advantages of the combined network with the "attention" mechanisms of RPN component neural networks are seen. For a very deep VGG-16 model, the detection system has a frame rate of 5 fps (all steps included) on a GPU, while the MS COCO dataset achieved cutting-edge object detection accuracy with only 300 recommendations per image in PASCAL VOC 2007, 2012. The general architecture of Faster R-CNN (Faster R-CNN) is given in Figure 8 [19].
Pre-trained deep learning models have been used in recent years. As this example; In the study conducted by Kilic and Aydin [22], traffic signs detection and recognition were performed using the COCO dataset and the Faster R-CNN Inception V2 model, which was pre-trained. A new data set was created for 43 different traffic signs with the study. This study formed the basis for traffic lights detection and recognition [22].
Figure 8. Faster R-CNN architect [19]
1.3 Motivation and contributions
When the existing studies and datasets in the literature are examined, it has been observed that different environmental conditions are not taken into account. This situation constitutes the primary motivation of the study. In addition, the image resolutions of the datasets used in the literature are low. It is thought that better results will be obtained on high-resolution images using Deep Learning. In this context, there is no known structured dataset specific to Turkey. For this purpose, images taken in different environments (open, closed, partly cloudy, and night) were collected for the dataset from 2 different perspectives. In the first view, only the physical boundaries of a traffic light are taken. In the second viewpoint, the physical boundaries of all traffic lights (3's) in the image are taken. The collected data were structured by taking the datasets used in the literature as criteria.
Since the work done today is easy to obtain high-resolution images, better results will be obtained on these images. It is expected to lead the subsequent studies and the preparation of new datasets specific to Turkey. The benefits of using APIs such as the TensorFlow Object Detection API will also be demonstrated. With the help of these APIs, an important application of Transfer Learning will be seen in this study and subsequent studies.
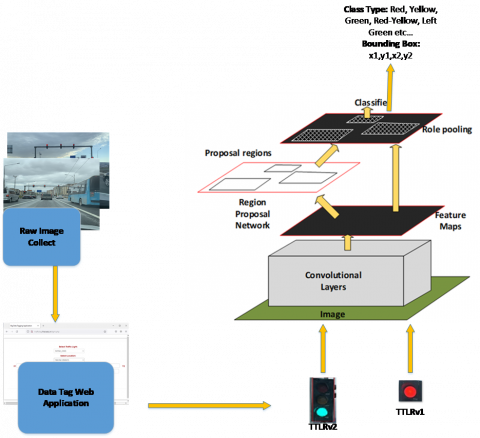
In this section, how the materials used were collected, what was done to prepare the dataset and the method used were explained.
2.1 Data collection
Images were obtained using an in-vehicle camera in live city traffic in different climatic conditions. For the dataset, the photos were taken at 4032×3024 pixels, and 3024x4032 resolutions on intercity and urban highways have been reduced to 1080×1440 and 1440×1080 resolutions, preserving the aspect ratio to meet the standards. In this way, approximately 600 images were prepared. Some images have 2, 3, 4 and 5 types of traffic lights. Therefore, there are more than 600 traffic lights on 600 images.
2.2 Dataset preparation
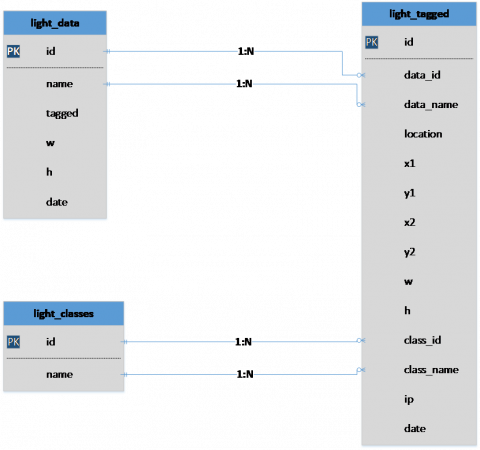
In order to prepare the dataset, the data must be tagged correctly. Therefore, a PHP–MySQL based web application was developed to tag our data [23]. To develop this web application, database design was done first. The UML diagram of the database is given in Figure 9.
According to the data we have, ten different traffic light types for TTLRv1 are given in Table 2. The 13 different traffic light types for TTLRv2 are shown in Table 3.
Figure 9. Traffic lights database UML diagram
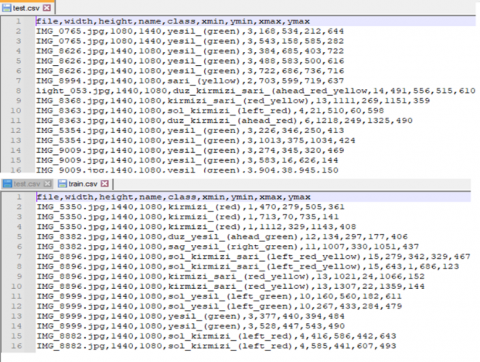
At this stage, preparing datasets for detection and recognition has been started by using data specific to Turkey for both detection and recognition. Traffic lights will be detected using the TensorFlow Object Detection API [24]. For the dataset, Turkey-specific datasets were prepared based on the LISA dataset [16]. A total of 784 traffic lights for the first dataset and 894 for the second dataset are tagged. After tagging, train.csv and test.csv files were obtained, as shown in Figure 10.
Figure 10. Train and test CSV file contents
The file refers to the name of the image file; width is the width of the image file, height is the height of the image file, class refers to the class type in the image file, (xmin, ymin, xmax, ymax) the box boundaries of the detected class.
These CSV files and the "label_map.pbtxt" file prepared according to the traffic light types in Table 2 and Table 3 are converted into "train.record" and "test.record" files for training the models. The generating datasets are made available for everyone to use [25, 26].
2.3 Method
The TensowFlow Object Detection API is an open-source application framework built on top of TensorFlow that makes it easy to build, train, and deploy object detection models. As of today, it works stable for TensorFlow 2.5 and TensorFlow 1.14 versions [24]. This study is based on the COCO dataset [27] and the pre-trained Faster R-CNN [19] Inception v2 model. This model works roughly as follows.
·The image is run on a CNN network to generate a Feature Map
·The activation map is run via a separate RPN network that outputs prominent boxes and regions
·Several FC layers are used for salient boxes and regions from the RPN network to obtain the object class and bounding box coordinates.
Table 2. Traffic light types by class numbers for TTLRv1 dataset
|
Class |
Name |
Number of image |
Sample image |
Class |
Name |
Number of image |
Sample image |
|
1 |
Red |
254 |
6 |
Yellow |
34 |
||
|
2 |
Green |
145 |
7 |
Left-Red |
61 |
||
|
3 |
Right-Red |
10 |
8 |
Straight –Red |
19 |
||
|
4 |
Left-Yellow |
9 |
9 |
Straight -Green |
23 |
||
|
5 |
Left-Green |
22 |
10 |
Right-Green |
15 |
Table 3. Traffic light types by class numbers for TTLRv2 dataset
|
Class |
Name |
Number of image |
Sample image |
Class |
Name |
Number of image |
Sample image |
|
1 |
Red |
279 |
8 |
Green |
174 |
||
|
2 |
Yellow |
25 |
9 |
Left-Red |
56 |
||
|
3 |
Right-Red |
13 |
10 |
Straight-Red |
14 |
||
|
4 |
Left-Green |
20 |
11 |
Straight-Green |
27 |
||
|
5 |
Right-Green |
15 |
12 |
Red-Yellow |
48 |
||
|
6 |
Left Red-Yellow |
14 |
13 |
Right Red-Yellow |
8 |
||
|
7 |
Straight Red-Yellow |
7 |
|
|
|
|
A general flow chart of the model and architecture we used is given in Figure 11. With this API, Transfer Learning is used, which removes the obligation to distribute the training data independently and similarly to the test data. Transfer Learning allows us to use results from previous learned data. It also helps us to achieve the desired result with fewer data [28].
The traffic lights recognition module consists of 2 stages. These are traffic light detection and recognition. TensorFlow Object Detection application API was used for this.
·The pre-trained model criterion was taken with the COCO dataset named "faster_rcnn_inception_v2_coco_2018_01_28" using this API.
·This model has been trained on 200,000 steps with the Turkey-specific datasets we have prepared.
·TTLRv1 dataset contains ten different types of traffic lights, TTLRv2 dataset contains 13 different types of traffic lights.
·With Dataset 1, 282 images were used for training and 60 for testing. With Dataset 2, 321 images were used for training and 80 for testing. Image resolutions are 1080x1440 and 1440x1080.
·Training for each model took six days due to the number of epochs and image size.
·Model is trained on Nvidia Geforce GTX 1080 Ti graphics card.
2.4 Performance metrics
Since this study is on object detection on the image, IoU, AP, and mAP metrics used for object detection are explained.
Figure 11. Our model diagram
2.4.1 Intersection Over Union (IoU), Average Precise (AP), and Mean Average Precise (mAP) for object detection
IoU is used to find the intersecting section between 2 bounding boxes. In this study, the box predicted by our model was used to find the intersection area of the ground truth we tagged in our datasets. The IoU formula is as follows (1):
$I o U=\frac{A o O}{A o U}$ (1)
where, AoO=Area of Overlap, AoU=Area of Union.
The IoU calculation is based on the Jaccard index, a statistical method used to measure the similarity and diversity of sample sets. It was developed by A.H. Murphy as the forecast verification [29]. In object detection, the average precision (AP) is calculated according to a specific IoU. In general, the average precision (AP) and the mean of the average precisions (mAP) are used in the same sense. The AP calculation according to the specific IoU is as follows (2) because the recall value is 1 for object detection.
$A P=\frac{1}{N} \sum_{i=1}^N P_i R_i$ (2)
where, N=Total predicted images, P=Precise, Ri=Recall, Ri=1 for object detection.
In object detection applications, mAP values, which are called the general average of average precision values, are used. Pascal VOC 2007 competition uses mAP calculation [29]. Basically, mAP is defined as the mean of Average Precision (AP) for each class. Pascal VOC uses an IoU threshold of 0.5 in calculating APs [30].
After 200,000 epoch training for the TTLRv1 dataset of the model;
·BoxClassifier Loss value=0.0009537.
·RPN Loss value is 0.0013.
·Total Loss value is 0.01364.
3.1 Performance results for TTLRv1 dataset
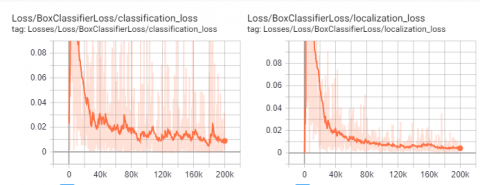
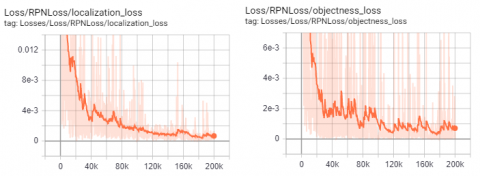
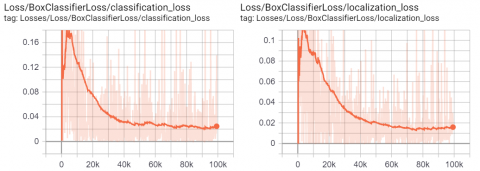
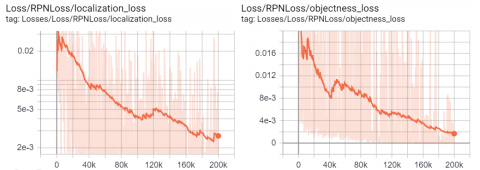
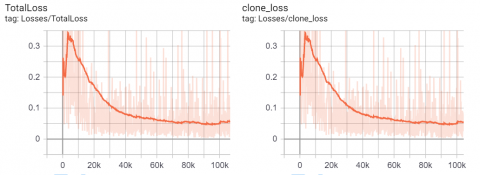
Bounding box and classification loss values during training for the TTLRv1 dataset are shown in Figures 12, 13, and 14 with the help of Tensorboard [31].
Figure 12. TTLRv1 dataset: Traffic Light Box Classifier Loss values (a) Classification (b) Positioning
Figure 13. TTLRv1 dataset: Traffic Light RPN Loss values (a) Positioning (b) Object detection
Figure 14. TTLRv1 dataset: Traffic light (a) Total loss (b) Clone loss
When we analyze the loss figures, it is seen that the loss values have reached the appropriate values for 200k epoch. The horizontal column in Tensorboard charts shows the epoch numbers. Loss value is shown in vertical column.
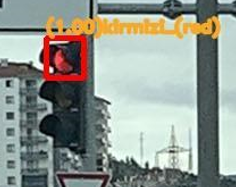
After training the model, the TTLRv1 dataset was tested on 60 test images. There are a total of 326 traffic lights tagged on 60 test images. The trained model detected all traffic lights. The minimum threshold value (IoU) is 0.4. The results according to different threshold values are given in Table 4.
When we examined Table 4, it is seen that the overlapping traffic lights are more than 65%. This is a state-of-art result. In object detection, 0.5 and 0.7 IoU values are generally accepted as references. In some studies, a value of 0.4 can also be taken as a criterion. Considering the results in the light of these, a state-of-the-art result greater than 87% was obtained for the 0.7 IoU value. Likewise, an extremely good result greater than 95% was obtained for the 0.5 IoU value, which was the most important criterion.
Table 4. Traffic lights and mAP values detected according to different threshold values (IoU) for TTLRv1 dataset
|
Threshold values (IoU) |
Detected Traffic Light |
Percent (%) (mAP) |
Precision (%) |
Recall |
F1 |
|
= 1.00 |
82 |
50.62 |
50.62 |
1 |
67.22 |
|
>= 0.99 |
100 |
61.73 |
61.73 |
1 |
76.34 |
|
>= 0.90 |
122 |
75.31 |
75.31 |
1 |
85.92 |
|
>= 0.80 |
134 |
82.72 |
82.72 |
1 |
90.54 |
|
>= 0.75 |
137 |
84.57 |
84.57 |
1 |
91.64 |
|
>= 0.70 |
143 |
88.27 |
88.27 |
1 |
93.77 |
|
>= 0.60 |
149 |
91.98 |
91.98 |
1 |
95.82 |
|
>= 0.50 |
154 |
95.06 |
95.06 |
1 |
97.47 |
|
>=0.40 |
162 |
100 |
100 |
1 |
1 |
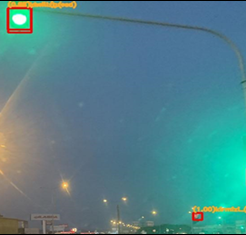
As can be seen in Table 5, successful results were obtained for different conditions and different traffic light types on the test images for the TTLRv1 dataset.
Table 5. Results on test images for TTLRv1 dataset
|
Test images |
|
|
Red light, single detection and recognition |
Red light, multiple detection and recognition, cloudy |
|
Straight red light, single detection and recognition |
Green and red light, night |
|
Green light, multiple detection and recognition, cloudy |
Green light, multiple detection and recognition, clear |
3.2 Performance results for TTLRv2 dataset
Bounding box and classification loss values during training for the TTLRv2 dataset are shown in Figures 15, 16, and 17 with the help of Tensorboard [31].
Figure 15. TTLRv2 dataset: Traffic Light Box Classifier Loss values (a) Classification (b) Positioning
Figure 16. TTLRv2 dataset: Traffic Light RPN Loss values (a) Positioning (b) Object detection
Figure 17. TTLRv2 dataset: Traffic Light (a) Total Loss (b) Clone Loss
TTLRv2 dataset was tested on 80 test images. There are a total of 162 traffic lights tagged on 80 test images. The trained model detected all traffic lights. The minimum threshold value (IoU) is 0.4. The results according to different threshold values are given in Table 6.
Table 6. Traffic lights and mAP values were detected according to different threshold values (IoU) for the TTLRv2 dataset
|
Threshold values (IoU) |
Detected traffic light |
Percent (%) (mAP) |
Precision (%) |
Recall |
F1 |
|
= 1.00 |
212 |
65.03 |
65.03 |
1 |
78.81 |
|
>= 0.99 |
230 |
70.55 |
70.55 |
1 |
82.73 |
|
>= 0.90 |
252 |
77.30 |
77.30 |
1 |
87.20 |
|
>= 0.80 |
262 |
80.37 |
80.37 |
1 |
89.12 |
|
>= 0.75 |
268 |
82.21 |
82.21 |
1 |
90.24 |
|
>= 0.70 |
284 |
87.12 |
87.12 |
1 |
93.12 |
|
>= 0.60 |
304 |
93.25 |
93.25 |
1 |
96.51 |
|
>= 0.50 |
310 |
95.09 |
95.09 |
1 |
97.48 |
|
>=0.40 |
326 |
100 |
100 |
1 |
100 |
In Table 6, it is seen that the overlapping traffic lights are more than 50%. Although this result is worse than the TTLRv1 dataset, it is sufficient. When we compared the results, a state-of-the-art result greater than 88% was obtained for the 0.7 IoU value. This result is better than the TTLRv1 dataset. Likewise, an outstanding result greater than 95% was obtained for the 0.5 IoU value, which was taken as the most criteria.
As can be seen in Table 7, successful results were obtained for different conditions and different traffic light types on the test images for the TTLRv2 dataset.
3.3 Discussion
F1 score is expected to decrease as the IoU value increases in object detection. As can be seen from the Table 4 and Table 6, the F1 score decreased as the IoU value increased. The important result here is that even with high IoU value, the F1 score does not decrease much.
Class by class accuracy results on test images as traffic light types for the TTLRv1 dataset and TTLRv2 dataset are given in Table 8. When the traffic light types in Table 2 and Table 3 are examined, the results for the red and green traffic light types are close to 100%. Because these two types are the most tagged for both datasets, according to these, the results for the less tagged left, right and straight {red, green} and red-yellow types are also at the desired level. Results for species that are tagged much less often are slightly below the desired level. In Figures 18 and 19, confusion matrices are given as types for both datasets. When the confusion matrices are examined, the results according to the tagging distribution for both datasets are as expected. It can be seen here that if enough tagging is done for all traffic light types, the desired results will be obtained. Although there is little tagging for certain traffic lights, the results are still good.
A comparison of similar studies with our study is given in Table 9.
Table 7. Results on test images for TTLRv2 dataset
|
Test images |
||
|
Left Red, Night |
Multiple Red light detection, Partly cloudy |
Red, Night |
|
Red light detection, Cloudy |
Multiple Left, Right, Solid Red light detection, Clear |
Red-yellow, partly cloudy |
Table 8. Class by class results on test images for TTLRv1 dataset and TTLRv2 dataset light types
|
TTLRv1 class by class results |
TTLRv2 class by class results |
||||
|
Class No |
Class name |
Accuracy (%) |
|
Class name |
Accuracy (%) |
|
1 |
Red |
100 |
1 |
Red |
96 |
|
2 |
Yellow |
62.5 |
2 |
Green |
92.68 |
|
3 |
Green |
100 |
3 |
Left Red |
85.71 |
|
4 |
Left Red |
94.44 |
4 |
Right Red |
66.66 |
|
5 |
Right Red |
100 |
5 |
Straight Red |
33.33 |
|
6 |
Straight Red |
100 |
6 |
Red Yellow |
90.9 |
|
7 |
Left Green |
100 |
7 |
Left Green |
60 |
|
8 |
Right Green |
83.33 |
8 |
Right Green |
100 |
|
9 |
Straight Green |
91.67 |
9 |
Straight Green |
40 |
|
10 |
Left Yellow |
100 |
10 |
Left Red Yellow |
66.66 |
Table 9. Comparison of test results
|
Reference |
Year |
Model |
Resolution |
Number of images |
mAP |
Recall |
|
Gupta and Choudhary [32] |
2019 |
Faster R-CNN GGDA |
1080x720 |
5.093 |
0.9500 |
- |
|
Shi et al. [4] |
2016 |
AdaBSF[4] |
1000x1000 |
7.958 |
0.922 |
0.9469 |
|
Wang et al. [18] |
2022 |
Specified CNN, ICFT [17] |
1280x720 |
44.932 |
0.853 |
0.842 |
|
Kulkarni et al. [33] |
2018 |
DTLD YOLOv3 [32] |
1280x960 |
54.476 |
0.8859 |
0.8650 |
|
Our Model (TTLRv1 dataset) |
1440x1080 |
342 |
0.9509 |
0.9748 |
||
|
Our Model (TTLRv2 dataset) |
1440x1080 |
401 |
0.9506 |
0.9747 |
||
Figure 18. Class by class confusion matrix for TTLRv1 dataset
Figure 19. Class by class confusion matrix for TTLRv2 dataset
As can be seen from Table 9, the test results we performed with our two datasets yielded good results compared to similar studies, although the training data is less than similar datasets. The most crucial factor here is the image resolution. The image resolution given as an input to the deep learning network is approximately 50% higher. In addition, these results were obtained without including different approaches such as GGDA, AdaBSF, ICFT, and DTLD used in similar studies.
With this study, two different traffic light datasets specific to Turkey were prepared. These datasets can be used as a reference in future studies. The TTLRv1 dataset, unlike the datasets in the literature, focused only on the light region that needs to be recognized. Successful results were obtained as a result of training the dataset prepared with this different perspective with TensorFlow Object Detection API. The TTLRv2 dataset was designed by considering the entire traffic light region as in the LISA dataset. The results from its training are state-of-the-art. In this study, it has been seen that different objects are successfully detected and recognized using the TensorFlow Object Detection API. In future studies, the dataset can be expanded by increasing the number of images for less traffic light types and in general. In addition, these datasets can be trained with new approaches using different object recognition models.
This study was supported by the DEGİRMEN Research and Development project, which was made in cooperation with the SSB and Fırat University [34]. Within the scope of this project, the traffic light detection and recognition module have been integrated into the DEGİRMEN web portal.
[1] De Charette, R., Nashashibi, F. (2009). Real time visual traffic lights recognition based on spot light detection and adaptive traffic lights templates. In 2009 IEEE Intelligent Vehicles Symposium, pp. 358-363. https://doi.org/10.1109/IVS.2009.5164304
[2] Fairfield, N., Urmson, C. (2011). Traffic light mapping and detection. In 2011 IEEE International Conference on Robotics and Automation, pp. 5421-5426. https://doi.org/10.1109/ICRA.2011.5980164
[3] Wang, C., Jin, T., Yang, M., Wang, B. (2011). Robust and real-time traffic lights recognition in complex urban environments. International Journal of Computational Intelligence Systems, 4(6): 1383-1390. https://doi.org/10.1080/18756891.2011.9727889
[4] Shi, Z., Zou, Z., Zhang, C. (2015). Real-time traffic light detection with adaptive background suppression filter. IEEE Transactions on Intelligent Transportation Systems, 17(3): 690-700. https://doi.org/10.1109/TITS.2015.2481459
[5] Weber, M., Wolf, P., Zöllner, J.M. (2016). DeepTLR: A single deep convolutional network for detection and classification of traffic lights. In 2016 IEEE intelligent vehicles symposium (IV), pp. 342-348. https://doi.org/10.1109/IVS.2016.7535408
[6] Behrendt, K., Novak, L., Botros, R. (2017). A deep learning approach to traffic lights: Detection, tracking, and classification. In 2017 IEEE International Conference on Robotics and Automation (ICRA), pp. 1370-1377. https://doi.org/10.1109/ICRA.2017.7989163
[7] Jensen, M.B., Nasrollahi, K., Moeslund, T.B. (2017). Evaluating state-of-the-art object detector on challenging traffic light data. In Proceedings of the IEEE Conference on Computer Vision and Pattern Recognition Workshops, pp. 9-15. https://doi.org/10.1109/CVPRW.2017.122
[8] Lee, G.G., Park, B.K. (2017). Traffic light recognition using deep neural networks. In 2017 IEEE International Conference on Consumer Electronics (ICCE), pp. 277-278. https://doi.org/10.1109/ICCE.2017.7889317
[9] Pon, A., Adrienko, O., Harakeh, A., Waslander, S.L. (2018). A hierarchical deep architecture and mini-batch selection method for joint traffic sign and light detection. In 2018 15th Conference on Computer and Robot Vision (CRV), pp. 102-109. https://doi.org/10.1109/CRV.2018.00024
[10] Munoz-Organero, M., Ruiz-Blaquez, R., Sánchez-Fernández, L. (2018). Automatic detection of traffic lights, street crossings and urban roundabouts combining outlier detection and deep learning classification techniques based on GPS traces while driving. Computers, Environment and Urban Systems, 68: 1-8. https://doi.org/10.1016/j.compenvurbsys.2017.09.005
[11] Possatti, L.C., Guidolini, R., Cardoso, V.B., Berriel, R.F., Paixão, T.M., Badue, C., De Souza, A.F., Oliveira-Santos, T. (2019). Traffic light recognition using deep learning and prior maps for autonomous cars. In 2019 International Joint Conference on Neural Networks (IJCNN), pp. 1-8. https://doi.org/10.1109/IJCNN.2019.8851927
[12] Carvalho Barbosa, R., Shoaib Ayub, M., Lopes Rosa, R., Zegarra Rodríguez, D., Wuttisittikulkij, L. (2020). Lightweight PVIDNet: A priority vehicles detection network model based on deep learning for intelligent traffic lights. Sensors, 20(21): 6218. https://doi.org/10.3390/s20216218
[13] Che, M., Che, M., Chao, Z., Cao, X. (2020). Traffic light recognition for real scenes based on image processing and deep learning. Computing & Informatics, 39(3). https://doi.org/10.31577/CAI_2020_3_439
[14] Wang, K., Tang, X., Zhao, S., Zhou, Y. (2022). Simultaneous detection and tracking using deep learning and integrated channel feature for ambint traffic light recognition. Journal of Ambient Intelligence and Humanized Computing, 13(1): 271-281. https://doi.org/10.1007/s12652-021-02900-y
[15] Bosch Small Traffic Lights Dataset, (n.d.). http://k0b.de/bstld, accessed on March 1, 2022.
[16] LISA Traffic Light Dataset, (n.d.). https://www.kaggle.com/datasets/mbornoe/lisa-traffic-light-dataset/download, accessed on March 1, 2022.
[17] Redmon, J., Divvala, S., Girshick, R., Farhadi, A. (2016). You only look once: Unified, real-time object detection. In Proceedings of the IEEE Conference on Computer Vision and Pattern Recognition, pp. 779-788. https://doi.org/10.1109/CVPR.2016.91
[18] Wu, J.D., Chen, B.Y., Shyr, W.J., Shih, F.Y. (2021). Vehicle classification and counting system using YOLO object detection technology. Traitement du Signal, 38(4): 1087-1093. https://doi.org/10.18280/ts.380419
[19] Ren, S., He, K., Girshick, R., Sun, J. (2015). Faster R-CNN: Towards real-time object detection with region proposal networks. Advances in Neural Information Processing Systems, 28. https://doi.org/10.1109/TPAMI.2016.2577031
[20] hciLab Driving Data Set, (n.d.). https://www.hcilab.org/automotive/, accessed on March 1, 2022.
[21] DriveU Traffic Lights Dataset, (n.d.). https://www.uni-ulm.de/in/iui-drive-u/projekte/driveu-traffic-light-dataset/, accessed on March 5, 2022.
[22] Kilic, I., Aydin, G. (2020). Traffic sign detection and recognition using tensorflow’s object detection API with a new benchmark dataset. In 2020 International Conference on Electrical Engineering (ICEE), pp. 1-5. https://doi.org/10.1109/ICEE49691.2020.9249914
[23] Traffic Lights Tagging Web Application, (n.d.). http://traffictag.firat.edu.tr/light.php, accessed on April 1, 2022.
[24] TensorFlow Object Detection API, (n.d.). https://tensorflow-object-detection-api-tutorial.readthedocs.io/en/latest/index.html, accessed on March 1, 2021.
[25] Traffic Lights Dataset Type 1, (n.d.). http://buyukveri.firat.edu.tr/wp-content/uploads/2020/09/traffic_lights_dataset_v1_type1.zip, accessed on April 1, 2022.
[26] Traffic Lights Dataset Type 2, (n.d.). http://buyukveri.firat.edu.tr/wp-content/uploads/2022/06/traffic_lights_dataset_type2.zip, accessed on April 1, 2022.
[27] COCO Dataset, (n.d.). https://cocodataset.org/#download, accessed on April 1, 2021.
[28] Tan, C., Sun, F., Kong, T., Zhang, W., Yang, C., Liu, C. (2018). A survey on deep transfer learning. in: Lect. Notes Comput. Sci. (Including Subser. Lect. Notes Artif. Intell. Lect. Notes Bioinformatics). https://doi.org/10.1007/978-3-030-01424-7_27
[29] Murphy, A.H. (1996). The Finley affair: A signal event in the history of forecast verification. Weather and Forecasting, 11(1): 3-20. https://doi.org/10.1175/1520-0434(1996)011<0003:TFAASE>2.0.CO;2
[30] Everingham, M., Van Gool, L., Williams, C.K., Winn, J., Zisserman, A. (2010). The pascal visual object classes (voc) challenge. International Journal of Computer Vision, 88(2): 303-338. https://doi.org/10.1007/s11263-009-0275-4
[31] Tensorboard, (n.d.). https://www.tensorflow.org/tensorboard, accessed on April 22, 2020.
[32] Gupta, A., Choudhary, A. (2019). A framework for traffic light detection and recognition using deep learning and grassmann manifolds. In 2019 IEEE Intelligent Vehicles Symposium (IV), pp. 600-605. https://doi.org/10.1109/IVS.2019.8814062
[33] Kulkarni, R., Dhavalikar, S., Bangar, S. (2018). Traffic light detection and recognition for self driving cars using deep learning. In 2018 Fourth International Conference on Computing Communication Control and Automation (ICCUBEA), pp. 1-4. https://doi.org/10.1109/ICCUBEA.2018.8697819
[34] DEGİRMEN R&D Project, (2021). https://degirmen.ssyz.org.tr, accessed on April 1, 2022.