Jian-Da Wu* | Hsing-Yueh Sun
© 2022 IIETA. This article is published by IIETA and is licensed under the CC BY 4.0 license (http://creativecommons.org/licenses/by/4.0/).
OPEN ACCESS
Biometrics used to identify people is one of the safest and most convenient identification methods. The hypoxic hemoglobin method can present a human finger vein image for driver identification through infrared ray irradiation. The finger vein image is captured system; with the finger vein image processed using contrast-limited adaptive histogram equalization (CLAHE) and the Gabor filter to obtain a clearer image. The YOLO object detection technology is used to drive identification. The proposed system can be divided into two parts. The first part is the training part, which processes images. A database generates the weight files for external testing. The second part is the testing system. When the driver's finger is placed in the designated photo area a photo will be taken. The photo will be processed and run on Raspberry Pi 4 together with the weight file to identify the driver. The experimental results show that when the database has a large amount of data, the yolov4-tiny-hy recognition rate is comparable to that of YOLOv4. The training time is greatly shortened.
biometrics, finger vein recognition, image processing, deep learning, YOLO object detection, driver identification
With the advancement of vehicle technology from the earliest days when every driver had to use a key to open the door and start the engine has evolved into a keyless system that has become increasingly common. Today most vehicles have no key jacks. However, biometric identification technology has gradually matured. The use of biological characteristics for personnel identification is one of the safest and most convenient identification methods. Everyone has unique biological characteristics. Biological characteristics can be divided into two kinds; physiological characteristics and behavioral characteristics. Physiological features mainly include the iris [1], fingerprints [2], palm prints [3], DNA [4], voice prints [5], face [6], finger veins [7]. Behavioral features include heartbeat, signature, walking posture, etc. Biometrics has unique, hard-to-change characteristics that have been widely used in personal identification systems. Finger veins are a relatively new biometric identification technology.
The difference between finger veins and fingerprints is that fingerprints exist outside the human body. If they are exposed to highly corrosive substances for a long time due to work or the environment, abnormal keratinization or separation of the stratum corneum caused by external skin irritation may occur. For patients with ichthyosis, the above conditions may not only cause the disappearance of fingerprints and palm prints, but even changes in the fingerprints and palm print images. However, the finger veins do not have the problem of image disappearance or image change because finger veins exist within the human body. The finger vein pattern is formed by DNA and finger development. Individual finger veins are unlikely to be the same. Even for twins, the DNA is not exactly the same. Because finger veins are not easy to forge and exist within the human body, they are not easily changed due to external environmental influences. Finger vein feature identification technology has become one of the safest identification methods.
Finger Vein Recognition was proposed by Miyuki et al. in 2002 in the first article on finger veins. The Fourier feature extraction method is used to extract finger vein features [8]. However, with the technology at that time, high-quality finger veins could not be obtained during the image acquisition process. In 2012, Han and Lee proposed using an adaptive Gabor filter to identify palm veins. That research used two Gabor filters with different parameters to merge and filter the image. This approach really improves the recognition accuracy. The combined Gabor filter requires the author to spend excess time in the palm vein recognition process [9]. At that time, finger vein recognition did not use deep learning methods for recognition like face recognition. In 2016, Gupta et al. [10] were the first to realize finger vein recognition through deep learning. They used a four-layer convolutional neural network to successfully increase the finger vein recognition success rate to 100%. Their 100% success rate at this time was the result of internal testing, not external testing. Real-time identification cannot be achieved. In 2019, Das et al. proposed a five-layer convolutional neural network [11]. The difference from Gupta’s work is that Das added the collected finger vein data to a public database to test and obtain a 95% accuracy rate. Using such a huge database for testing, finger vein identification required considerable time. In 2020, Titrek and Baykan [12] proposed two new features: Horizontal Total Proportion (HTP) and Vertical Total Proportion (VTP). Experimental results show that the proposed HTP and VTP features are effective and reliable for improving the classification success rate in the finger vein recognition problem. In 2020, Boucherit et al. [13] proposed a new method, multiple input convolutional neural networks of different qualities. Those networks were output into a single convolutional layer. The method they proposed is called "merged convolutional neural network". "In that research process, they used different convolution kernels and filters to find the most suitable model. After their research, when the convolution kernel is equal to 3 plus the CALHE filter, the effect is the best, reaching a maximum of 96% recognition rate.
In recent years, with the improvement in hardware computing capabilities and the rapid development of convolutional neural networks, good results have been achieved in the computer vision field [14], making it feasible for artificial intelligence and deep learning to perform related identification. At present, common object detection methods include R-CNN series [15, 16], SSD series [17, 18] and YOLO series [19-21]. The YOLO algorithm proposed by Redmon et al. in 2016 [19] is a neural network-like algorithm for object detection. The YOLO algorithm optimizes the model through continuous improvement. The model used in this study adopts the multi-scale anchor frame concept [22] to improve small object detection accuracy. An end-to-end network was used to output the object location and classification. This method is currently one of the fastest detection algorithms.
The references mentioned above used Fourier transform to extract the features at the earliest, but the image was not clear. Some people began to use the Gabor filter and CLAHE image processing method to enhance the finger vein image. Although this approach succeeded in achieving finger veins image clarity but the recognition time and recognition accuracy are still unsatisfactory. In order to solve the recognition accuracy problem, later generations proposed a method that added deep learning to solve the accuracy problem. The use of convolutional neural network operations has greatly improved the accuracy, but this approach is still unsatisfactory. Identity problems still take too long. This research uses the YOLO object detection technology introduced in recent years, combined with the Gabor filter and CLAHE image processing method to realize the finger vein recognition system for drivers.
2.1 Two-dimensional Gabor filter parameter explanation
The Gabor filter is a linear filter suitable for texture analysis. The mathematical calculation formula is expressed as:
$g_{\lambda, \theta, \varphi, \sigma, \gamma(x, y)}=e \frac{x^{\prime 2}+\gamma^2 y^{\prime 2}}{2 \sigma^2} \cos \left(2 \Pi \frac{x^{\prime}}{\lambda}+\varphi\right)$ (1)
where, $x^{\prime}=x \cos \theta+y \sin \theta, y^{\prime}=-x \sin \theta+y \cos \theta$.
The two-dimensional Gabor filter is obtained by multiplying a Gaussian function and a cosine function, where θ, φ, γ, λ, and σ are all independent variables; θ represents the direction of the parallel stripes in the Gabor filter. The effective value is a real number from 0 to 360 degrees. φ refers to the phase parameter of the cosine function, and the effective value is -180 degrees to 180 degrees. The waveform at the filter center point can be changed by changing the phase. Assuming that the filter center point is directly on the peak (φ=0), the image will be enhanced. Conversely, if the filter center point is facing the groove (φ=180), the effect will be weakened; γ this parameter determines the shape of the Gabor function. When γ=1, the shape is circular, when γ<1, the shape will be elongated along the θ direction; λ is the wavelength of the cosine function in the specified Gabor function, and the effective value should be greater than 2 and not greater than 1/5 of the input image size; σ represents the standard deviation of the Gaussian function in the Gabor function. The σ value cannot be set directly. Its value is mainly affected by bandwidth b and λ. The b value represents bandwidth. When actually setting the Gabor filter, it is usually set at the half-response spatial frequency bandwidth, that is, at the position of b/2 as shown in Eq. (2):
$b=\log _2 \frac{\frac{\sigma}{x} \pi+\sqrt{\frac{\ln 2}{2}}}{\frac{\sigma}{\lambda} \pi-\sqrt{\frac{\ln 2}{2}}}$ (2)
That the smaller the bandwidth, the larger the standard deviation, and the larger the wavelength produced.
2.2 Principle of contrast limited adaptive histogram equalization (CLAHE)
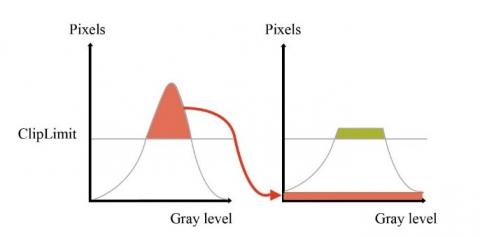
CALHE was changed from histogram equalization (HE) and adaptive histogram equalization (AHE). The HE used the image grayscale distribution histogram to find a mapping curve to change the image grayscale. This approach can increase the image contrast. The disadvantage of increasing the contrast globally is that the dark areas are darker and the bright areas are brighter. It will cause image distortion and cannot display features. However, AHE solves the regional contrast problem, and its principle is to divide the image into several squares and perform HE image processing on each square. This approach can better evenly distribute the gray values in the image. The disadvantage is that the contrast of the same area will be excessively enhanced and noise will be generated. In order to solve the AHE and HE shortcomings, CLAHE was developed. CLAHE has the effect of limiting contrast enhancement, enhancing images and reducing noise. A schematic diagram of the action is shown in Figure 1. In this study, the clip limit is set to 3 as the value to limit the contrast, and when the grayscale of a certain part of the image exceeds a set clip limit, it will be cropped. The cropped part will be re-grayscale and distributed to achieve a balanced image contrast and reduce noise.
Figure 1. Schematic diagram of CLAHE
2.3 Principle of deep learning
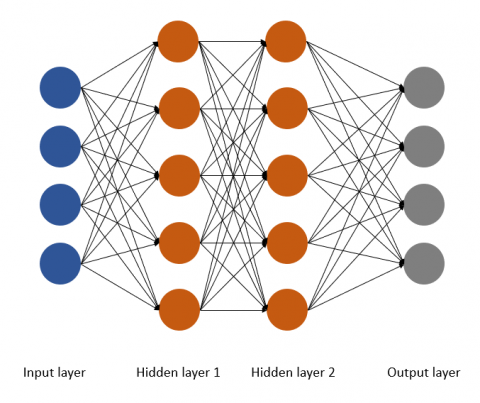
A neural network is formed by simulating the nerve conduction of organisms and connecting multiple layers of neurons. In the artificial neural network, each layer of neurons has input and output, and the activation function [22] is when the data is output from the neuron input through the linear activation function to the next neuron until the final output layer. The activation function makes the neural network have enough ability to capture complex features and improve the model effectiveness. The artificial neural network composition is shown in Figure 2. When input a 512*512 size picture, the input layer of the first layer has 262,144 neurons. After multiple hidden layers, it will finally output how many neurons according to the number of categories that need to be discriminated in the output layer. The depth of the model is determined by the number of hidden layers. It can be seen from the above that artificial neural networks have two main shortcomings. The first is that they require a large amount of memory. The second is that it is difficult to obtain the characteristics of each part of the object in the image because the input is judged by a single pixel. In image recognition, the artificial neural network accuracy is not accurate enough.
Figure 2. Principle of artificial neural network
2.4 YOLO object detection
The object detection technology is composed of three different algorithms: object localization, feature extraction and image classification. The YOLO object detection series was first proposed by Joseph Redom in 2015. YOLOv2 was launched in 2016 and YOLOv3 was launched in 2018. The fourth-generation YOLO series used in this study was launched in April 2020 and is currently the fastest and most accurate target detection algorithm in the world [23]. The YOLO object detection application can be seen from various fields such as traffic flow calculation, medical image analysis, face recognition, biometric recognition, defect detection, self-driving car etc. The YOLO target detection series uses the input photo as an object and output the bounding box, the probability and position of each category after being predicted by the CNN convolutional neural network system. In this way, the system can operate quickly and maintain good accuracy. The YOLOv4 network architecture diagram is shown in Figure 3. It can be seen from the figure that the YOLOv4 skeleton is mainly divided into four parts: CSP Darknet-53, SPP, PANet and Detection Head. The CSPDarknet-53 is composed of two architectures, Darknet-53 and cross stage partial network (CSPNet), and is used as the base network architecture.
Figure 3. Network architecture diagram of YOLO4
2.4.1 Introduction to the role of bounding box
YOLOv4 uses four output coordinates in the grid unit which are tx, ty, tw and th of the frame. Eqns. (3) to (6) calculate the offset value of the corresponding grid from the upper left corner of the bounding box relative to the center point. As shown in Figure 4, Cx and Cy are relative to the upper left corner. When tx and ty are calculated, the offset will be output. After adding the output offset to Cx and Cy, the center point border position will be obtained. The pw and ph of the dashed box in the figure are called the width and height of the preset box. After calculating with tw, th, pw and ph, the predicted width and height will be called bw and bh as shown in the solid line box.
$b_x=\sigma\left(t_x\right)+c_x$ (3)
$b_x=\sigma\left(t_x\right)+c_x$ (4)
$b_w=p_w e^{t_w}$ (5)
$b_h=p_h e^{t_h}$ (6)
Figure 4. Bounding box with size prior and position prediction
2.4.2 Introduction to the role of IOU
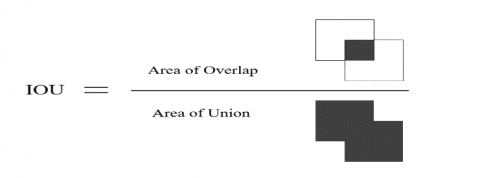
Intersection over union (IoU) is a criterion for detection accuracy. Many object detections use this standard as a reference for accuracy. In order for IoU to detect objects of any size and shape, a ground-truth bounding box and a predicted bounding box are required. The IoU calculation method is shown in Figure 5.
Figure 5. Schematic diagram of IoU calculation
The solid line is the real bounding box and the dashed line is the predicted bounding box. The real bounding box and predicted bounding box intersection divided by the real bounding box and predicted bounding box union, called IoU. When the IoU value is close to 1, it means that the predicted situation conforms more to a real situation.
2.5 Principle of proposed YOLOv4-tiny-hy
YOLOv4-tiny-hy is one of the main improvement points proposed in this study. This method is formed by rewriting the YOLOv4-tiny parameters, the YOLO-tiny series fast training time and the advantages of accurate recognition results of YOLO traditional series are combined. The difference between the YOLOv4-tiny-hy and other YOLO models is that the original YOLOv4 has 127 convolutional layers and the YOLOv4-tiny series has 38 layers. After testing and tuning, the YOLOv4-tiny-hy proposed in this study only retains 34 main convolutional layers. This approach reduces the training time by reducing the number of convolutional layers, but also increases the system speed. In addition, this study incorporates an angle function. The angle function is that when the image is input to the system for training during the training process, the system will automatically flip the photo at a random angle between the negative 60 angle and the positive 60 angle. The purpose of this is to improve the system target detection ability. By changing the image direction, the system must automatically find features and generate the finger vein position information from each input photo to output. In the past, among those open source models, the system just enters the photo and does not change the angle of the photo. In this way the system can only detect features in a single direction. YOLOv4-tiny-hy uses the changing the angle method to make the system's object detection ability more flexible instead of only identifying the same area.
In addition to the angle parameter, this study also added a random function. When random=0, the input image size will remain unchanged during training. When random=1, the random function will randomly change the input photo to 312*312~608*608 every ten iterations. Through the application of random functions, the images input to the system for training will not maintain the same size, so that the system must constantly adjust the position of the captured features for images of different sizes during the training process, and output the characteristic position. The main purpose of using the random function is to make the system adapt to images of various sizes by randomly scaling the image size, so that the system can recognize single sized images and also various sized images.
2.6 Confusion matrix
In this study the confusion matrix was used as a benchmark to evaluate the model quality. The confusion matrix contains four kinds of operation results: TP (True Positive), TN (True Negative), FP (False Positive), and FN (False Negative). First, TP is that the system can correctly predict success. For example, the model successfully identifies driver A in a picture of driver A's finger veins, which is called TP. Second, TN is a negative sample that correctly predicts success. For example, a picture of driver B's finger veins are identified as not driver A, which is called TN. Third, FP identifies driver A's finger vein photo as driver B. Finally driver A's finger veins were not identified as driver A, which is called FN.
According to the explanation in the previous paragraph, when the TP and TN values are larger, the model is better. The confusion matrix is shown in Table 1. However, it is impossible to clearly judge the quality of a model by looking only at these two values. The recall, precision and F1-score of the model will be used in this study to evaluate the model quality. After simple calculation, TP, TN, FP and FN can get a variety of different indicators. This study uses recall rate (RR), precision rate (PR), and F1-score. RR is the ratio of true positives to the total true positives and false negatives. PR is the ratio of true positives to the total true positives and false positives. F1-score is the ratio of double the product of precision rate and recall rate of the precision rat and recall rate. The PR, RR and F1-score calculation methods are shown in Eqns. (7, 8, 9).
$P R=\frac{T P}{T P+F P}$ (7)
$R R=\frac{T P}{T P+F N}$ (8)
$F_1- score =\frac{2 \cdot P R \cdot R R}{P R+R R}$ (9)
Table 1. Illustration of confusion matrix
|
|
True Condition |
||
|
Positive |
Negative |
||
|
Predicted Condition |
Positive |
TP |
FP |
|
Negative |
FN |
TN |
|
The development environment specification used in this research is indicated Tables 2 and 3. During training, the GTX 1060 graphics card is used as the system core during training to improve the system computing speed. A database is established for model training using seven different architectures. This research will eventually be applied to the car. The Raspberry pi 4 microprocessor with its small size and light weight has become the first choice for this research. The finger vein needs to be irradiated by near infrared rays and can be photographed through a night vision lens. The Raspberry pi NoIR Camera v2 was selected to photograph the finger vein in this study.
Table 2. The environment of training model and establishing database
|
OS |
Windows 10 |
|
CPU |
AMD R5 2600 Six-Core 3.4GHz |
|
GPU |
GeForce GTX1060 6G |
|
RAM |
16GB |
Table 3. The operating environment and equipment on Raspberry pi 4
|
OS |
Ubuntu 20.04 LTS |
|
CPU |
Quard-Core Cortex-A72 processor |
|
Memory |
4GB 128-bit LPDDR4 |
|
Camera |
Raspberry pi NoIR Camera V2 |
|
LED |
900nm IR LED |
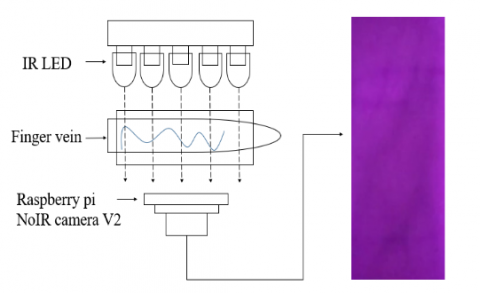
This research establishes a driver identification system. Six people were recruited to simulate driver identification. The experimental architecture is shown in Figure 6. The experimental architecture was designed using human hemoglobin characteristics that can absorb infrared rays using a night vision lens to shoot infrared rays. When the driver puts his finger between the infrared light and the night vision lens, the infrared light will irradiate the finger. At this time, the hemoglobin in the finger vein will absorb the infrared light to make the finger vein appear. Finally, the finger veins captured by the night vision lens and the trained YOLO weight file are run on the Raspberry pi 4 for identification.
Figure 6. Schematic diagram of the architecture for photographing finger veins
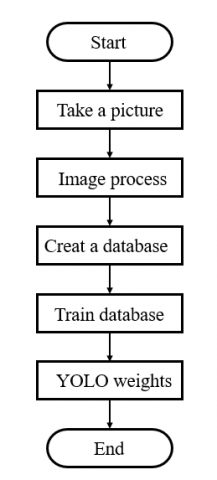
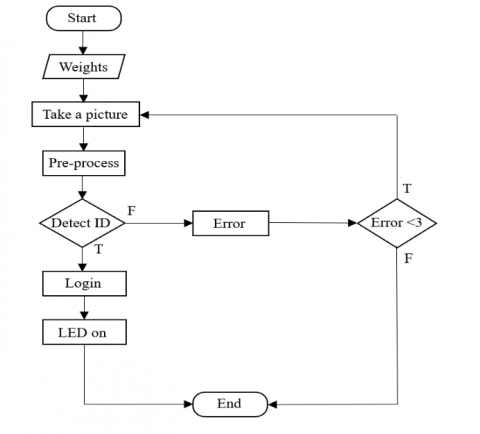
The system architecture in this study is divided into two parts. The first part is the training phase. The finger vein images captured by the night vision lens are used for image processing. After image processing, a database will be established. The content of the database includes the position coordinates of the finger vein bounding box in the picture and the category name to which it belongs. After YOLO training, the position information from the finger vein bounding box and the object category in the rectangular box can be obtained. The information will become the YOLO weight file needed for testing as shown in Figure 7. The second part is the testing phase. When the system is turned on, the weight file will be imported. After the finger is placed in the designated area, the night vision lens will be used to take an image of the finger vein and the image will be processed. After the image processing is completed, the image will be input to Yolo for identification. If the driver who has already established data in the database is judged, then “Login” will be displayed and the LED will be on. If the driver identification result is not in the database will display "Error" and enter the next judgment stage. If the error is less than three times, the system will return to the photographing stage to perform image preprocessing and identity recognition again. On the contrary, it will be judged as an error and the system will be shut down as shown in Figure 8.
Figure 7. System architecture of training part
Figure 8. System architecture of test part
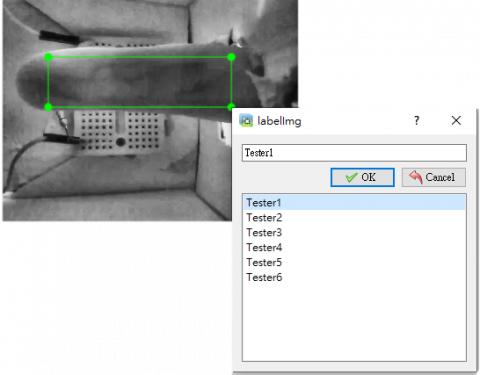
The finger vein images of six drivers obtained from the night vision lens are shown in Figure 9. After CLAHE image processing, the label-image is used to select a rectangular box for the finger vein in the image and marks the category to which the finger vein belongs. Finally, a text file containing the category name and object coordinates will be output. Frame the photo as shown in Figure 10.
This study uses a total of 12,000 photos to build the finger vein database. Each category has 2,000 training and 200 testing photos, and a total of 1,200 photos are used for external testing. The 12,000 iterations were used for model training in this study. Too much iteration may cause the system to over fit. The number of iterations should be determined by the training classes*2,000. The system generates a weight file at every 1,000 iterations. The weight file contains the feature position and recognition rate by the system in this iterative calculation. Different numbers of iterations will produce different accuracy rates as shown in Table 4.
Figure 9. Finger vein images of six drivers
Deep learning networks see images differently than the human eye. It is impossible to use the human eye to determine which filter is more suitable for realizing the driver’s finger vein recognition system. This study used the original image, gabor filter and CLAHE image processing methods mentioned which were mentioned the introduction to test. The results of using the above three methods to identify six different drivers are shown in Table 5. It can be seen that the CALHE image processing method is the most effective in this study.
In this study, in order to find out the relationship between the number of samples and the accuracy, the number of iterations was set to classes*2,000 as suggested by the original author of Yolov4. It can be found from Table 6 that when the number of samples is reduced, the accuracy rate will also decrease slightly. It can also be found from Table 6 that the accuracy of YOLOv4 and YOLOv3 can still exceed 80% when the number of samples is reduced to only 100 pictures. The reason is that YOLOv4 and YOLOv3 have more convolutional layers than YOLOv4-tiny-hy under the same conditions. Through multi-convolutional layers, the system can capture more features and improve the recognition rate. However, the disadvantage is that it takes a lot of time to train. In order to reduce the training time, YOLOv4-tiny-hy uses fewer convolutional layers for training, so with a small number of samples the features captured by YOLOv4-tiny-hy will be relatively less and the accuracy rate will be lower. However, it can be found that when the number of samples is also 2000, the accuracy of YOLOv4-tiny-hy is almost as high as of YOLOv3 and YOLOv4. From the test results of each model in Table 7, it can be found that YOLOv4-tiny-hy only takes 2.3 hours to train because of the reduction in number of convolutional layers, but YOLOv3 and YOLOv4 take longer.
Figure 10. Frame the finger veins with labelimage
Table 4. mAP of each iteration
|
|
Yolov3 |
Yolov3-tiny |
Yolov3-tiny-3L |
Yolov4 |
Yolov4-tiny |
Yolov4-tiny-3L |
Yolov4-tiny-hy |
|
iteration |
mAP (%) |
||||||
|
1000 |
96.95 |
34.64 |
86.23 |
99.93 |
43.62 |
69.18 |
36.99 |
|
2000 |
98.63 |
95.18 |
99.93 |
100 |
87.23 |
89.42 |
99.82 |
|
3000 |
99.76 |
99.99 |
99.95 |
100 |
90.14 |
94.67 |
99.32 |
|
4000 |
100 |
100 |
100 |
100 |
96.20 |
87.74 |
76.49 |
|
5000 |
100 |
100 |
77.35 |
100 |
95.02 |
91.16 |
69.50 |
|
6000 |
100 |
99.32 |
90.53 |
100 |
94.89 |
89.58 |
91.58 |
|
7000 |
100 |
100 |
100 |
100 |
92.73 |
92.20 |
86.32 |
|
8000 |
100 |
99.87 |
99.23 |
100 |
94.59 |
90.48 |
99.27 |
|
9000 |
100 |
100 |
100 |
100 |
96.28 |
91.71 |
90.02 |
|
10000 |
100 |
99.99 |
100 |
100 |
97.38 |
90.34 |
98.94 |
|
11000 |
100 |
100 |
100 |
100 |
95.03 |
88.76 |
96.81 |
|
12000 |
100 |
99.99 |
100 |
100 |
97.33 |
96.04 |
99.87 |
Table 5. Test results of original, Gabor filter, and CLAHE on yolov4-tiny-hy
|
|
Tester1 |
Tester2 |
Tester3 |
Tester4 |
Tester5 |
Tester6 |
|
Original |
94% |
96.8% |
93% |
96.8% |
95.76% |
96.58% |
|
Gabor filter |
95% |
97% |
94.4% |
97% |
98.6% |
97.75% |
|
CLAHE |
99.84% |
98.8% |
97% |
98% |
99.56% |
98.89% |
Table 6. Accuracy of different sample sizes on different YOLO models
|
|
Yolov3 |
Yolov3-tiny |
Yolov3-tiny-3L |
Yolov4 |
Yolov4-tiny |
Yolov4-tiny-3L |
Yolov4-tiny-hy |
|
Samples |
mAP (%) |
||||||
|
100 |
84.65 |
59.04 |
57.25 |
86.15 |
63.14 |
59.23 |
64.35 |
|
200 |
88.78 |
61.47 |
65.29 |
89.53 |
71.43 |
69.39 |
70.24 |
|
300 |
90.84 |
66.94 |
67.70 |
93.78 |
78.74 |
75.28 |
76.08 |
|
400 |
96.84 |
70.99 |
70.05 |
95.59 |
85.92 |
87.01 |
83.71 |
|
500 |
98.04 |
78.52 |
75.99 |
99.04 |
88.18 |
89.01 |
98.94 |
|
1000 |
99.98 |
80.90 |
85.24 |
100 |
96.66 |
94.40 |
99.56 |
|
2000 |
100 |
85 |
87.72 |
100 |
97.33 |
96.04 |
99.87 |
Table 7. Test results of each model
|
|
Yolov3 |
Yolov3-tiny |
Yolov3-tiny-3L |
Yolov4 |
Yolov4-tiny |
Yolov4-tiny-3L |
Yolov4-tiny-hy |
|
TP |
1200 |
1200 |
1180 |
1199 |
1199 |
986 |
1192 |
|
FP |
7 |
267 |
304 |
526 |
526 |
608 |
243 |
|
FN |
0 |
0 |
20 |
1 |
1 |
214 |
8 |
|
IOU (%) |
82.36 |
79.06 |
65.17 |
85.87 |
49.10 |
63.94 |
69.94 |
|
mAP (%) |
100 |
85 |
87.72 |
100 |
97.33 |
97.14 |
99.87 |
|
Detectiontime (s) |
95 |
10 |
9 |
93 |
8 |
10 |
5 |
|
Train time (hr) |
14.5 |
4.85 |
4.5 |
17.87 |
4 |
6.63 |
2.3 |
In this study, a driver recognition system using finger vein and YOLO object detection is proposed. In the proposed system, in order to increase the training speed, six different models are trained and compared in the experimental work, include YOLO3, YOLO3-tiny, YOLOv3-tiny-3L, YOLOv4, YOLOv4-tiny and YOLOv4-tiny_3L. After training and running on Raspberry Pi 4, the best driver finger vein recognition system model is found, and the recognition results show that the yolov4-tiny algorithm is the fastest model, and the recognition effect is very good, as shown in Table 7. Therefore, some parameters of YOLOv4-tiny in this study were rewritten to construct YOLOv4-tiny-hy. It can be seen in Table 7, that under the same conditions with seven different model architectures, the YOLOv3 and YOLOv4 model recognition effect is the best, but the disadvantage of both models is that recognition and training time take too long. The purpose of this study is to improve the training and recognition speed, so YOLOv3 and YOLOv4 are less suitable for real-time driver recognition systems. YOLOv4-tiny-hy shows fast training and recognition time, and the accuracy is also comparable to YOLOv3 and YOLOv4. In addition to the discussion in the previous chapter, it indicates that YOLOv4-tiny-hy is more suitable for applications with a large number of samples. YOLOv4-tiny-hy quickly establishes a database and real-time identification. On the contrary, YOLOv3 and YOLOv4 application is more suitable for a small number of samples where real-time identification is not required.
The study was supported by the Ministry of Science and Technology of Taiwan, Republic of China, under project number MOST 111-2221-E-018-008.
[1] Mashudi, N.A., Nordin, M.J. (2018). A review on iris recognition in non-cooperative environment. Proceedings of the 2018 International Conference on Information Science and System, pp. 127-132. https://doi.org/10.1145/3209914.3209925
[2] Lucio-Gutierrez, J.R., Coello, J., Maspoch, S. (2011). Application of near infrared spectral fingerprinting and pattern recognition techniques for fast identification of Eleutherococcus senticosus. Food Research Internal, 44(2): 557-565. https://doi.org/10.1016/j.foodres.2010.11.037
[3] Laadjel, M., Bouridane, A., Kurugollu, F., Boussakta, S. (2008). Palmprint recognition using Fisher-Gabor feature extraction. 2008 IEEE International Conference on Acoustics, Speech and Signal Processing, pp. 1709-1712. https://doi.org/10.1109/ICASSP.2008.4517958
[4] Sudha, T., Jayalaitha, G. (2021). Analysis of fuzzy logic and fractals in DNA sequences based on human signature. Materials Today: Proceedings. https://doi.org/10.1016/j.matpr.2020.12.427
[5] Ravanelli, M., Omologo, M. (2018). Automatic context window composition for distant speech recognition. Speech Communication, 101: 34-44. https://doi.org/10.1016/j.specom.2018.05.001
[6] Wang, Y., Tang, Y.Y., Li, L. (2016). Correntropy matching pursuit with application to robust digit and face recognition. IEEE Transactions on Cybernetics, 47(6): 1354-1366. https://doi.org/10.1109/TCYB.2016.2544852
[7] Yang, J.F., Shi, Y., Yang, J. (2011). Personal identification based on finger-vein features. Computers in Human Behavior, 27(5): 1565-1570. https://doi.org/10.1016/j.chb.2010.10.029
[8] Miyuki, K., Hironor, U., Shin-ichiro, U. (2002). Near-infrared finger vein patterns for personal identification. Journal of Applied Optics, 42(35): 7429-7436. https://doi.org/10.1364/AO.41.007429
[9] Han, W.Y., Lee, J.C. (2012). Palm vein recognition using adaptive Gabor filter. Expert Systems with Applications, 37(18): 13225-13234. https://doi.org/10.1016/j.eswa.2012.05.079
[10] Gupta, P., Srivastava, S., Gupta, P. (2016). An accurate infrared hand geometry and vein pattern based authentication system. Knowledge-Based Systems, 103: 143-155. https://doi.org/10.1016/j.knosys.2016.04.008
[11] Das, R., Piciucco, E., Maiorana, E., Campisi, P. (2018). Convolutional neural network for finger-vein-based biometric identification. IEEE Transactions on Information Forensics and Security, 14(2): 360-373. https://doi.org/10.23919/ELECO47770.2019.8990612
[12] Titrek, F., Baykan, O.K. (2020). Finger vein recognition by combining anisotropic diffusion and a new feature extraction method. Traitement du Signal, 37(3): 433-441. https://doi.org/10.18280/ts.370310
[13] Boucherit, I., Zmirli, M.O., Hentabli, H., Rosdi, B.A. (2020). Finger vein identification using deeply-fused Convolutional Neural Network. Journal of King Saud University - Computer and Information Sciences. https://doi.org/10.1016/j.jksuci.2020.04.002
[14] LeCun, Y., Bottou, L., Bengio, Y., Haffner, P. (1998). Gradient-based learning applied to document recognition. Proceedings of the IEEE, 86(11): 2278-2324. https://doi.org/10.1109/9780470544976.ch9
[15] Girshick, R., Donahue, J., Darrell, T., Malik, J. (2014). Rich feature hierarchies for accurate object detection and semantic segmentation. In Proceedings of the IEEE Conference on Computer Vision and Pattern Recognition, pp. 580-587. https://doi.org/10.18127/j00338486-202109-11
[16] He, K., Gkioxari, G., Dollár, P., Girshick, R. (2018). Mask R-CNN. In Proceedings of the IEEE International Conference on Computer Vision. https://arxiv.org/abs/1703.06870
[17] Liu, W., Anguelov, D., Erhan, D., Szegedy, C., Reed, S., Fu, C.Y., Berg, A.C. (2016). SSD: Single shot multibox detector. In European conference on computer vision and Pattern Recognition. https://arxiv.org/abs/1512.02325.
[18] Fu, C.Y., Liu, W., Ranga, A., Tyagi, A., Berg, A.C. (2017). Dssd: Deconvolutional single shot detector. arXiv preprint arXiv:1701.06659. https://arxiv.org/abs/1701.06659.
[19] Redmon, J., Divvala, S., Girshick, R., Farhadi, A. (2016). You only look once: Unified, real-time object detection. In Proceedings of the IEEE Conference on Computer Vision and Pattern Recognition, pp. 779-788. https://doi.org/10.1109/CVPR.2016.91
[20] Redmon, J., Farhadi, A. (2017). YOLO9000: Better, faster, stronger. In Proceedings of the IEEE Conference on Computer Vision and Pattern Recognition, pp. 7263-7271. https://doi.org/10.1109/CVPR.2017.690
[21] Redmon, J., Farhadi, A. (2018). Yolov3: An incremental improvement. arXiv preprint arXiv:1804.02767. https://arxiv.org/abs/1804.02767.
[22] Chen, X., Zhang, X., Yang, Y., Sun, P. (2008). Research for adaptive audio information hiding approach based on DWT. The 2008 Chinese Control and Decision Conference, pp. 3029-3033. https://doi.org/10.1109/CCDC.2008.4597882
[23] Bochkovskiy, A., Wang, C.Y., Liao, H.Y.M. (2020). YOLOv4: Optimal speed and accuracy of object detection. arXiv:2004.10934. https://arxiv.org/abs/2004.10934.