Yusuf Sevim
© 2022 IIETA. This article is published by IIETA and is licensed under the CC BY 4.0 license (http://creativecommons.org/licenses/by/4.0/).
OPEN ACCESS
Surface Electromyography (sEMG) is an important tool for gesture recognition. Features and classification methods have to be carefully selected to be successful in the recognition of electromyografic signals. In most of the sEMG studies, time and frequency domain features have been extracted and classified with a single classifier. But neither one feature nor one classifier alone has achieved high classification accuracies. Using a feature and classifier combination would be a solution for this problem, and increase the accuracies. As a contribution to this field, a new time domain EMG feature is suggested and its classification performance is examined for feature and classifier combinations in this study. According to the results of this study, the new feature has high classification accuracy, and when it is used with AR and ST features, the average of the classification accuracy reaches 99.57% for multiple SVM classifier. Besides, the new feature+AR+ ST feature combination shows high classification accuracy for single classifier, and this eliminates the need for multiple classifiers.
AR coefficients, classification, feature extraction, ST transform, wavelet transform
EMG signal, which is created by the electrical activity of the muscle fibres, is an important physiological signal used as diagnostic tool and control signal [1, 2]. In order to increase accuracies of diagnostic and control processes on EMG signals, effective data pre-processing, feature extraction should be applied, and a robust classification method should be carefully selected [3]. Among them, feature extraction has a critical role to extract useful information, eliminate the unwanted EMG parts. So far, plenty of feature extraction techniques have been developed in the time, frequency, and time-frequency domains [4-6], and investigated on numerous specific EMG signals [3, 7-9].
Mean value and variance are the most well-known time-domain features and are extracted without any transformation. Besides, mean absolute value (MAV), slope sign changes (SSC), number of zero-crossing (ZC), waveform length (WL), and autoregression coefficients (AR) are widely used as time-domain features [6]. The reasons for extracting features in time-domain are that they are quick to calculate and easy to implement. But they are noise sensitive, and preprocessing or filtering should be applied.
Fourier transform (FT) is used to transform the time domain EMG signal into a frequency domain signal, and some power spectrum characteristics of the transformed signal are used as frequency domain features [10]. The most commonly used features in the frequency domain are mean frequency (MNF), mean power (MNP), power spectrum ratio (PSR), variance of central frequency (VCF), and mean peak frequency (PKF). The main advantages of these features are to overcome noise and extract stable characteristic indexes. Nevertheless, the main problem of FT is that the transformed signal loses time-domain information and do not contain information about the occurance time of a particular event. As a solution to this problem, time-frequency domain methods short-time Fourier transform (STFT), Wavelet transform (WT), and S-Transform (ST) would be employed for feature extraction. Nevertheless, STFT has limited time-domain information [11]. On the other hand, WT helps to find data aspects that STFT misses, and can also de-noise or compress a signal. The main difference between STFT and WT is their way of partitioning the timescale axis [4, 5]. In addition to these transformations, ST, which is a hybrid of STFT and WT, is a very suitable method for processing nonstationary signals as well as de-noising and eliminating artifacts [12].
The selection of an appropriate classification algorithm can also increase the accuracies of diagnostic processes. As classification methods, statistical methods [13], artificial neural networks (ANN) [1], fuzzy approaches (FL) [14], Bayesian techniques [15, 16], k-nearest neighbor (k-NN) [17], linear discrimination analysis (LDA) [18] and support vector machines (SVM) have been used [15, 19]. In addition to these methods, the convolutional neural network algorithm (CNN) has been also applied in EMG signal classification [20, 21]. Besides, the transient effect of the EMG signal may occur due to electrode position, fatigue, or sweat. This can cause large variations in the value of a particular feature. It is quite difficult to deal with such a variable model for a classifier. In the literature, many different methods resort to the use of multiple algorithms to solve this problem [22-25].
As a contribution, a new feature extraction method based on time-domain features is developed in this study, and accuracy of it is investigated for single and multiple classifiers. Unlike the studies in the literature, this study utilizes multiple classification method that does not have a statistical structure. For the assessment of the findings, two different features derived from sEMG signals were analyzed using LDA, SVM, and k-NN. Selected features were AR coefficients, and ST features. The reason for choosing these features is that they have the highest classification accuracies. The classification results of AR, ST and the new feature were compared to see if the new feature could be useful in EMG signal processing. In addition, the features were combined to achieve high classification accuracy.
The rest of this paper is organized as follows. In the section II, materials and methods are introduced. Section III presents methodology used for classification. Section IV provides results and discussion with respect to classification accuracies. In addition, classification correctness is investigated to show the validity of new feature. Finally, conclusions are given in section V.
2.1 Database
In this section, the used sEMG database (CapgMyo) is described, which includes sEMG data of 23 intact subjects [26, 27]. The database was recorded using 8 acquisition modules, and each module has 16 differential electrodes. Each gesture was repeated 10 times and held between 3s and 10s. There are three acquisition procedures for CapgMyo database, and as a result of these procedures, the database consists of three sub-databases (DB-a, DB-b, and DB-c). While DB-a database has 8 hand gestures of 18 subjects which can be seen in Table 1, DB-b has 8 hand gestures of 10 subjects. DB-c has 12 hand gestures of 10 subjects and was held for 3s. As a pre-processing process, 45-55Hz bandstop filter was applied to eliminate power line interference.
2.2 Feature extraction methods
The feature extraction process was carried out on segmented data. A sliding window method was used for the segmentation. After trying different window lengths and increments, it is found that 250ms window length and 64ms increment gave the best classification results. AR, ST methods, which are frequently used in the literature and have high score values, and the new feature extraction method were employed to extract features from each segment of the data. The detailed explanations of the feature extraction methods are presented in the sub-sections below.
2.2.1 AR Features
The AR features are most popular EMG features [3], and uses a linear combination of the previous samples $X_{i-p}$ and a white noise error term $w_i$ to describe each sample of the EMG signal as follows
$X_i=\frac{1}{N} \sum_{m=1}^p a_m X_{i-m}+w_i$ (1)
where, p is the order of the AR model, and classifiers use $a_{\mathrm{m}}$ coefficients as features.
2.2.2 ST Features
ST is the extension of WT using Morlet wavelet as basic wavelet. ST has a superior property that moving function changes with time. Moving and scalable localizing window (Gaussian window) gives time localization property for signals [28]. ST method transforms x(t) signal into time-frequency domain as follows
$s(t, f)=\int_{-\infty}^{\infty} x(t) w(t-\tau, f) e^{-2 \pi i f \tau} d \tau$ (2)
where, $w(t-\tau, f)$ is called as window function and can be expanded to form ST as follows
$s(t, f)=\int_{-\infty}^{\infty} x(t) \frac{1}{\sigma(f) \sqrt{2 \pi}} e^{\left((t-\tau)^2\right) /\left(2 \sigma f^2\right)} e^{-2 \pi i f \tau} d \tau$ (3)
where, τ controls the position of the window over time, $\sigma(f)$ is the standard deviation of the moving window and calculated as follows
$\sigma(f)=\frac{1}{|f|}$ (4)
The performance of ST can be improved when the standard deviation of the moving window is changed as follows
$\sigma(f)=\frac{1}{a+b / \sqrt{f}}$ (5)
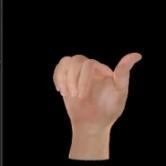
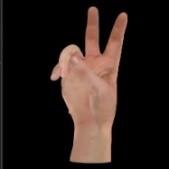
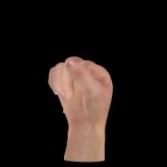
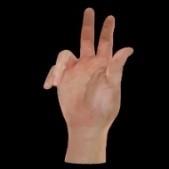
Table 1. Gestures in DB-a and DB-b
|
1. |
Tumb up |
5. |
Abduction of all fingers |
||
|
2. |
Extension of index and middle, flexion of the others |
6. |
Fingers flexed together in fist |
||
|
3. |
Flexion of ring and little finger, extension of the others |
7. |
Pointing index |
||
|
4. |
Thumb opposing base of little finger |
8. |
Adduction of extended fingers |
where, the values of a and b are varying between 0 and 1. Using the new $\sigma(f)$, the Gaussian window can be written as
$w(t, f)=\frac{a+b \sqrt{f}}{k \sqrt{2 \pi}} e^{\left((a+b \sqrt{f})^2 t^2\right) /\left(2 k^2\right)}$ (6)
where, $k<\sqrt{a^2+b^2}$. ST can now be formulated as follows
$s(t, f)=\int_{-\infty}^{\infty} x(\alpha+f) e^{\left(-2 \pi^2 \alpha^2 k^2\right) /(a+b \sqrt{|f|})^2} e^{2 \pi i \alpha \tau} d \alpha$ (7)
Mean value, standard deviation, energy, entropy, and kurtosis values of the ST signals are used as features. These values are calculated as follows
Mean $=\frac{1}{n+j} \sum a b s(s(j, n))$ (8)
where, abs is the absolute value of the complex signal, and s(j,n) is the transformed signal.
St. Dev. $=\sqrt{\frac{1}{n+j} \sum(\operatorname{abs}(s(j, n))-\operatorname{Mean}(s))^2}$ (9)
Energy $=\sum(\operatorname{abs}(s(j, n)))^2$ (10)
Entropy $=\sum-P(s(j, n)) \log (P(s(j, n)))$ (11)
P(s(j,n)) is the probability distribution of s(j,n).
Kurtosis $=\frac{\frac{1}{n+j} \sum(a b s(s(j, n))-\operatorname{Mean}(s))^4}{\left(\frac{1}{n+j} \sum(a b s(s(j, n))-\operatorname{Mean}(s))^2\right)^\quad\quad2}$ (12)
2.2.3 AR coefficients of positive and negative regions
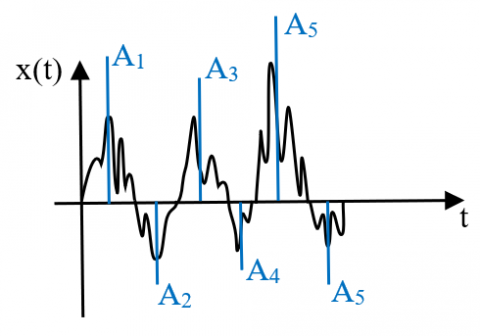
Although most of the time domain features are based on the statistical properties of the data, their classification accuracies are generally low except AR coefficients. Therefore, a new feature extraction method, which is based on AR coefficients of the sum of the samples in the positive and negative regions, is proposed for EMG signal classification. The first step of the new method is to sum the samples in positive and negative regions as follows
$A_{\mathrm{n}}=\sum_{i=1}^{N_n} x_i$ (13)
where, n is the index number of the region, $N_n$ is the number of samples of the positive or negative regions. The graphical representation of this process can also be seen in Figure 1.
Figure 1. Summation of the positive and negative regions
The AR coefficients of the sum of samples in the regions can be expressed mathematically as follows
$A_i=\frac{1}{N} \sum_{m=1}^p a_m A_{i-m}+w_i$ (14)
Many studies in the literature have shown that using multiple classifier methods can lead to more accurate classification results [24, 25, 29, 30]. Various strategies can be used to implement this kind of classification combination [25]. In this study, a simple method that is more suitable for the online working method was preferred. The chosen multi-classifier strategy shown in Figure 2 divides high dimensional feature vectors into m feature vectors and uses the same classifier for low dimensional vectors. Different classifiers can also be used for each feature vector as an alternative multi-classifier strategy. Then, each classifier produces a unique decision with respect to the class of the features. As the final decision step, the classification results obtained from each classifier are placed in a vector and the class with the highest score is taken as the result of the classification. The combined decision may be wrong when a majority of the decisions are wrong. But it is a fact that the majority of the classifiers would not often make the same mistake.
Figure 2. Architecture of multiple classifier
To evaluate the accuracy of the new feature and multiple classifier method, the CapgMyo database with three sub-databases (DB-a, DB-b, and DB-c) was processed with software written in MATLAB. 10-fold cross-validation methods were run. 10-fold cross-validation calculates the average performance of the tests and in each iteration uses one tenth of the data. As a first evaluation, individual performances of the new feature and all high scored features were investigated and the classification accuracy results can be seen in Table 2. As can be seen from Table 2, the LDA algorithm has poorly performed in EMG signals classification for all individual features. The single and multiple classifier results of the new feature have high classification accuracy with the DB-a and SVM algorithm. Nevertheless, KNN algorithm with the new feature seems not suitable for multi classifier method due to its low accuracy. The reason for this is to decrease the number of features in the feature space causes the classification results to have higher rates of error.
Considering the average performance of the new feature for the SVM algorithm, it can be observed from the results in Table 2 that when a single classifier is used, it gives better results than all features. However, when a multiple classifier is used, the result of the ST feature is better. It can also be seen that the multiple classifier results increase the classification accuracy.
In the second study, AR and ST features which have the best classification results were used with the new feature to increase the classification performance. The classification results of the algorithms for these combined features are shown in Table 3. The SVM algorithm seems to give the best results when the three features are used together. It is seen from Table 3 that single and multiple classifier results for the SVM are very close to each other. In fact, the results of the KNN algorithm for three features were quite high except for the DB-a database. However, the low classification result in the DB-a database reduced the average single classifier result of the KNN algorithm. It can be seen from these results that the classification results of the features are different for each database and the combination of the features will increase the classification results. When the results are evaluated in terms of the number of classifiers, the single classifier results of the SVM algorithm are quite good. The use of multiple classifiers in the LDA algorithm increases the classification accuracy but decreases in the KNN algorithm. The problem of the KNN algorithm consists of the new feature. If this study is compared with the study of Du [27], Du achieved 99.1% classification accuracy in DB-a, DB-b, and DB-c by using ConvNet and the majority voting method. In this study, an average of 99.57%. success has been achieved by using the SVM algorithm with the new feature and two high scored features, which can be seem in Table 3. It is known that the computation load of SVM algorithm is lower than ConvNet.
Table 2. Individual feature results of the methods for single and multiple classifier
|
Feature |
DB-a |
|||||
|
LDA |
SVM |
KNN |
||||
|
Single |
Multiple |
Single |
Multiple |
Single |
Multiple |
|
|
AR |
82,98±2,1 |
83,43±1,7 |
85,83±1,8 |
85,51±1,7 |
87,36±1,9 |
73,99±3,2 |
|
ST |
79,9±3,1 |
81,35±1,8 |
85,03±1,9 |
94,07±0,6 |
91,37±1,2 |
91,67±1,1 |
|
AR-Regions |
80,58±2,5 |
83,56±1,6 |
97,38±0,4 |
98,11±0,3 |
77,01±2,4 |
58,18±4,1 |
|
|
DB-b |
|||||
|
AR |
84,08±2,1 |
86,45±1,7 |
83,51±2,2 |
91,23±1,8 |
98,38±0,5 |
90,43±1,1 |
|
ST |
85,52±1,9 |
87,67±1,8 |
89,84±1,7 |
96,5±0,7 |
98,33±0,4 |
97,18±0,4 |
|
AR-Regions |
75,57±1,9 |
81,35±1,9 |
84,62±2,1 |
89,5±1,6 |
92,6±0,7 |
68,87±3,1 |
|
|
DB-c |
|||||
|
AR |
92,60±1,8 |
94,13±1,3 |
94,84±1,2 |
97,01±0,7 |
97,47±0,8 |
91,2±1,0 |
|
ST |
90,39±2,1 |
92,25±1,4 |
96,08±1,1 |
97,67±0,6 |
98,57±0,6 |
96,51±0,7 |
|
AR-Regions |
78,75±3,6 |
85,25±2,1 |
94,39±1,3 |
95,51±0,9 |
89,88±2,1 |
78,38±3,1 |
|
|
Average of DB-a, DB-b, DB-c |
|||||
|
AR |
86,55±4,2 |
88,00±4,5 |
88,06±4,8 |
91,21±4,6 |
94,40±4,9 |
85,21±7,9 |
|
ST |
85,27±4,2 |
87,09±4,4 |
90,32±4,5 |
96,08±1,4 |
96,09±3,3 |
95,12±2,4 |
|
AR-Regions |
78,30±2,0 |
83,38±0,9 |
92,13±5,4 |
94,37±3,6 |
86,50±6,7 |
68,47±8,2 |
Table 3. Results of three features for single and multiple classifier
|
Features |
DB-a |
|||||
|
LDA |
SVM |
KNN |
||||
|
Single |
Multiple |
Single |
Multiple |
Single |
Multiple |
|
|
AR+ST |
86,78±1,9 |
88,45±1,1 |
89,91±1,8 |
94,47±0,6 |
90,82±1,2 |
84,15±1,8 |
|
AR+ST+ AR-Regions |
71,90±3,4 |
84,32±1,3 |
99,67±0,2 |
99,59±0,2 |
89,44±1,7 |
77,50±2,4 |
|
|
DB-b |
|||||
|
AR+ST |
94,03±0,9 |
96,16±0,8 |
94,31±0,6 |
98,5±0,5 |
98,83±0,5 |
96,18±0,6 |
|
AR+ST+ AR-Regions |
96,22±0,8 |
97,78±0,6 |
98,68±0,4 |
99,56±0,2 |
98,74±0,4 |
84,56±1,2 |
|
|
DB-c |
|||||
|
AR+ST |
96,87±0,7 |
97,51±0,5 |
97,95±0,6 |
99,58±0,3 |
98,78±0,4 |
96,09±0,7 |
|
AR+ST+ AR-Regions |
97,97±0,6 |
97,94±0,6 |
99,55±0,2 |
99,58±0,2 |
98,25±0,5 |
75,64±1,5 |
|
|
Average of DB-a, DB-b, DB-c |
|||||
|
AR+ST |
92,55±4,2 |
94,04±3,9 |
94,06±3,2 |
97,52±2,1 |
96,14±3,7 |
92,14±5,6 |
|
AR+ST+ AR-Regions |
88,70±11,8 |
93,34±6,3 |
99,30±0,4 |
99,57±0,01 |
95,47±4,2 |
79,23±3,8 |
In this study, a new time domain feature was developed for use in EMG studies, and multiple and single classification performances of this feature were observed. Studies have shown that although the new feature is a time-domain feature, it offers very good results with the SVM algorithm in the classification task of EMG signals. In addition, using the new feature together with AR and ST features gave the highest classification accuracy with multiple SVM classifier. In fact, single classifier results of the united features are close to the results of multiple classifier. It is also seen that when the new feature is not used, the results of LDA and SVM algorithms for AR + ST features decreases, and it can be increased by using the multiple classifier method. These results indicate that the new feature is a very useful method for EMG studies. Nevertheless, the multiple classifier results of the new feature are reduced for KNN algorithm.
[1] Constantinides, V.C., Papahatzaki, M.M., Papadimas, G.K., Karandreas, N., Zambelis, T., Kokotis, P., Manda, P. (2018). Diagnostic accuracy of muscle biopsy and electromyography in 123 patients with neuromuscular disorders. In Vivo, 32(6): 1647-1652. https://doi.org/10.21873/invivo.11427
[2] Lei, M., Wang, Z., Feng, Z. (2001). Detecting nonlinearity of action surface EMG signal. Physics Letters A, 290(5-6): 297-303. https://doi.org/10.1016/S0375-9601(01)00668-5
[3] Boostani, R., Moradi, M.H. (2003). Evaluation of the forearm EMG signal features for the control of a prosthetic hand. Physiological Measurement, 24(2): 309. https://doi.org/10.1088/0967-3334/24/2/307
[4] Oskoei, M.A., Hu, H. (2007). Myoelectric control systems-A survey. Biomedical Signal Processing and Control, 2(4): 275-294. https://doi.org/10.1016/j.bspc.2007.07.009
[5] Zecca, M., Micera, S., Carrozza, M.C., Dario, P. (2002). Control of multifunctional prosthetic hands by processing the electromyographic signal. Critical Reviews™ in Biomedical Engineering, 30(4-6): 459-485. https://doi.org/10.1615/CritRevBiomedEng.v30.i456.80
[6] Phinyomark, A., Phukpattaranont, P., Limsakul, C. (2012). Feature reduction and selection for EMG signal classification. Expert Systems with Applications, 39(8): 7420-7431. https://doi.org/10.1016/j.eswa.2012.01.102
[7] Oskoei, M.A., Hu, H. (2008). Support vector machine-based classification scheme for myoelectric control applied to upper limb. IEEE Transactions on Biomedical Engineering, 55(8): 1956-1965. https://doi.org/10.1109/TBME.2008.919734
[8] Li, G., Li, Y., Yu, L., Geng, Y. (2011). Conditioning and sampling issues of EMG signals in motion recognition of multifunctional myoelectric prostheses. Annals of Biomedical Engineering, 39(6): 1779-1787. https://doi.org/10.1007/s10439-011-0265-x
[9] Li, G., Schultz, A.E., Kuiken, T.A. (2010). Quantifying pattern recognition—Based myoelectric control of multifunctional transradial prostheses. IEEE Transactions on Neural Systems and Rehabilitation Engineering, 18(2): 185-192. https://doi.org/10.1109/TNSRE.2009.2039619
[10] Camata, T.V., Dantas, J.L., Abrão, T., Brunetto, M.A., Moraes, A.C., Altimari, L.R. (2010). Fourier and wavelet spectral analysis of EMG signals in supramaximal constant load dynamic exercise. In 2010 Annual International Conference of the IEEE Engineering in Medicine and Biology, 1364-1367. https://doi.org/10.1109/IEMBS.2010.5626743
[11] Canal, M.R. (2010). Comparison of wavelet and short time Fourier transform methods in the analysis of EMG signals. Journal of Medical Systems, 34(1): 91-94. https://doi.org/10.1007/s10916-008-9219-8
[12] Shair, E.F., Ahmad, S.A., Marhaban, M.H., Mohd Tamrin, S.B., Abdullah, A.R. (2017). EMG processing based measures of fatigue assessment during manual lifting. BioMed Research International, 2017: Article ID 3937254. https://doi.org/10.1155/2017/3937254
[13] Diab, M.O., Marque, C., Khalil, M.A. (2007). Classification for uterine EMG signals: Comparison between AR model and statistical classification method. International Journal of Computational Cognition (http://www. ijcc. us), 5(1): 8-14.
[14] Xie, H.B., Guo, T., Bai, S., Dokos, S. (2014). Hybrid soft computing systems for electromyographic signals analysis: A review. Biomedical Engineering Online, 13(1): 1-19. https://doi.org/10.1186/1475-925X-13-8
[15] Ruangpaisarn, Y., Jaiyen, S. (2015). SEMG signal classification using SMO algorithm and singular value decomposition. In 2015 7th International Conference on Information Technology and Electrical Engineering (ICITEE), pp. 46-50. https://doi.org/10.1109/ICITEED.2015.7408910
[16] Rabin, N., Kahlon, M., Malayev, S., Ratnovsky, A. (2020). Classification of human hand movements based on EMG signals using nonlinear dimensionality reduction and data fusion techniques. Expert Systems with Applications, 149: 113281. https://doi.org/10.1016/j.eswa.2020.113281
[17] Khairuddin, I.M., Na'im Sidek, S., Majeed, A.P.A., Puzi, A.A. (2019). Classifying motion intention from EMG signal: A k-NN approach. In 2019 7th International Conference on Mechatronics Engineering (ICOM), pp. 1-4. https://doi.org/10.1109/ICOM47790.2019.8952042
[18] Gupta, R., Agarwal, R. (2019). Single channel EMG-based continuous terrain identification with simple classifier for lower limb prosthesis. Biocybernetics and Biomedical Engineering, 39(3): 775-788. https://doi.org/10.1016/j.bbe.2019.07.002
[19] Turgunov, A., Zohirov, K., Ganiyev, A., Sharopova, B. (2020). Defining the features of EMG signals on the forearm of the hand using SVM, RF, k-NN classification algorithms. In 2020 Information Communication Technologies Conference (ICTC), pp. 260-264. https://doi.org/10.1109/ICTC49638.2020.9123287
[20] Zia ur Rehman, M., Waris, A., Gilani, S.O., Jochumsen, M., Niazi, I.K., Jamil, M., Kamavuako, E.N. (2018). Multiday EMG-based classification of hand motions with deep learning techniques. Sensors, 18(8): 2497. https://doi.org/10.3390/s18082497
[21] Bozkurt, M.R., Subaşi, A., Köklükaya, E., Yilmaz, M. (2016). Comparison of AR parametric methods with subspace-based methods for EMG signal classification using stand-alone and merged neural network models. Turkish Journal of Electrical Engineering and Computer Sciences, 24(3): 1547-1559. https://doi.org/10.3906/elk-1309-1
[22] Al-Faiz, M.Z., Ali, A.A., Miry, A.H. (2010). A k-nearest neighbor based algorithm for human arm movements recognition using EMG signals. In 2010 1st International Conference on Energy, Power and Control (EPC-IQ), pp. 159-167.
[23] Naik, G.R., Selvan, S.E., Nguyen, H.T. (2015). Single-channel EMG classification with ensemble-empirical-mode-decomposition-based ICA for diagnosing neuromuscular disorders. IEEE Transactions on Neural Systems and Rehabilitation Engineering, 24(7): 734-743. https://doi.org/10.1109/TNSRE.2015.2454503
[24] Wahid, M.F., Tafreshi, R., Langari, R. (2019). A multi-window majority voting strategy to improve hand gesture recognition accuracies using electromyography signal. IEEE Transactions on Neural Systems and Rehabilitation Engineering, 28(2): 427-436. https://doi.org/10.1109/TNSRE.2019.2961706
[25] Xu, L., Krzyzak, A., Suen, C.Y. (1992). Methods of combining multiple classifiers and their applications to handwriting recognition. IEEE Transactions on Systems, Man, and Cybernetics, 22(3): 418-435. https://doi.org/10.1109/21.155943
[26] Geng, W., Du, Y., Jin, W., Wei, W., Hu, Y., Li, J. (2016). Gesture recognition by instantaneous surface EMG images. Scientific Reports, 6(1): 1-8. https://doi.org/10.1038/srep36571
[27] Du, Y., Jin, W., Wei, W., Hu, Y., Geng, W. (2017). Surface EMG-based inter-session gesture recognition enhanced by deep domain adaptation. Sensors, 17(3): 458. https://doi.org/10.3390/s17030458
[28] Pinnegar, C.R., Mansinha, L. (2003). The S-transform with windows of arbitrary and varying shape. Geophysics, 68(1): 381-385. https://doi.org/10.1190/1.1543223
[29] Lam, L., Suen, S.Y. (1997). Application of majority voting to pattern recognition: An analysis of its behavior and performance. IEEE Transactions on Systems, Man, and Cybernetics-Part A: Systems and Humans, 27(5): 553-568. https://doi.org/10.1109/3468.618255
[30] Gao, Z., Cai, J., Shi, Y., Hong, L., Yan, F., Zhang, M. (2021). Integration of two-dimensional kernel principal component analysis plus two-dimensional linear discriminant analysis with convolutional neural network for finger vein recognition. Traitement du Signal, 38(4): 1181-1187. https://doi.org/10.18280/ts.380429