Eren Akça | Ömer Özgür Tanrıöver*
© 2022 IIETA. This article is published by IIETA and is licensed under the CC BY 4.0 license (http://creativecommons.org/licenses/by/4.0/).
OPEN ACCESS
Visual complexity is an important factor affecting the efficiency and functionality of user interfaces. Its impact on the user's impression and the usability is significant, especially for mobile applications with constraints such as layout size, on screen keys and small input fields. Conventional approaches for visual complexity evaluation of user interfaces are either based on user evaluations with surveys or based on pre-specified formal metrics or on heuristics. Alternatively, in this study, we have explored the effectiveness of deep learning models for visual complexity evaluation, specifically, of mobile user interfaces. We have experimented with five state of the art pre-trained deep learning models known to be effective for computer vision tasks, namely, VGG16, DenseNet121, MobileNetv2, GoogleNet and ResNet152 were trained with 3635 different mobile user interface images as login, menu, search and settings. Furthermore, in order to validate the effectiveness of this approach, a new validation dataset and survey application was developed and an evaluation study was conducted with 98 participants where 7309 comparison result were obtained from the study. It was found that the agreement rate between the results of deep learning models and the user evaluations was up to 78% and 74% on the average. The high to moderate agreement rate between the results of deep learning models and the user evaluations reveals that this approach can be useful for designers in visual complexity evaluation of mobile user interfaces.
mobile user interface evaluation, transfer learning, visual complexity analysis
In recent years, people's access to mobile devices such as smartphones and tablets has become easier, and with regard to this technological change, the amount and use of mobile applications has grown dramatically. Considering that there are millions of mobile applications being developed in areas like online shopping, food delivery, online banking, social media, entertainment and online learning, it is obvious that mobile applications are the main gateway to the virtual world. Hence, for service/product providers or application developers, users interface complexity perception is one of the most important components to reach large audiences. Therefore, user interfaces that are perceived less complex, easy to use and in line with user`s mental representation are becoming more in demand.
On the other hand, mobile applications with less intuitive, distractive or complex user interfaces (UI) may hinder user acceptance. From the user's point of view, almost every user screen of the application should be easily comprehensible but also respond to user expectations. From the application developer's point of view, it is a tedious process to develop low-complex graphical user interfaces especially for mobile applications taking into account constraints such as limited screen sizes, on screen keys and small input fields.
Many different factors effect visual complexity, such as graphical design of the UI, the layout, the number and variety of components and the relationship between these components and so on. Complexity analysis of visual interface and its understandability has long been the focus of attention of researchers. While in earlier studies [1-3], perceptual visual complexity had been tried to be defined based on perceptual attributes, in later studies, visual complexity of UIs has been measured by user evaluation with surveys, developing formal metrics and models [4-6], heuristics [7] to machine learning based [8] methods. Although formal metric and model based methods are mostly used, due the need of a blend of different metrics for different attributes and their potential complex interaction this problem is still not fully resolved. One possible reason for this is that the success of this method is tightly dependent various assumptions such as number and combination of metrics and metric coefficients used in the conceived predictive model [4]. Another reason is that there may be other factors that affect the perception of visual complexity but still cannot be formulated precisely [5].
For the above stated reasons, as opposed to user evaluation, metric/model based methods; machine learning based approaches focus on visual complexity evaluation rely on machine learning models` understanding. Although, previously deep learning models for other type of general image visual complexity problems [9-11] and even for the quality assessment problem for 3D images [12] produced promising results, deep learning models for visual complexity of mobile UIs has not been studied thoroughly. The absence of latent factors that can be utilized in addition to existing metrics without directly involving human in the visual complexity analysis process encouraged us to explore pre-trained models that are known to be effective for computer vision tasks.
Therefore in this study, we explored the effectiveness of pre-trained deep learning models to evaluate mobile UI visual complexity. Various mobile applications are used in the data set gathering process and during experiments. However, at the time we preferred to include UIs that exist for common purposes/features in many applications. For this reason, four different widely used mobile UI types have been determined as login, search, menu and settings. A dataset containing these UIs has been prepared and classification models with five different state of the art deep neural networks for visual tasks have been adapted. Pre-trained deep learning models, namely VGG16 [13], DenseNet121 [14], MobileNetv2 [15], GoogleNet [16] and ResNet152 [17], were trained with 3635 different mobile UI images as login, menu, search and settings. We aimed to explore deep learning models for mobile UIs to see its potential for mobile UI visual complexity measurement. The three main contributions of the study are as follows: 1) A dataset, which includes different mobile UI types as login, menu, search, settings and registration, was distilled from the RICO dataset for this study, this can be used for other similar studies. 2) Five state of the art pre-trained deep learning models are experimented with and their accuracies are compared for mobile UI complexity evaluation to identify the most suitable for this task 3) In order to validate the effectiveness of the approach, a new validation dataset was collected from different mobile applications and formed then an application is developed to be used in the evaluation study. The evaluation was conducted with 98 participants where 7309 comparison result were obtained. It was found that the agreement rate between the deep learning models results and the user evaluations was up to 78% on the average 74%. The high to moderate agreement rate between the results of deep learning models and the user evaluations reveals that this approach can be useful for automatic visual complexity evaluation of mobile user interfaces.
The rest of the paper is as follows: section II reviews the visual complexity analysis methods. In section III, the proposed deep learning model is described. The validation process and the results of the proposed model are presented in section IV. Discussions and the potential future works are given in section V. The potential threats to the validity of this research are discussed in section VI, followed by conclusions in section VII.
The effects of images on human perception were first investigated by Gestalt psychologists towards the middle of the 20th century [18]. Later, many studies have been done to describe the visual complexity concept of images [1-3]. One of the agreements of these studies is that although perceptual visual complexity is a measurable concept, it is hard to be defined formally, as many different interacting features of the visual are affecting perception. After the concept of visual complexity has been described, various studies have been carried out to measure this concept in predefined metric based manner [4-6]. Typically, there are studies in which the quality of the mobile UIs was measured by transforming it into a multi-objective optimization problem [7]. Lastly, UI evaluation with machine learning based methods is being conducted [8]. Support Vector Machine for UI classification with reinforcement learning to mimic human machine interaction for UI evaluation is being experimented.
Although computer vision techniques have attracted attention in many fields [19-21], metrics related to the components and perceptual attributes of graphical user interfaces has been used in the field of measuring visual complexity so far [22]. In a recent study, Michailidou et al. [23] aimed to develop a prediction model that calculates the visual complexity value of web pages through the source codes of the web pages. In the first user study, they asked 55 users to rate visual complexity for 30 different web pages to manually determine the structural elements (number of menus, images, words, links and top left corner) that affect the web page complexity. Accordingly, they proposed a simple and effective statistical complexity calculation model based on the relationship between the limited number of elements and visual complexity ratings of web pages. In their second study, they asked 104 users to rate 30 web pages and by comparing these results with the results they obtained from the model, they stated that there was a strong correlation between the model and the user ratings.
In some earlier studies, the use of computer vision techniques has been mentioned as an alternative to conventional methods. As an example, Wu et al. [24] proposed a machine learning-based predictive model to score the visual complexity of web pages. It automatically extracted 44 different features (related to color, layout, texture and images of the web pages) that can be used in complexity calculation with computer vision techniques. Then, together with these features, they performed a visual complexity calculation for web pages using “Support Vector Distribution Regression” technique. In another study, Koch and Oulasvirta [25] tried to estimate the UI layout complexity using Gestalt principles by defining metrics such as UI element connectedness, alignment and common region. They measured visual complexity of web pages with an accuracy of 90% in their setting and claimed that this rate could be increased by applying computer vision techniques. Riegler and Holzmann [4] carried out a similar study for mobile UIs and introduced metrics in addition to existing ones in the literature. They also recognized that UI elements with the help computer vision task could be identified to calculate visual complexity. Moreover, Bakaev et al. [26, 27] introduced a visual complexity evaluation tool for websites. From another point of view, Soui et al. [7] aimed to solve the visual complexity analysis problem for mobile UIs by transforming it into a multi-objective optimization problem. In a recent study, Akça and Tanriöver [22] reviewed attributes affecting the visual complexity of UIs and presented a taxonomy of the visual complexity analysis methods, where each method was discussed in detail.
Deep learning has been prominently used in classification and prediction problems in other areas but perceptual visual complexity analysis with deep learning models is only started to be investigated. Although there is not an exact dataset created for this purpose, there exist earlier datasets such as ERICA [28], RICO [29] and some other datasets created from subsets of RICO [30, 31] that could be used for general tasks on mobile application UIs, and recently, a dataset [32] consisting of various images that can be used to train machine learning models has been created and becoming to be used for studies such as aesthetics or visual complexity evaluation for images [33].
In 2016, Deka et al. [28] prepared a dataset named ERICA consisting of 18000 mobile UI images taken from 1011 mobile application. In another study, Deka et al. [29] introduced RICO dataset in which there are more than 72000 images of mobile application UIs along with user interaction data and some metadata such as application download count and user ratings. Thus, this dataset could be used in studies such as UI evaluation, visual complexity or aesthetics analysis. In another study, Lima et al. [31] developed a dataset named Appsthetics for automatic evaluation of the visual aesthetics of mobile interfaces with deep neural networks.
Furthermore, von Wangenheim et al. [30] conducted a study to understand how the `visual aesthetic` perception for mobile interfaces can be measured and how the aesthetics of mobile interfaces are perceived by the user using the RICO dataset. At the end of the study; they concluded that the perception of visual aesthetics has a direct effect on the success of mobile applications. In another study, Jiang et al. [34] introduced some metrics such as consistency, hierarchy, contrast, balance and harmony to measure various UI properties to evaluate mobile UI designs. Then, a Support Vector Regression model was used to classify mobile UIs according to their design quality. In a similar study, Dhengre et al. [35] developed a mobile UI usability evaluation model. They measured complexity as well as regularity and touchability of mobile UIs to evaluate usability. For this, they designed such a deep learning model that features are extracted in the first layers, and then evaluation for each of three usability measures are done in the next specialized layers. They tested their work on 205 sample images and stated that the success of the model they proposed was 90%.
For evaluating ‘visual complexity of images’, Saree et al. [33] experimented with images taken from different categories such as advertisement, scenes, objects, art, suprematism and interior design using different deep neural networks trained for classification task. They trained VGG16 [13], ResNet-v2-152 [17] and EfficientNet [36] models to classify the given input images using the dataset they introduced and named SAVOIAS [20]. After the deep neural networks were trained, they benefited from the feature map formed in the network in response to the given input image in order to measure the visual complexity.
Conventional approaches are either based on user evaluation, formal metrics or heuristic-based methods. For mobile UI visual complexity evaluation, the methods based on human intuition or calculations with predefined metric have prominently been examined, where in this study, a deep learning based approach for visual complexity analysis of mobile UIs is investigated. Deep learning based studies for general image visual complexity evaluation produced promising results [9-11, 33, 35], but deep learning based approaches for visual complexity evaluation of mobile UIs has not been studied thoroughly.
In this section, the method for visual complexity evaluation of mobile UIs is discussed. To this end, the dataset, the deep neural networks, parameters and the training process of the networks are explained respectively.
3.1 Dataset
Among the datasets mentioned in the previous section, the most suitable for our study was the RICO dataset. RICO is created from over 9300 android applications in 2017 for data centric research to be conducted by data miners, mobile application developers and UI/UX designers. It provides the largest mobile UI data with an approximate size of more than 200 GB (UI screenshots and metadata, user ratings, animations and user interactions etc.) needed by researchers to perform data centric applications such as UI design and code generation, user interaction modeling, user perception prediction, design search.
We can list the reasons for preferring the RICO dataset as follows: 1) Instead of collecting and creating our own therefore potentially limited data samples and resolution, we preferred to use a dataset which is publically available, has many samples and also used in other similar studies for more generalizable results. 2) Among the other potential datasets SAVOIAS is not a mobile UI dataset and Appsthetics is the subset of images randomly taken from the RICO dataset for labeling the mobile UIs. 3) RICO is an extended version of ERICA. Therefore, a publicly available dataset, the RICO dataset, containing 72000 mobile UI images in different categories was used in this study.
Classification of mobile UIs is not a trivial process when there are applications from various categories. For this reason, the dataset was preprocessed in three steps before using it. In the first step, types of mobile UIs to be included in the classification process were determined. For this, four UI types have been listed such as; login, search, menu and settings by paying attention to the UIs used in almost every application regardless of the mobile application category. Secondly, suitable mobile UI images were selected among 72000 images in the RICO dataset. With the preliminary study carried out for this purpose, all images reside in the dataset were examined one by one and a total of 3635 images were extracted. In the last step, the resulting distilled images were organized to be used as training data. In this context, the images of each UI type were kept in a hierarchical structure and made ready to be used in the training of deep neural networks. Then, the obtained data was included in the training process of deep learning models such that 80% for training data, 10% for validation data and 10% test data (Table 1).
Table 1. Number of images in the dataset created for four different mobile UI categories
|
|
Training |
Validation |
Test |
|
Login |
772 |
96 |
96 |
|
Search |
542 |
68 |
68 |
|
Menu |
1131 |
142 |
142 |
|
Settings |
462 |
58 |
58 |
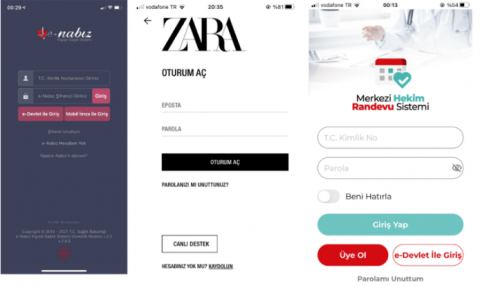
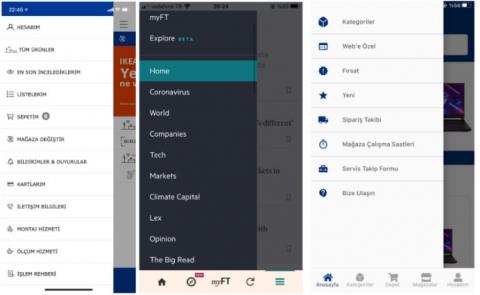
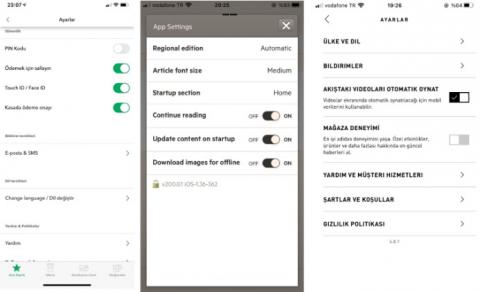
Apart from the dataset used in the training of classification models, another dataset was created by us to be used for the validation phase of our study. That is we developed a dataset this time to validate the visual complexity analysis results obtained by deep neural networks with the real users. This dataset consisted of UI images of mobile applications available in Android or IOS markets that are not included in the RICO dataset. In order to keep the UI diversity as high as possible, there exist 51 different UI images of 30 mobile applications in many categories ranging from online newspaper, online banking, and online shopping to entertainment. As in the training dataset, UI images in this dataset were located under the categories of login, search, menu and settings. In Figures 1-4, sample images of login, search, menu and settings UIs of the dataset are shown, respectively.
Figure 1. Sample images for login UI
Figure 2. Sample images for search UI
Figure 3. Sample images for menu UI
Figure 4. Sample images for settings UI
3.2 Transfer learning with pre-trained architectures
Training process for UI image classification task was carried out with five state of the art pre-trained deep neural networks: VGG16 [25], ResNet-v2-152 [26], MobileNetv2 [29], GoogleNet [30] and DenseNet-121 [28]. The development environment used during the training of deep neural networks is based on Python v3.8.5 and the rest of scientific computing libraries were obtained through anaconda, the most widely used python distribution. All deep neural networks used in the study were acquired using python's torchvision v0.8.2 library, which was developed for computer vision tasks and contains model architectures.
We decided to experiment with both with low parameter count (MobileNetv2, GoogleNet, DenseNet-121) and high parameter count (VGG16, ResNet-v2-152) together. We wanted to determine whether deep networks with a small number of parameters are efficient, in line with the need to work on mobile devices such as tablets and mobile phones with low processing power.
In the training of the pre-trained models, transfer learning technique was used, specifically, only the classification layer were retrained on each model that was previously trained on the “ImageNet” dataset. Therefore, generic features of the UI images are extracted with the help of pre-trained networks. However, pre-trained models have high parameter count to classify 1000 classes by default. Since there were four different classes in our study, we replaced pre-trained classification layer of each model with a lightweight and randomly initialized classification layer to classify four classes of mobile UIs (login, search, menu, settings) from scratch. In this way, training process was achieved in a shorter time as we had aimed. One of the precautions we took to avoid overfitting of the networks we did not use the entire dataset in training phase. We used randomly selected 3271 mobile UI images as shown in Table 1 to train the networks. We reserved the remaining 365 screenshots for testing purposes after the training of the networks was completed.
Table 2. Hyper parameters related to the deep neural networks used and the results of training process
|
Deep neural network |
Parameter count |
Learning rate |
Optimization algorithm |
Epoch (average) |
T1 accuracy (average) |
|
VGG16 |
138 M |
0.002 |
SGD with Momentum |
60 |
90.8 |
|
DenseNet121 |
7.2 M |
0.002 |
SGD with Momentum |
29 |
87.6 |
|
MobileNetv2 |
3.4 M |
0.002 |
SGD with Momentum |
75 |
87.7 |
|
GoogleNet |
6.7 M |
0.002 |
Adam |
55 |
86.0 |
|
ResNet152 |
58.5 M |
0.002 |
SGD with Momentum |
37 |
87.8 |
Hyper parameters for each deep network and the top accuracies for the classification task are shown in Table 2. During the training process, the hyper parameters were improved over time by trial and error to find the optimum for each parameter. For this purpose, firstly, the average number of epochs giving the highest accuracy was determined for the initial configuration of each model such as “Stochastic Gradient Descent-SGD” as an optimization algorithm and 0.002 as learning rate. This experiment was carried out as follows; 1) In order to prevent overfitting, the training was stopped at the epochs where the accuracy in Table 2 were reached. 2) The average 10 epochs obtained from the training for each model was determined. Since the optimum learning rate was observed to be 0.002 with various trials in order for the model to achieve high accuracy with less computation time, this value kept constant for all models. Then, SGD with momentum were tried as an optimization algorithm without changing the rest of parameters. It was observed that by using SGD with momentum, the classification accuracy of the model increased while average epoch number decreased. On the other hand, using the Adam optimization for GoogleNet, among other models trained with a high number of epochs; it was observed that the same accuracy was achieved with lower total loss and fewer epochs.
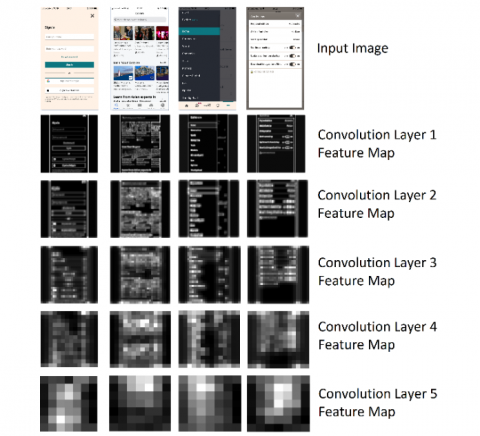
Perceptual visual complexity analysis problem for mobile UIs has been reduced to a classification problem. The classification is done by pre-trained deep learning models with the transfer learning method on mobile UI datasets we have formed. Following the model training, the type of a mobile UI image was determined by the trained models and then the feature maps for each model are taken into account. Previously [33], it was observed that the scores obtained from the feature maps of the first and last layers were not compatible with participant evaluations. Based on this, we also used feature maps in the intermediate layers of each model. Accordingly, the architectures of deep learning models, the layers from which feature maps are used are shown in Figure 5. Moreover, as an illustrative example, the feature maps of each layer corresponding to the sample mobile interface images given as input to the VGG16 network are shown in Figure 6.
Figure 5. The architecture of deep learning models used; the feature maps are obtained from the intermediate layers (green boxes) for visual complexity calculation
For each deep learning model, the formula in Eq. (1) [33] was applied to the feature maps and a scaler value which is named visual complexity value of the input image was obtained.
$V C(l)=\frac{1}{h * w * d} \sum_{i=1}^h \sum_{i=1}^w \sum_{k=1}^d F_l[i, j, k]$ (1)
where, VC is visual complexity value, h, w, d, l and F are height, width, depth, layer number and feature map, respectively.
After obtaining the VC values for experimented mobile UI images, as we wanted to see the agreement with the human perception a validation dataset using the screenshots of different mobile UIs was prepared and a survey study was conducted for labeling the newly prepared dataset.
Figure 6. The images of the feature maps in VGG16 corresponding to example inputs for each of mobile UI types. In the first row, input images are login, search, menu and settings, respectively. In the following rows below, feature maps for each convolution layer are shown
4.1 Participants’ profile
The purpose of the survey study was to reveal the relationship between the participants' perception of visual complexity and the outputs of the deep learning models. Hence, it is aimed to validate the effectiveness of the method. For this purpose, participants with different profiles were included in the study in three groups;
Group 1 – Technology leaders: In this group, users who are aware of UI advancements, follow the developments closely and even participate in the developments were opted for. In this manner, group 1 included employees working in positions such as software development, testing, system/design development of technology companies, as well as academics in related departments of universities or take part in R&D projects.
Group 2 – Generation-Z: In particular, it is aimed to include the young and keen mobile interface users and test their perceptions and expectations. In this direction, high school and university students who are interested in mobile applications are part of this group.
Group 3 – Those who use technology as needed: Contrary to the previous groups, group 3 consists of people who use technology only in line with their needs. They are neither technology professional nor are they very curious in this sense. The reason for this is that there are many people who do not follow mobile developments but have to use mobile in line with today's necessity, and the developed applications should appeal to these people.
We did not have age based groups as at this stage and we are interested more on the general effect of the mobile UI design rather than the age range. That’s why no age restriction is applied among the participant groups. We conducted a survey study with at least 30 participants from each group and 98 participants in total. The participants were not given any preliminary information before participating in the survey.
4.2 Validation process
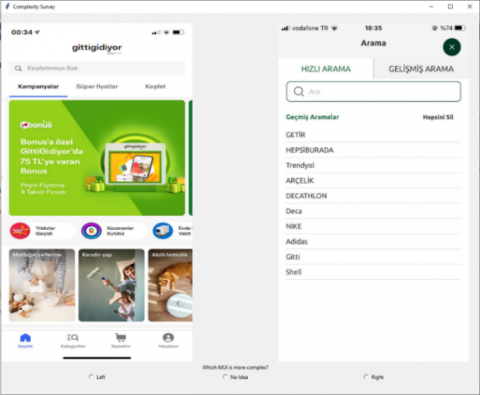
A survey application was developed in order to obtain the reel user perception (i.e. ground truth) of the mobile UIs with which the results obtained from the trained deep learning models can be compared. The developed survey application is used for comparisons by the participants without any prior knowledge about the objective of the study. In this way, it is aimed that the participant would not be biased towards the study before starting the comparisons. In addition, the survey application has a very simple UI and has been developed in such a way it can be progressed with a single action. Sample UIs of the survey application are presented in Figure 7 and 8.
Figure 7. Comparison of the search UIs of two mobile applications
Figure 8. Comparison of the login UIs of two mobile applications
Survey application opens two mobile UIs to be compared each time. Then, the participant is asked the research question "Which MUI is more complex?", and the participant chooses either in response to the question. In case where the participant thinks that the mobile UIs are close to each other in terms of visual complexity, the participant can choose the "No idea" option. After making the selection, the participant moves to a new page where different mobile interfaces are compared. We don’t specify a time limit for the participant to complete the survey or force the survey application to close after a certain period of time. However, studies have shown that the complexity perception of user interacting with the visuals is formed in the first seconds of the interaction [37-39]. For this reason, we informed the participant in advance to spend a maximum of five minutes for the survey. Moreover, the survey was sent to the participants separately, the participants did not have any contact with each other during the survey.
Survey was carried out with a total of 98 participants. The participant profile was as stated in Section 4.1, with 34 participants in group 1, 33 participants in group 2 and 31 participants in group 3. In various studies it is agreed that the perception of visual complexity can better expressed relatively, by comparing two different images [33], and therefore, comparative results were collected this study. Accordingly, a total of 7309 comparisons were made with 98 different participants, and answers were received regarding the perception of visual complexity for 5192 comparisons, and participants could not express their opinions for 2117 comparisons
The participants’ responses obtained from the survey study were compared with the results of the trained models, for each mobile UI to see the agreement level, to identify strengths and weaknesses of the model. The response of the participants included in the survey study were considered both in groups and together so that the models output and the participant responses can be statistically compared. In the next series of figures, the most and the least complex mobile UIs according to the participants’ responses are shown with the deep learning model results (see Figures 9-16).
Figure 9. The more complex login UIs examples with deep learning model results
Figure 10. The less complex login UIs examples with deep learning model results
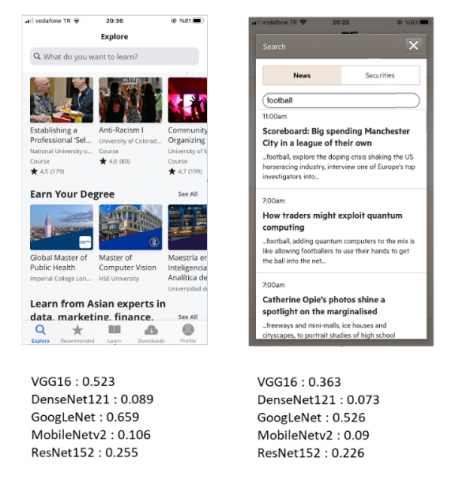
Figure 11. The more complex search UIs with deep learning model results
Figure 12. The less complex search UIs with deep learning model results
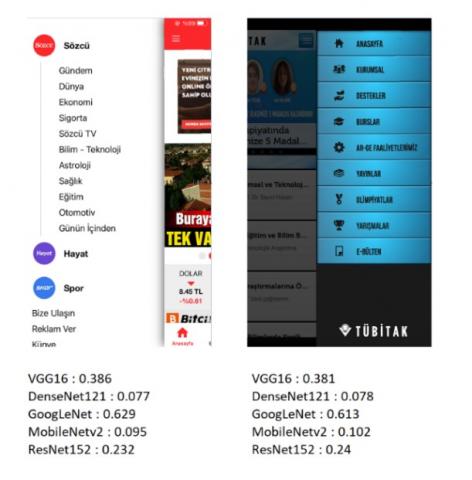
Figure 13. The more complex menu UIs with deep learning model results
Figure 14. The less complex menu UIs with deep learning model results
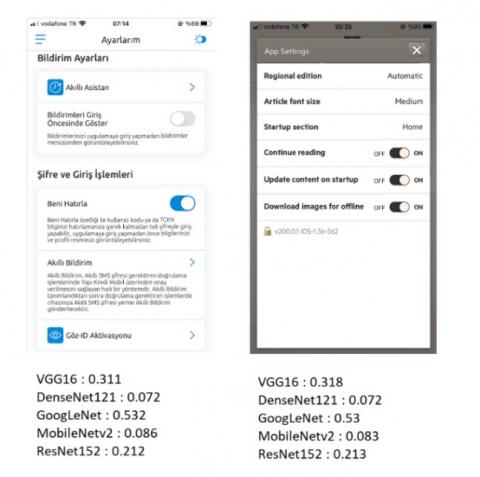
Figure 15. The more complex settings UI with deep learning model results
Figure 16. The less complex settings UI with deep learning model results
4.3 Descriptive data analysis
The participants’ evaluation of visual complexity of mobile UIs and the results obtained from the five different deep learning models was compared. The participants’ evaluation for each group (G1, G2 and G3 represents Group 1, Group 2 and Group3, respectively) and the models descriptive data are shown in Table 3 and 4.
The main findings of descriptive data analysis can be listed as follows:
Furthermore, the data summary evaluating all participants is shown in Table 5. The overall highest percentage of agreement with the participant evaluations and deep learning models trained for mobile UI classification is achieved by ResNet152 to be 74% for mobile UIs belonging to different categories and by VGG16 to be 67.4% for mobile UIs belonging to the same category. Moreover, participants marked 29.7% of the total comparisons as "No Idea" for in-category image pairs and we thought that the image pairs that the participants are undecided are also worth studying and understanding. Based on this idea, to understand whether the image pairs marked as “No Idea” have similar visual complexity to each other, the ratio of the mean difference of the visual complexity values of perceived image pairs to the mean difference of the visual complexity values of the undecided image pairs is calculated. According to the results, the mean difference of the visual complexity values of the image pairs that the participants could respond to is approximately 1.3 times higher than the mean difference of the visual complexity values of the undecided image pairs as shown in Table 5. This implies that if the images compared with each other have similar visual complexity, although this complexity difference is not easily perceived by the participants, it can be predicted by deep learning models.
Table 3. The participants' evaluations and model results for each group (G1, G2 and G3 represents Group 1, Group 2 and Group3, respectively) for in-category images
|
|
Number of matched comparisons |
Number of mismatched comparisons |
Number of comparisons marked as “No Idea” |
Ratio of mean differences of VC values of perceived image pairs to image pairs marked as “No Idea” |
Total number of comparisons |
Match percentage (%) |
|
|
VGG16 |
G1 |
1342 |
615 |
1155 |
1.31 |
3112 |
68.6 |
|
G2 |
1087 |
546 |
592 |
1.20 |
2225 |
66.6 |
|
|
G3 |
798 |
397 |
280 |
1.50 |
1475 |
66.8 |
|
|
DenseNet 121 |
G1 |
1314 |
643 |
1155 |
1.27 |
3112 |
67.1 |
|
G2 |
1087 |
546 |
592 |
1.20 |
2225 |
66.6 |
|
|
G3 |
803 |
392 |
280 |
1.41 |
1475 |
67.2 |
|
|
MobileNet v2 |
G1 |
1298 |
659 |
1155 |
1.16 |
3112 |
66.3 |
|
G2 |
1047 |
586 |
592 |
1.11 |
2225 |
64.1 |
|
|
G3 |
748 |
447 |
280 |
1.22 |
1475 |
62.6 |
|
|
GoogleNet |
G1 |
1317 |
640 |
1155 |
1.27 |
3112 |
67.3 |
|
G2 |
1089 |
544 |
592 |
1.17 |
2225 |
66.7 |
|
|
G3 |
792 |
403 |
280 |
1.40 |
1475 |
66.3 |
|
|
ResNet152 |
G1 |
1314 |
643 |
1155 |
1.36 |
3112 |
67.1 |
|
G2 |
1073 |
560 |
592 |
1.23 |
2225 |
65.7 |
|
|
G3 |
799 |
396 |
280 |
1.56 |
1475 |
66.9 |
|
Table 4. The participants' evaluations and model results for each group (G1, G2 and G3 represents Group 1, Group 2 and Group3, respectively) for inter-category images
|
|
Number of matched comparisons |
Number of mismatched comparisons |
Number of comparisons marked as “No Idea” |
Ratio of mean differences of VC values of perceived image pairs to image pairs marked as “No Idea” |
Total number of comparisons |
Match percentage (%) |
|
|
VGG16 |
G1 |
187 |
63 |
57 |
0.92 |
307 |
74.8 |
|
G2 |
50 |
25 |
28 |
0.84 |
103 |
66.7 |
|
|
G3 |
62 |
20 |
5 |
1.40 |
87 |
75.6 |
|
|
DenseNet 121 |
G1 |
181 |
69 |
57 |
0.94 |
307 |
72.4 |
|
G2 |
45 |
30 |
28 |
0.80 |
103 |
60.0 |
|
|
G3 |
64 |
18 |
5 |
1.65 |
87 |
78.0 |
|
|
MobileNet v2 |
G1 |
162 |
88 |
57 |
0.89 |
307 |
64.8 |
|
G2 |
44 |
31 |
28 |
0.76 |
103 |
58.7 |
|
|
G3 |
58 |
24 |
5 |
1.01 |
87 |
70.7 |
|
|
GoogleNet |
G1 |
168 |
82 |
57 |
0.88 |
307 |
67.2 |
|
G2 |
49 |
26 |
28 |
0.76 |
103 |
65.3 |
|
|
G3 |
60 |
22 |
5 |
1.41 |
87 |
73.2 |
|
|
ResNet152 |
G1 |
186 |
64 |
57 |
0.93 |
307 |
74.4 |
|
G2 |
51 |
24 |
28 |
0.91 |
103 |
68.0 |
|
|
G3 |
64 |
18 |
5 |
1.77 |
87 |
78.0 |
|
Table 5. All participants' evaluations and model results
|
|
Number of matched comparisons |
Number of mismatched comparisons |
Number of comparisons marked as “No Idea” |
Ratio of mean differences of VC values of perceived image pairs to image pairs marked as “No Idea” |
Total number of comparisons |
Match percentage (%) |
||||||
|
In-Category |
Inter-Category |
In-Category |
Inter-Category |
In-Category |
Inter-Category |
In-Category |
Inter-Category |
In-Category |
Inter-Category |
In-Category |
Inter-Category |
|
|
VGG16 |
3227 |
299 |
1558 |
108 |
2027 |
90 |
1.29 |
0.93 |
6812 |
497 |
67.4 |
73.5 |
|
DenseNet 121 |
3204 |
290 |
1581 |
117 |
2027 |
90 |
1.25 |
0.93 |
6812 |
497 |
67.0 |
71.3 |
|
MobileNet v2 |
3093 |
264 |
1692 |
143 |
2027 |
90 |
1.15 |
0.87 |
6812 |
497 |
64.6 |
64.9 |
|
GoogleNet |
3198 |
277 |
1587 |
130 |
2027 |
90 |
1.25 |
0.87 |
6812 |
497 |
66.8 |
68.1 |
|
ResNet152 |
3186 |
301 |
1599 |
106 |
2027 |
90 |
1.33 |
0.96 |
6812 |
497 |
66.6 |
74.0 |
Table 6. Chi-squared test results of participants' responses for each UI category
|
UI category |
Login |
Search |
Menu |
Settings |
|
Chi square statistic |
543.96 |
278.55 |
171.61 |
177.66 |
|
Degrees of freedom |
441 |
144 |
49 |
49 |
|
p-value |
0.0005757 |
1.266e-10 |
1.617e-15 |
1.754e-16 |
Table 7. PCC for participants' responses and model evaluations for each UI category
|
|
r, p value |
|||
|
Login |
Search |
Menu |
Settings |
|
|
VGG16 |
0.61, 9.77e-53 |
0.54, 2.23e-14 |
0.74, 1.87e-12 |
0.81, 3.00e-16 |
|
DenseNet121 |
0.67, 4.69e-65 |
0.51, 4.71e-13 |
0.54, 3.89e-06 |
0.84, 3.10e-18 |
|
GoogleNet |
0.64, 1.90e-58 |
0.32, 1.51e-05 |
0.58, 4.91e-07 |
0.88, 9.96e-22 |
|
MobileNetv2 |
0.71, 1.00e-77 |
0.42, 1.13e-08 |
0.54, 3.37e-06 |
0.88, 9.96e-22 |
|
ResNet152 |
0.67, 1.07e-65 |
0.47, 6.45e-11 |
0.62, 4.10e-08 |
0.81, 3.00e-16 |
Two statistical tests were applied in order to measure the consistency of the participants’ evaluation and to compare this evaluation with the results obtained from the transfer learning models. The chi-squared test was used to test whether the participant answers were self-consistent, and the Pearson’s Correlation Coefficient was used to measure the correlation between participant’s evaluation and model results.
4.4 Chi-Square test and Pearson’s correlation
Firstly, the chi-square test is done to see whether the difference between the observed and expected frequencies is significant. The consistency of the participants' evaluations is seen important, as the visual complexity perception of the participants is used as ground truth for the deep learning models. The null and alternative hypotheses formed for this test were as follows:
H0: There is no perceptible difference between GUI visuals in terms of "Visual Complexity".
H1: There is a perceptible difference between GUI visuals in terms of "Visual Complexity".
In this context, all participants’ responses were tested separately for 4 different UI categories. The chi-squared test results are as shown in Table 6, and according to the results, the null hypothesis was rejected and the alternative hypothesis was supported with high confidence level.
Then, Pearson’s Correlation Coefficient is used for measuring linear correlation between two data sets. This used to see the correlation between the participants’ responses and the results of the deep learning models regarding the visual complexity of the sample UI images prepared for the survey. Correlation analysis was performed for each deep learning model separately and for each UI category. The PCC results are given in Table 7. As p < 0.05 for all models; therefore, there is a positive correlation of classification models with participants’ evaluations.
The results obtained within the scope of this study could be evaluated from different perspectives. First, with the diversity of the participants included in the survey indicate that the results of the state of the art deep learning models for visual complexity analysis agree to a certain degree with human perception. The highest match percentage between the deep learning models and participant evaluations for in-category comparisons belongs to VGG16 and it is 67.4%. This result shows that the visual complexity difference between the UIs belonging to the same category can be perceived by the participants and this complexity difference can be revealed numerically by deep learning models. In addition, it is understood that the participants could not make a decision when the visual complexity difference between two mobile UIs compared is small. From this point of view, deep learning models can still produce a visual complexity score even when the participants cannot decide (29.7% of total comparisons marked as “No Idea”) which UI is more complex.
For mobile UIs belonging to specific categories, the results show that the participants can make comparisons more easily. In other words, the undecided comparison rate decreased to 18.1%. In addition, the difference in visual complexity score was ensured to be more pronounced, and in this case, the agreement is 74% by reflecting on the results.
In addition, participant groups’ perception of visual complexity varies according to the participant profile. This is already the main factor that makes the visual complexity analysis problem complicated. The reason why group 2 participants' evaluations have lower compatibility percentage with the proposed method compared to group 1 and group 3 participants is that the participants in this group have different perceptions compared to the others.
The threats to the validity of this study are separated in two categories; threats to internal validity and external validity. As the first threat to the internal validity is the lack of developing a specific deep learning model to measure the visual complexity. The success rate of the method could have been increased by using such a network. However, more than one deep learning model is trained with hyper parameter optimization, each of which has proven itself in object classification task in order to minimize this situation from being a threat. One probable future work can be to develop a task specific deep neural network that can be more effective for this problem. For this, by examining the architecture of deep neural networks, experiments with different architectures can be made and the results of various modifications can be examined elaborately. Another threat to the internal validity may be that the results could be more generally validated by performing analysis for more diverse UIs. However, we determined the types of UIs, four widely used categories of UIs distilled from the available data set.
Finally, as a threat to the external validity of the study, the lack of verification of the approach with the existing visual complexity metrics might be pointed out. A metric set consisting of more than one metric could have been determined as baseline and the results obtained from both the existing metrics and the proposed method could have been compared. However, to the best of our knowledge, there is no such a metric set in the literature that has proven itself in this regard. In addition, almost all of the visual complexity metrics existing were similarly verified by participants' evaluations. For this reason, we thought that it would be a more accurate method to verify the method by asking the participants directly. Nevertheless, we believe that compiling other the solutions in the literature and carrying out a comparison study could reveal more insights. Another potential improvement could be to expand the scope of the survey with more participants and sample images.
Deep learning, one of the methods that can be used for visual complexity analysis for mobile UIs, is explored in this study. Accordingly, mobile UI classification models have been developed with transfer learning of pre-trained deep learning models. In order to measure and validate the proposed approach, a survey study consisting of 98 participants was conducted. When both the ground truths obtained from the participants and the results obtained from the deep learning models are compared, it has been shown that visual complexity evaluations agree 74% for mobile UIs belonging to the different categories and 67.4% for mobile UIs belonging to the same category. Therefore deep learning models encode some information about the complexity of the UIs, however, the location and better interpretation of this information remains to be further investigated.
With this study, it has been shown that the complexity of mobile UIs can be measured by simulating human perception with the help of the pre-trained neural networks. As a result, it can be easier for mobile application developers or UI/UX designers to make predictive inferences about the perception of their designs. In this way, the UI design process, which is already tedious and arduous, can be managed more efficiently and effectively.
[1] Snodgrass, J.G., Vanderwart, M. (1980). A standardized set of 260 pictures: norms for name agreement, image agreement, familiarity, and visual complexity. Journal of experimental psychology: Human Learning and Memory, 6(2): 174-215. https://doi.org/10.1037/0278-7393.6.2.174
[2] Heaps, C., Handel, S. (1999). Similarity and features of natural textures. Journal of Experimental Psychology: Human Perception and Performance, 25(2): 299-320. https://doi.org/10.1037/0096-1523.25.2.299
[3] Donderi, D.C. (2006). Visual complexity: A review. Psychological Bulletin, 132(1): 73-97. https://doi.org/10.1037/0033-2909.132.1.73
[4] Riegler, A., Holzmann, C. (2018). Measuring visual user interface complexity of mobile applications with metrics. Interacting with Computers, 30(3): 207-223. https://doi.org/10.1093/iwc/iwy008
[5] Miniukovich, A., Sulpizio, S., De Angeli, A. (2018). Visual complexity of graphical user interfaces. In Proceedings of the 2018 International Conference on Advanced Visual Interfaces, 1-9. https://doi.org/10.1145/3206505.3206549
[6] Bakaev, M., Heil, S., Khvorostov, V., Gaedke, M. (2018). Auto-extraction and integration of metrics for web user interfaces. Journal of Web Engineering, 17(6): 561-590. https://doi.org/10.13052/jwe1540-9589.17676
[7] Soui, M., Chouchane, M., Mkaouer, M.W., Kessentini, M., Ghedira, K. (2020). Assessing the quality of mobile graphical user interfaces using multi-objective optimization. Soft Computing, 24(10): 7685-7714. https://doi.org/10.1007/s00500-019-04391-8
[8] Mao, Y. (2019). User interface evaluation with machine learning methods. Doctoral dissertation. https://hdl.handle.net/2027.42/149942.
[9] Xiao, B., Duan, J., Liu, X., Zhu, Y., Wang, H. (2018). Evaluation of Image Complexity Based on SVOR. International Journal of Pattern Recognition and Artificial Intelligence, 32(07): 1854020. https://doi.org/10.1142/S0218001418540204
[10] Fernandez-Lozano, C., Carballal, A., Machado, P., Santos, A., Romero, J. (2019). Visual complexity modelling based on image features fusion of multiple kernels. Peer J., 7: e7075. http://doi.org/10.7717/peerj.7075
[11] Rahane, A.A., Subramanian, A. (2020). Measures of complexity for large scale image datasets. In 2020 International Conference on Artificial Intelligence in Information and Communication (ICAIIC), pp. 282-287. http://doi.org/10.1109/ICAIIC48513.2020.9065274
[12] Luo, X.J. (2021). Three-dimensional image quality evaluation and optimization based on convolutional neural network. Traitement du Signal, 38(4): 1041-1049. https://doi.org/10.18280/ts.380414
[13] Simonyan, K., Zisserman, A. (2014). Very deep convolutional networks for large-scale image recognition. arXiv preprint arXiv:1409.1556. https://doi.org/10.48550/arXiv.1409.1556
[14] Huang, G., Liu, Z., Van Der Maaten, L., Weinberger, K. Q. (2017). Densely connected convolutional networks. In Proceedings of the IEEE Conference on Computer Vision and Pattern Recognition, pp. 4700-4708. https://doi.org/10.1109/CVPR.2017.243
[15] Sandler, M., Howard, A., Zhu, M., Zhmoginov, A., Chen, L.C. (2018). MobileNetV2: Inverted residuals and linear bottlenecks. In Proceedings of the IEEE Conference on Computer Vision and Pattern Recognition, pp. 4510-4520. https://doi.org/10.1109/CVPR.2018.00474
[16] Szegedy, C., Liu, W., Jia, Y., Sermanet, P., Reed, S., Anguelov, D., Rabinovich, A. (2015). Going deeper with convolutions. In Proceedings of the IEEE Conference on Computer Vision and Pattern Recognition, pp. 1-9. https://doi.org/10.1109/CVPR.2015.7298594
[17] He, K., Zhang, X., Ren, S., Sun, J. (2016). Deep residual learning for image recognition. In Proceedings of the IEEE Conference on Computer Vision and Pattern Recognition, pp. 770-778. https://doi.org/10.1109/CVPR.2016.90
[18] Wertheimer, M. (1938). Laws of organization in perceptual forms. In: Ellis WD (ed) A source book of Gestalt psychology, Kegan Paul, Trench, Trubner&Company, 71-88. https://doi.org/10.1037/11496-005
[19] Voulodimos, A., Doulamis, N., Bebis, G., Stathaki, T. (2018). Recent developments in deep learning for engineering applications. Computational Intelligence and Neuroscience, 2018: Article ID 8141259. https://doi.org/10.1155/2018/8141259
[20] Wiley, V., Lucas, T. (2018). Computer vision and image processing: a paper review. International Journal of Artificial Intelligence Research, 2(1): 29-36. https://doi.org/10.29099/ijair.v2i1.42
[21] Chai, J., Zeng, H., Li, A., Ngai, E.W. (2021). Deep learning in computer vision: A critical review of emerging techniques and application scenarios. Machine Learning with Applications, 6: 100134. https://doi.org/10.1016/j.mlwa.2021.100134
[22] Akca, E., Tanriöver, Ö.Ö. (2021). A comprehensive appraisal of perceptual visual complexity analysis methods in GUI design. Displays, 69: 102031. https://doi.org/10.1016/j.displa.2021.102031
[23] Michailidou, E., Eraslan, S., Yesilada, Y., Harper, S. (2021). Automated prediction of visual complexity of web pages: Tools and evaluations. International Journal of Human-Computer Studies, 145: 102523. https://doi.org/10.1016/j.ijhcs.2020.102523
[24] Wu, O., Hu, W., Shi, L. (2013). Measuring the visual complexities of web pages. ACM Transactions on the Web (TWEB), 7(1): 1-34. https://doi.org/10.1145/2435215.2435216
[25] Koch, J., Oulasvirta, A. (2016). Computational layout perception using gestalt laws. In Proceedings of the 2016 CHI Conference Extended Abstracts on Human Factors in Computing Systems, 1423-1429. https://doi.org/10.1145/2851581.2892537
[26] Bakaev, M., Heil, S., Khvorostov, V., Gaedke, M. (2018). HCI vision for automated analysis and mining of web user interfaces. In International Conference on Web Engineering, pp. 136-144. https://doi.org/10.1007/978-3-319-91662-0_10
[27] Bakaev, M., Goltsova, E., Khvorostov, V., Razumnikova, O. (2019). Data compression algorithms in analysis of UI layouts visual complexity. In International Andrei Ershov Memorial Conference on Perspectives of System Informatics, pp. 167-184. https://doi.org/10.1007/978-3-030-37487-7_14
[28] Deka, B., Huang, Z., Kumar, R. (2016). ERICA: Interaction mining mobile apps. In Proceedings of the 29th Annual Symposium on User Interface Software and Technology, pp. 767-776. https://doi.org/10.1145/2984511.2984581
[29] Deka, B., Huang, Z., Franzen, C., Hibschman, J., Afergan, D., Li, Y., Kumar, R. (2017). Rico: A mobile app dataset for building data-driven design applications. In Proceedings of the 30th Annual ACM Symposium on User Interface Software and Technology, pp. 845-854. https://doi.org/10.1145/3126594.3126651
[30] von Wangenheim, C.G., Porto, J.V.A., Hauck, J.C., Borgatto, A.F. (2018). Do we agree on user interface aesthetics of Android apps? arXiv preprint arXiv:1812.09049. https://doi.org/10.48550/arXiv.1812.09049
[31] Lima, A.L.S., Martins, O.P., von Wangenheim, C.G., von Wangenheim, A., Borgatto, A.F., Hauck, J.C.R. (2022). Automated assessment of visual aesthetics of Android user interfaces with deep learning. In Proceedings of the 21st Brazilian Symposium on Human Factors in Computing Systems (IHC '22). Association for Computing Machinery, New York, NY, USA, pp. 1-11. https://doi.org/10.1145/3554364.3559113
[32] Saraee, E., Jalal, M., Betke, M. (2018). Savoias: A diverse, multi-category visual complexity dataset. arXiv preprint arXiv:1810.01771. https://doi.org/10.48550/arXiv.1810.01771
[33] Saraee, E., Jalal, M., Betke, M. (2020). Visual complexity analysis using deep intermediate-layer features. Computer Vision and Image Understanding, 195: 102949. https://doi.org/10.1016/j.cviu.2020.102949
[34] Jiang, Z., Yin, H., Luo, Y., Gong, J., Yang, Y., Lin, M. (2019). Quantitative analysis of mobile application user interface design. In 2019 IEEE 38th International Performance Computing and Communications Conference (IPCCC), pp. 1-8. https://doi.org/10.1109/IPCCC47392.2019.8958722
[35] Dhengre, S., Mathur, J., Oghazian, F., Tan, X., McComb, C. (2020). Towards enhanced creativity in interface design through automated usability evaluation. In ICCC, 366-369.
[36] Tan, M., Le, Q. (2019). EfficientNet: Rethinking model scaling for convolutional neural networks. In International Conference on Machine Learning, pp. 6105-6114.
[37] Lindgaard, G., Fernandes, G., Dudek, C., Brown, J. (2006). Attention web designers: You have 50 milliseconds to make a good first impression! Behaviour & Information Technology, 25(2): 115-126. https://doi.org/10.1080/01449290500330448
[38] Reinecke, K., Yeh, T., Miratrix, L., Mardiko, R., Zhao, Y., Liu, J., Gajos, K.Z. (2013). Predicting users' first impressions of website aesthetics with a quantification of perceived visual complexity and colorfulness. In Proceedings of the SIGCHI Conference on Human Factors in Computing Systems, pp. 2049-2058. https://doi.org/10.1145/2470654.2481281
[39] Miniukovich, A., De Angeli, A. (2014). Visual impressions of mobile app interfaces. In Proceedings of the 8th Nordic Conference on Human-Computer Interaction: Fun, Fast, Foundational, pp. 31-40. https://doi.org/10.1145/2639189.2641219