Ahmed A. Alsheikhy* | Yahia F. Said | Tawfeeq Shawly
© 2022 IIETA. This article is published by IIETA and is licensed under the CC BY 4.0 license (http://creativecommons.org/licenses/by/4.0/).
OPEN ACCESS
Health providers use the ECG machine to get information about the heart. This information plays a significant role since it tells them about the status of the heart. The ECG machine presents this information in a waveform. During the Covid-19 pandemic, all governments have placed numerous rules and policies to protect people from the virus and from spreading it. One of the rules and policies is to prevent touching surfaces in public places. However, in health care centers, touching surfaces can’t be avoided completely since there is a need to touch them or place some wires on the human body such as placing wires to use the ECG machine. In Saudi Arabia, the government has placed a policy in all its buildings, public places, and the private sector to measure the temperature at the entrance. Due to this situation, the idea has come into mind to have a touchless method to measure the heartbeat rate. In this paper, proposing a feasible and reliable method to estimate a continuous heartbeat rate is presented. It uses a face recognition approach to predict the heart pulse continuously in real-time according to colors intensity measurement. Using a segmentation algorithm is involved since the approach takes its input from a video or an image. Several experiments have been conducted on volunteers to verify the obtained results and measure their relative errors. Consequently, the errors are less than 7% which is quite acceptable. At the end of this article, a comparative assessment is performed between the presented approach and some works from literature. This assessment is conducted based on the methodologies being utilized and applied and Mean Absolute Error (MAE). Furthermore, it shows whether those methods require physical contact or not. The obtained results indicate that the implemented system herein outperforms other state-of-the-art methods.
heartbeat, artificial intelligence, face recognition, heart rate, machine learning, image segmentation, cardiology, cardiovascular
Measuring a human vital sign such as heart pulse is a very crucial task. Physicians and healthcare providers rely on it to obtain some information about patients’ conditions. High heartbeat rate or low rate indicates that there is an issue and physicians should investigate to see the real causes. In most cases, physicians and healthcare providers use equipment to measure the heartbeat rate.
ECG refers to Electrocardiogram which is an electrical waveform to display signals that are provided by the heart [1, 2]. These signals represent the heart’s activities. The wave is produced by placing adhesive electrodes on the skin. The purpose of these electrodes is to predict small electrical changes that occur due to cardiac muscle movements [1-4]. Those movements are the result of repolarization and depolarization during every cardiac cycle [3-5].
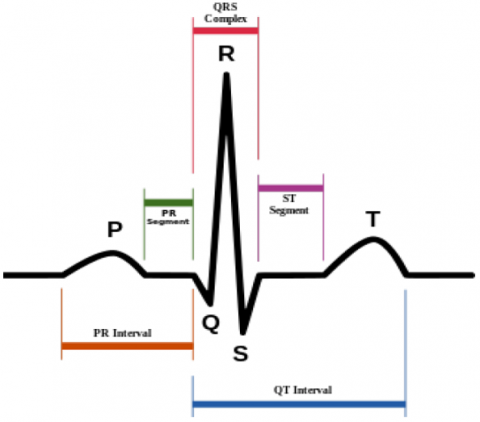
ECG refers to the heart function which is represented by the relationship between amplitude and phase as depicted in Figure 1. Any abnormal activities or functions of the heart are seen as a deviation from the standard amplitude-phase relationship [2]. Consequently, this deviation indicates the presence of any abnormal activity [2, 6-9].
Normal ECG signal consists of the following components as depicted in Figure 1, P wave, QRS complex, T wave, R wave and U wave. The P wave refers to the atrial depolarization [2, 4, 5]. The ventricular depolarization is represented by the QRS complex. The T wave describes the ventricular repolarization [2, 4]. The R wave refers to the peak of the signal and represents the positive deflection [2, 6, 10]. And the U wave refers to the papillose muscle repolarization. The Q and S waves as shown in Figure 1 occur before and after the R wave respectively.
In Figure 1, PR interval refers to the time needed for the electrical impulse to go from the sinus node to the AV node [2] and it is represented by the orange color. The QT interval, which is depicted by the blue color in Figure 1, represents the ventricular depolarization, repolarization and contraction [8, 9-12].
Recently, researchers have developed and implemented contactless systems to monitor heartbeat rate continuously. These systems and applications depend on contactless sensors to measure the heart rate [3, 4]. The contactless applications provide no restrictions on mobility. Thus, users are free to move anywhere without being afraid of losing the measurement. In addition, these systems and applications are usable for patients who suffer from skin irritations [4, 13].
The contactless systems provide real-time data for the heart rate and are required for the timely detection of abnormal activities [3-5]. Healthcare providers and patients rely on these systems to detect any abnormal activity which could lead to dangerous conditions such as drowsiness [4, 13-17].
Variability of the heartbeat rate is used by physicians and healthcare providers in numerous applications such as disease verification and detection of stress [5]. In addition, this variation represents the ability of the heart to react and respond to several stimuli from the surrounding environment. In addition, it represents sensitive signs of any existing heart disease such as hypertension or coronary disease [4, 5, 18-23].
The flowing of blood affects how the light is reflected through peoples’ skin [5]. This reflection is captured and utilized to predict the heartbeat rate without the need to contact the skin [5]. This variation of the light reflection is the key factor for the heart rate estimation in this article [24-32]. Details are presented in section 3.
Figure 1. Typical ECG signal [2]
Object detection algorithms are considered a key factor in numerous applications to detect faces. Viola-Jones algorithm is one of these approaches and it is used and utilized in Computer Vision (CV) field. This method was invented and named in 2001 by two researchers Paul Viola and Michael Jones. It is a powerful tool in terms of face detection. However, its speed is slower when compared with other methods. This algorithm is utilized in this article to detect face.
In this research, a method to plot a wave that is used to predict the heartbeat rate from motion is presented. This method uses a motion-based approach which is extracted from a video along with a face recognition method. This algorithm produces two outputs which are the plotted signal and the estimated heartbeat rate.
Developing a contactless approach to plot the wave and predict the heart pulse rate from that signal is the motivation for this research due to the COVID-19 pandemic and the variants of the Corona Virus. This helps health care providers to have an initial indication about the patient’s heart without the need to place wires on their skins or use the traditional way to measure the heart pulse.
The contribution in this paper is presented by developing and proposing the contactless method to plot the intensity colors signal and estimate the heart pulse. This approach is developed using MATLAB as a programming platform and as a simulation tool as well. The remaining of the paper is organized as follows: A literature review is presented in the next section and section 3 provides details about the developing approach. Discussion and results are provided in section 4 and the conclusion is given in section 5.
Hamood et al. [2] developed and implemented a system to diagnose heart abnormal activities. This system was composed of three parts. An analog circuit along with Arduino were used. It worked by comparing the detecting ECG with a standard plot. Any difference in the duration or the amplitude was indicated as an abnormal activity by that system. it required placing 3-leads on specified locations on the human body to acquire the ECG signal while the proposed approach herein is the contactless method as there is no need to use any type of wires to generate the intensity signal. Readers can refer to the study of Hamood et al. [2] for additional information.
Silva et al. [3] proposed an approach to be used as a validation method for a heartbeat separation. It used Convolutional Neural Networks (CNNs) to find patterns of a heart pulse and classified them into two groups or classes. The classification was performed using seven layers in the CNNs. Two databases were involved and those DBs were namely MIT-BIH and CYBHI respectively. The authors used the Pam-Tompkins algorithm as a baseline to evaluate their method. In addition, their approach was contact-based since two wires were placed on the human body to find the ECG signal while the proposed approach in this paper is the contactless-based method since plotting the intensity signal is done without using any type of wires. Interested readers can have more information from the study of Silva et al. [3].
Malesevic et al. [4] developed a method to use Doppler radar to detect the heartbeat with the support of the Neural Networks (NNs). This approach took its inputs for the radar and processed them with minimal latency. 21 healthy volunteers agreed to be tested using that algorithm. However, this algorithm had a limitation since all volunteers were sitting and prevented from making extreme activities. The radar worked based on detecting the signals from objects. However, this method faces a big challenge when detections come from different sources which might affect their obtained results. Herein, the developed and the proposed algorithm can be applied for any type of movement and there is no condition that should be applied before using it.
Darzi et al. [5] proposed two methods to detect eyes to determine whether they were open or closed and determine the heart pulse rate. The main objective was to determine whether a driver was sleeping or not. The first method used an Artificial Neural Network (ANN) by feeding pictures of open and closed eyes. After that, those pictures were classified and labeled using Linear Discriminant Analysis (LDA). Lastly, the blink duration was estimated using the classified images. The heart pulse estimation was achieved by using the Independent Component Analysis (ICA) technique and a chrominance-based method. Both approaches had a mean loss between 13 and 16 beats per minute for the heart pulse rate computation. LDA achieved 79% to 91% of accuracy while ANN showed a better accuracy as it was between 78% to 92%. Furthermore, these methods have a drawback as their heart pulse evaluation fluctuates a lot while the developed approach in this paper provides a better result since its heartbeat evaluation is stable and more accurate. The obtained values have maximum error of less than 6%. Readers are referred to the study of Darzi et al. [5] for more information.
Lima et al. [6] developed a method to predict the heartbeat rate instantaneously based on using the blood flow as a function according to the variation of skin tone. The Viola-Jones algorithm was used to detect the face then Identified the traceable characteristics and lastly performed the face tracking using the eigenvalues. The authors claimed that the face detection feature generated the most satisfactory characteristics. A slowness was noticed in the processing due to the use of temporal filtering since it was not optimized. In the proposed algorithm in this research, the processing time is faster than the developed one in the study of Lima et al. [6] as the captured images are rescaled to a proper size to speed up the processing time.
Kabari and Onwuka [8] presented a method to detect Bradycardia based on utilizing digital signal filtering using MATLAB to determine the ECG wave. The heart pulse estimated is performed by focusing on the peaks of the obtained signal as the authors utilized the peaks of R-R intervals while the presented method herein utilizes the color intensity graph to find the peaks and determine the heartbeat rate from those values. Readers can refer to the study of Kabari and Onwuka [8] for additional information.
Naik et al. [13] proposed a contactless approach to detect heart pulse using signal and image processing techniques. This approach used color change and frequency change methods to detect the heartbeat rate. Fourier transformation technique was used to rectify the heart pulse rate. However, no results were provided in the study of Naik et al. [13] so it is hard for researchers to judge it properly. Herein, several experiments were conducted on volunteers to show the effectiveness of it.
Singh et al. [15] presented a method to measure cardiac pulse automatically using a webcam. It started by detecting the face region then RGB traces were performed. Then, Fourier Transformation was applied to estimate the power spectrum from the extracted features of RGB traces. Kalman-Lucas-Tomasi (KLT) for face recognition was used to detect faces from video frames. This approach required much time since several operations were involved while the proposed method in this research takes less execution time as shown by the simulation experiments. Readers can refer to the study of Singh et al. [15] for additional information.
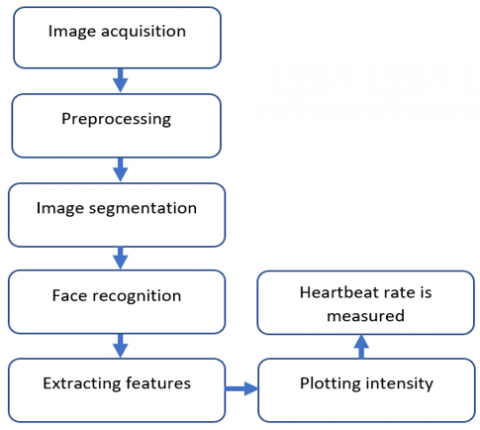
The proposed approach is contactless since there is no need to measure the heartbeat by the traditional method or to use an appropriate device. In addition, it plots the intensity signal representation which contains peaks and bottoms. The peaks are utilized to predict the heartbeat rate. Figure 2 illustrates the process of the proposed method. It begins with image acquisition from video frames. After that, the number of frames is measured. The segmentation process is performed based on the measured number of frames. In this process, rescaling is done to speed up the execution time. Then, face recognition from video frames is applied to extract some features such as intensity based on RGB colors. After that, finding total intensity is performed to find the peaks and bottoms from the resulted wave. Lastly, the heartbeat rate is computed using the peaks information from the obtained graph.
The implemented method provides numerous features and advantages which are summarized as follows:
(1) It is a touchless approach since there is no need for any type of contact or touch of the considered target.
(2) It can be applied anywhere and anytime without the need for any special equipment or hardware.
(3) Only a camera is required to provide real-time photos or video streams of the target.
(4) It deals with the color intensity of skin.
(5) It is cheap in terms of cost since it just requires the camera and a hosting machine.
(6) Its execution time is acceptable.
There is only one disadvantage from this algorithm which is it deals only with one detected face. The resolution to this drawback is considered in future work.
Figure 2. Flowchart of the proposed algorithm
Initial heart pulse rate is set to 60 per minute as it is the normal value used by the cardiology physicians. The plot is performed every 50ms in order to capture more detection in the intensity feature to get accurate graph.
Table 1 lists all predicted heart pulse rate from the proposed algorithm from a source file that lasts for 19 seconds in the study of Ngo [28]. The presented algorithm was applied on a video file that runs for 19 seconds to validate its workflow and how it produces its outputs. The algorithm extracts video frames from that file to process each frame and extract its peak. All frames are processed one by one and that is why we call it a continuous since the presented algorithm computes the heart rate in every frame from the detected peak.
Table 1. Predicted heartbeat rate every second
|
Time |
Predicted heart pulse rate |
|
1 |
113 |
|
2 |
86 |
|
3 |
75 |
|
4 |
75 |
|
5 |
73 |
|
6 |
69 |
|
7 |
67 |
|
8 |
65 |
|
9 |
64 |
|
10 |
63 |
|
11 |
61 |
|
12 |
62 |
|
13 |
61 |
|
14 |
61 |
|
15 |
62 |
|
16 |
61 |
|
17 |
63 |
|
18 |
63 |
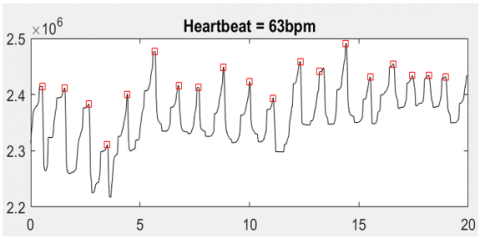
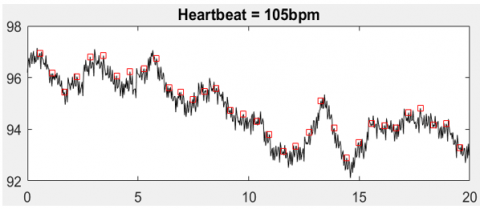
Almost all values of the predicted heart pulse rate lay in the normal range which is between 60bpm and 100bpm. Figure 3 illustrates the obtained graph which has peaks and bottoms; the time is represented in the X-axis while the Y-axis refers to the values of estimated intensity of colors from images or videos. The black line refers to the detected signal from intensity while the red squares indicate the peaks values.
The algorithm is illustrated as follows:
|
Algorithm: Plotting intensity Wave and heartbeat rate prediction |
|
Input: a video file to read from or from an image. Output: the intensity colors signal and continuous heartbeat rate per minute prediction.
|
Figure 3. Obtained intensity graph
Numerous experiments were conducted on volunteers to predict their heart rhythm rate using the proposed algorithm in MATLAB. Due to their requests to hide their identities for privacy, so only obtained results are provided. The volunteers are from both genders and five of them are children. The developed method was tested and validated on a machine that runs Windows 11 Pro. The specifications of the hosting machine are an 8th generation of Intel chip with clock speed of 2.4GHz and 16GB or RAM. Table 2 shows the numbers of adults and minors among the volunteers.
Table 2. Numbers of adults and minors
|
Volunteers |
|||
|
Adults |
Minors |
||
|
Male |
Female |
Male |
Female |
|
10 |
8 |
3 |
2 |
The participants in this research were randomly selected during a daylight between 12pm and 7pm. Unfortunately, only 23 volunteers agreed to be involved as shown in Table 2. The participants were in a good physical condition and none of them suffered from any type of mental health such as anxiety. All adults were in ages between 20 and 48 years old. Furthermore, we focused our analysis and measurements on the activities that have a great impact on heart pulse such as performing exercise or cleaning. However, one volunteer was just sitting on a couch during the experiments.
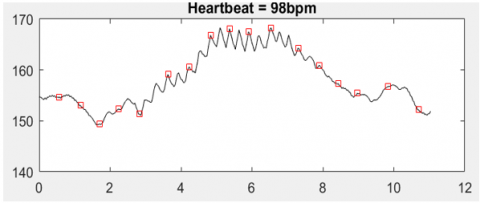
Figure 4 and Figure 5 illustrate the plotting graphs for two volunteers. Note that Figure 4 is for a volunteer who was riding a bicycle while Figure 5 for another volunteer who was performing some exercises.
Figure 4. The intensity signal
Figure 5. The color intensity signal
Figure 4 clearly shows that there are some peak values that were undetected. This could happen because the plot occurs every 50ms, so decreasing this time will improve the peaks detection. However, setting the plot time to be dynamically degrades the performance significantly as it mainly depends on the number of reading frames from every video file and its length of it. Since the video files are different in length, so, the plotting time varies which increases the execution time which is considered a drawback. To avoid this situation, the plotting time is set to occur every 50ms.
Table 3. Mean values of the prediction vs. the actual
|
Volunteers |
|||
|
Adults |
|||
|
Gender |
Prediction |
Actual |
Error % |
|
Male |
98 |
101 |
2.97 |
|
Male |
105 |
106 |
0.94 |
|
Male |
64 |
61 |
4.92 |
|
Male |
76 |
74 |
2.63 |
|
Male |
63 |
66 |
4.55 |
|
Male |
69 |
65 |
6.15 |
|
Male |
82 |
79 |
3.80 |
|
Male |
70 |
67 |
4.48 |
|
Male |
86 |
82 |
4.88 |
|
Male |
95 |
99 |
4.04 |
|
Female |
67 |
65 |
3.07 |
|
Female |
72 |
68 |
5.88 |
|
Female |
66 |
69 |
4.35 |
|
Female |
65 |
62 |
4.84 |
|
Female |
102 |
97 |
5.15 |
|
Female |
92 |
87 |
5.75 |
|
Female |
88 |
85 |
3.53 |
|
Female |
74 |
70 |
5.71 |
|
Minors |
|||
|
Gender |
Prediction |
Actual |
Error % |
|
Female |
85 |
83 |
2.41% |
|
Female |
71 |
68 |
4.41% |
|
Male |
88 |
83 |
6.02% |
|
Male |
94 |
100 |
6.00% |
|
Male |
109 |
114 |
4.36% |
The mean value of heart rhythm rate per second is written on the top of the previous three graphs. Table 3 lists the mean values of the predicted heartbeat rate for all volunteers versus the actual ones. In addition, the percentage of error between the actual and estimated values are provided as well. Furthermore, this table indicates that the maximum obtained error among all volunteers is less than 7% which seems to be acceptable.
The assessment study between the developed and proposed system and other developed approaches in the literature is conducted and shown in Table 4. This assessment evaluates three criteria which are the method being used and utilized, MAE, and whether every method or system requires a physical contact or not to estimate the heartbeat rate. All results are tabulated in Table 4. This table lists the works that were developed with their references’ numbers, the methodologies being used, MAE, and a way to predict the considered parameter.
The obtained results as shown in Table 4 give an indication that the developed approach is capable to predict acceptable figures and these values can be seen as promising toward having a contactless method in cardiology to measure heart pulse rate immediately and effectively.
The proposed algorithm has a drawback since it processes and predicts only for one person. If videos contain more than one person, then only one value is predicted.
The future work is to plot proper intensity signals for several patients so physicians can rely on it instead of waiting to perform it by physical contact.
Table 4. Comparison of three-performance metrics
|
Developed method |
Method being used |
MAE |
Physical contact or contactless |
|
Mayor et al., 2021 [1] |
CEPS |
Not mentioned |
Not mentioned |
|
Hamood et al., 2020 [2] |
ECG and Arduino |
Not mentioned |
Physical contact |
|
Silva et al., 2020 [3] |
CNN |
0.05 |
Physical contact |
|
Malešević et al., 2020 [4] |
Continuous-wave doppler radar and ANN |
Not mentioned |
Contactless |
|
Darzi et al., 2019 [5] |
ANN and LDA |
14.5 |
Contactless |
|
Lima et al., 2019 [6] |
Variation of skin tone |
Not mentioned |
Contactless |
|
van der Kooij and Naber, 2019 [7] |
Pixel changes of human skin surfaces |
Not mentioned |
Contactless |
|
The proposed system |
Image processing and the color intensity signal |
3.462 |
Contactless |
The authors extend their appreciation to the Deputyship for Research & Innovation, Ministry of Education in Saudi Arabia for funding this research work through the project number IF_2020_NBU_237.
[1] Mayor, D., Panday, D., Kandel, H.K., Steffert, T., Banks, D. (2021). Ceps: An open access MATLAB graphical user interface (GUI) for the analysis of complexity and entropy in physiological signals. Entropy, 23(3): 321. https://doi.org/10.3390/e23030321
[2] Hamood, S.A., Al-Hilali, A.A., Jumaa, L.F. (2020). Heart irregularities detection based ECG signals. Medico Legal Update, 20(2): 752-758.
[3] Silva, P., Luz, E., Silva, G., Moreira, G., Wanner, E., Vidal, F., Menotti, D. (2020). Towards better heartbeat segmentation with deep learning classification. Scientific Reports, 10(1): 1-13. https://doi.org/10.1038/s41598-020-77745-0
[4] Malešević, N., Petrović, V., Belić, M., Antfolk, C., Mihajlović, V., Janković, M. (2020). Contactless real-time heartbeat detection via 24 GHz continuous-wave Doppler radar using artificial neural networks. Sensors (Basel), 20(8): 2351. https://doi.org/10.3390/s20082351
[5] Darzi, E., Mohammadie-Zand, A., Soltanian-Zadeh, H. (2019). Using image-extracted features to determine heart rate and blink duration for driver sleepiness detection. arXiv preprint arXiv:1911.01333.
[6] Lima, A.T.M., Gusmão, D.B., Costa, M.V.C. (2019). Remote detection of heart beat and heart rate from video sequences. In XXVI Brazilian Congress on Biomedical Engineering, pp. 437-440. https://doi.org/10.1007/978-981-13-2517-5_66
[7] van der Kooij, K.M., Naber, M. (2019). An open-source remote heart rate imaging method with practical apparatus and algorithms. Behavior Research Methods, 51(5): 2106-2119. https://doi.org/10.3758/s13428-019-01256-8
[8] Kabari, L.G., Onwuka, U.C. (2019). Bradycardia detection using ECG signal processing and MATLAB. European Journal of Engineering and Technology Research, 4(3): 163-165. https://doi.org/10.24018/ejeng.2019.4.3.1207
[9] Vollmer, M. (2019). HRVTool-an open-source MATLAB toolbox for analyzing heart rate variability. Computing in Cardiology (CinC), 46: 1-4. https://doi.org/10.22489/CinC.2019.032
[10] Moeyersons, J., Amoni, M., Van Huffel, S., Willems, R., Varon, C. (2019). R-DECO: An open-source MATLAB based graphical user interface for the detection and correction of R-peaks. PeerJ Computer Science, 5: e226. https://doi.org/10.7717/peerj-cs.226
[11] Kanakia, K., Patil, S., Sabnis, S., Shah, V. (2018). Emotion and heartbeat detection using image processing. International Journal of Scientific and Engineering Research (IJSER), 9(3): 43-47.
[12] Wang, C., Pun, T., Chanel, G. (2018). A comparative survey of methods for remote heart rate detection from frontal face videos. Frontiers in Bioengineering and Biotechnology, 6(33): 1-16. https://doi.org/10.3389/fbioe.2018.00033
[13] Naik, N.A., Patel, B.T., Parulekar, A.J., Patil, M. (2018). Heart beat sensing without physical contact using signal and image processing. IOSR Journal of Engineering (IOSRJEN), 13-16.
[14] Savalia, S., Acosta, E., Emamian, V. (2017). Classification of cardiovascular disease using feature extraction and artificial neural networks. Journal of Biosciences and Medicines, 5(11): 64-79. https://doi.org/10.4236/jbm.2017.511008
[15] Singh, S.P., Rathee, N., Gupta, H., Zamboni, P., Singh, A.V. (2017). Contactless and hassle free real time heart rate measurement with facial video. Journal of Cardiac Critical Care TSS, 1(01): 024-029. https://doi.org/10.1055/s-0037-1604202
[16] Zaman, R., Cho, C.H., Hartmann-Vaccarezza, K., Phan, T.N., Yoon, G., Chong, J.W. (2017). Novel fingertip image-based heart rate detection methods for a smartphone. Sensors, 17(2): 358. https://doi.org/10.3390/s17020358
[17] Lin, Y.C., Chou, N.K., Lin, G.Y., Li, M.H., Lin, Y.H. (2017). A real-time contactless pulse rate and motion status monitoring system based on complexion tracking. Sensors, 17(7): 1490. https://doi.org/10.3390/s17071490
[18] Yang, C., Cheung, G., Stankovic, V. (2017). Estimating heart rate and rhythm via 3D motion tracking in depth video. IEEE Transactions on Multimedia, 19(7): 1625-1636. https://doi.org/10.1109/TMM.2017.2672198
[19] Demski, A.J., Soria, M.L. (2016). ECG-kit: A MATLAB toolbox for cardiovascular signal processing. Journal of Open Research Software, 4(1): e8. http://doi.org/10.5334/jors.86
[20] Rahman, H., Ahmed, M.U., Begum, S., Funk, P. (2016). Real time heart rate monitoring from facial RGB color video using webcam. The 29th Annual Workshop of the Swedish Artificial Intelligence Society (SAIS).
[21] Koprowski, R. (2016). Blood pulsation measurement using cameras operating in visible light: Limitation. Biomedical Engineering Online, 113(22): 1-15. http://doi.org/10.1186/s12938-016-0232-8
[22] John, A.A., Subramanian, A.P., Jaganathan, S.K., Sethuraman, B. (2015). Evaluation of cardiac signals using discrete wavelet transform with MATLAB graphical user interface. Indian Heart Journal, 549-551.
[23] Al-Ziarjawey, H.A.J., Cankaya, I. (2015). Heart rate monitoring and PQRST detection based on graphical user interface with MATLAB. International Journal of Information and Electronics Engineering, 5(4): 311-316.
[24] Hamiane, M., Al-Hedidi, I.Y. (2015). Automatic detection of abnormalities in ECG signals: A MATLAB study. International Journal of Biology and Biomedical Engineering, 9: 121-126.
[25] Patel, P.G., Warrier, J.S., Bagal, U.R. (2012). ECG analysis and detection of arrhythmia using MATLAB. International Journal of Innovative Research and Development, 1(11): 59-68.
[26] Parák, J., Havlík, J. (2011). ECG signal processing and heart rate frequency detection methods. Proceedings of Technical Computing Prague, 8, 2011.
[27] https://www.ucsfbenioffchildrens.org/medical-tests/pulse, accessed on 12 May, 2022.
[28] Ngo, N. (2022). Heart rate measurement using a single RGB camera. Mathworks, MATLAB Central File Exchange.
[29] Heather, G. (2022). Calculate heart rate from electrocardiogram data. Mathworks, MATLAB Central File Exchange.
[30] Unakafov, A.M. (2018). Imaging photoplethysmogram extraction and pulse rate estimation. Mathworks, MATLAB Central File Exchange.
[31] Rizal, A., Siregar, F.D.A.A., Fauzi, H.T. (2022). Obstructive sleep apnea (OSA) classification based on heart rate variability (HRV) on electrocardiogram (ECG) signal using support vector machine (SVM). Traitement du Signal, 39(2): 469-474. https://doi.org/10.18280/ts.390208
[32] Shah, S.A.A., Habib, N., Nadeem, M.S.A., Alshdadi, A.A., Alqarni, M., Aziz, W. (2020). Extraction of dynamical information and classification of heart rate variability signals using scale based permutation entropy measures. Traitement du Signal, 37(3): 355-365. https://doi.org/10.18280/ts.370302