Shouhui He* | Yan Wang | Hongda Liu
© 2022 IIETA. This article is published by IIETA and is licensed under the CC BY 4.0 license (http://creativecommons.org/licenses/by/4.0/).
OPEN ACCESS
To sort out warehouse management problems in smart factories, smart warehousing and in-plant smart distribution systems are needed to achieve the goal of lean logistics and distribution in smart factories. There are still some pressing problems in the research on images of warehoused goods in intelligent logistics. For example, a solution hasn’t been found yet to recognise multiple types of warehoused goods in different shapes and colours; static vision image processing solutions have a poor performance in optimising recognition speed and classification accuracy. In response, this paper unveils a study on the image information recognition and classification of warehoused goods in intelligent logistics based on machine vision technology. It presents a process related to warehouse management in intelligent logistics and a corresponding system architecture. It also constructs a YOLOv3 model for the image information recognition and classification of warehoused goods in intelligent logistics. The paper elaborates on the prior box settings and loss function correction methods, and finishes optimising the YOLOv3 model. Experimental results verified the effectiveness of the constructed model.
machine vision, intelligent logistics, warehoused goods, image information recognition, goods classification
Following automated and digital factories, smart factories featuring the Internet of Things, safety monitoring systems, storage equipment management systems and storage operation information systems have become a development goal and direction for modern manufacturing enterprises [1-7]. In the actual operation of smart factories, warehousing and distribution have become the main factors restricting their development. To sort out warehouse management problems in smart factories, smart warehousing and in-plant smart distribution systems are needed to achieve the goal of lean logistics and distribution in smart factories [8-12]. Currently, there is less research related to smart warehousing and material distribution for manufacturing enterprises.
As an important link in the intelligent production line, intelligent logistics and warehouse management need to quickly obtain the number and name of the warehoused goods in the circumstances of stock-in, in-store processing, sorting, in-store packaging and stock-out, which can greatly enhance the efficiency of warehouse logistics management [13-18]. The identification and retrieval of goods in intelligent warehouse logistics based on machine vision technology is for obtaining the basic information of warehoused goods using the images captured by machine vision systems [19-22]. Considering the characteristics of warehoused goods in the application scenarios at smart factories, it is of practical significance to carry out research on image information recognition and classification of warehoused goods in intelligent logistics.
As deep learning advances, image processing applications have been extended to hazardous materials identification in security screening systems. Wang et al. [23] proposed a recognition algorithm based on generative adversarial networks, which can continuously train generative and discriminative models and collect blocked or too-small image data samples, and then generate images with high similarity for the purpose of detecting and tracking hidden or small dangerous goods. Experimental results show that this algorithm can effectively detect dangerous goods and greatly improve the tracking effect. Recent research has aroused interest in applying image classification techniques to automatically identify images of merchandise labels for the automation of retailers’ operations. Chen et al. [24] developed a lightweight attention network with a small size and comparable precision, namely MS-DenseNet, to identify the commodity label images. The proposed procedure achieved significant performance gain with an average accuracy of 97.60% on the identification of commodity label images task. Multi-modal cross-convolution or densely connected blocks have been introduced into classical deep learning networks with the aim of facilitating the recognition of image targets. However, these attempts have failed to satisfactorily extract detailed features from the original images. To address this issue, Zhao [25] explored the image target recognition based on multiregional features under hybrid attention mechanism. Specifically, a convolutional neural network (CNN) was established for extracting multiregional features based on the loss function of local feature aggregation. The model consists of three independent CNN modules, which are responsible for extracting the global multiregional features and the local features of different regions. The proposed network was proved effective through the training and testing on a self-developed sample set of surveillance video images. Li et al. [26] selected two deep convolutional neural networks (DCNNs), Faster R-CNN and CenterNet to complete the recognition task. Due to the lack of training data, a large number of simulated samples were generated considering the PST image characteristics. The simulated and real PST ICPs were then used to test the trained DCNNs. Experiment results show that the performance of CenterNet is better than Faster R-CNN and the image quality has a great impact on the recognition performance.
At present, experts and scholars at home and abroad have been doing more and more research on image information recognition, but there are still some pressing problems in the research on images of warehoused goods in intelligent logistics. For example, a solution hasn’t been found yet to recognise multiple types of warehoused goods in different shapes and colours; static vision image processing solutions have a poor performance in optimising recognition speed and classification accuracy. In response, this paper unveils a study on the image information recognition and classification of warehoused goods in intelligent logistics based on machine vision technology. In chapter 2, it presents a process related to warehouse management in intelligent logistics and a corresponding system architecture. It also constructs a YOLOv3 model for the image information recognition and classification of warehoused goods in intelligent logistics. Chapter 3 elaborates on the prior box settings and loss function correction methods, and finishes optimising the YOLOv3 model. Experimental results verified the effectiveness of the constructed model.
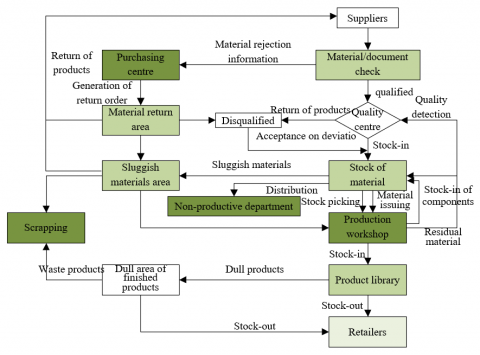
Smart factory needs to have a well-established intelligent warehouse logistics management system. The system regulates all intelligent warehouse logistics management processes, including logistics procurement, checking, quality inspection, stock-in, in-store processing, sorting, in-store packaging and stock-out. See Figure 1 for details.
Figure 1. Processes related to intelligent warehouse logistics management
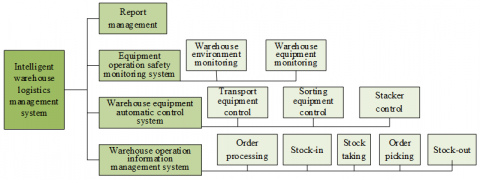
Figure 2. Intelligent warehouse logistics management system architecture
The intelligent warehouse management system consists of an Internet of Things, a safety monitoring system, a warehouse equipment management system, a warehouse operation information system and report management, which effectively enhances the orderliness and safety of warehouse management in a smart factory. Figure 2 gives the architecture of the intelligent warehouse logistics management system. It shows that the equipment operation safety monitoring system functions include warehouse environment monitoring and warehouse equipment monitoring. Warehouse equipment automatic control system functions include transport equipment control, sorting equipment control, stacker control. Warehouse operation management information system functions include order processing, stock-in, stocktaking, order picking and stock-out.
To address the problems of low accuracy and slow recognition in the recognition and retrieval of warehoused goods in intelligent logistics, this paper compares and analyses some of the network frameworks. Considering the stability and reliability of such recognition and retrieval, YOLOv3 is selected as the main framework for the image information recognition model in this paper.
The image information recognition model first divides the input images of warehoused goods into cells. Each cell will be predicted for Y goods target bounding boxes throughout the training and testing process of the recognition model. The bounding box size and position are denoted by (a,b,q,f), assuming that the coordinates of the centroid of the bounding box are represented by (a,b) and the width and height of the bounding box are represented by q and f. Assume that WH(GT) represents whether the predicted bounding box contains a warehoused goods target in intelligent logistics and ACCBBP represents the accuracy of the bounding box location. The following equation gives the formula for the confidence level of the bounding box.
$WH\left( GT \right)\times ACC_{BBP}^{{}},WH\left( GT \right)\in \left\{ 0,1 \right\}$ (1)
Assuming that the Z category probability values of the warehoused goods in intelligent logistics are given by WH(CLi |GT), each cell also needs to be predicted for WH(CLi |GT). The category confidence of each bounding box can be obtained by the following equation.
$W H\left(C L_i \mid G T\right) \times W H(G T) \times A C C_{B B P}=W H\left(C L_i\right) \times A C C_{B B P}$ (2)
Through the above processing, each cell on the warehoused goods images will predict Y×(4+1)+Z values. If one warehoused goods image is divided into a total of R×R cells, then after the processing it will output (Y×5+Z)×R×R length vector, so as to achieve the task of detecting the warehoused goods target in intelligent logistics.
The image information recognition model contains 24 convolutional layers, with convolutional kernels in two sizes of 1×1 and 3×3. The model also contains 4 pooling layers to compress the feature maps and 2 fully connected layers to output the final image category prediction results. The inclusion of the residual module makes it much less difficult to train the deep network. The expressions for the activation functions of the convolutional and fully-connected layers are given in the following equation.
$b=\left\{ \begin{align} & a,if\text{ }a>0 \\ & 0.1a,otherwise \\\end{align} \right.$ (3)
The image information recognition model with YOLOv3 as the main framework treats the recognition of warehoused goods targets as a regression question, hence constructed a loss function based on the direct mean square error of the vector of (Y×5+Z)×R×R lengths in the real image and the output (Y×5+Z)×R×R length vector. Assuming that the position error is represented by COE, the error in the overlap rate between the resulting candidate box and the real marker box is represented by IE, and the classification error is represented by CLE, then we have the loss function expression:
$LOSS=\sum\nolimits_{i=0}^{{{r}^{2}}}{COE+IE+CLE}$ (4)
The three parts in the above loss function contribute differently to the LOSS. In this paper, the COE is corrected using μCO and the IE is corrected using μI, while the square root of the width and height of the goods target detection box is used for prediction to obtain a lower sensitivity of the detection box. Assume that CEGTij represents that the j-th detection box predicted in cell i contains the warehoused goods target and CENGTij represents not containing it. (ai, bi) represents the coordinates of the centre point of the detection box predicted in cell i; (a*i, b*i) represents the coordinates of the centre point of the real marker box. qi and fi represent the width and height of the detection box predicted in the i-th cell; q*i and f*i represent the width and height of the real marker box. Zi represents the confidence level of the i-th cell predicting the detection box contains warehoused goods in intelligent logistics; Z*i represents the confidence level pre-defined for the real marker box. CEGTi represents that the i-th cell contains the warehoused goods target. oi (z) represents the probability that the predicted detection box contains warehoused goods target belonging to category Z. o*i(z) represents the probability that the real marker box contains warehoused goods target belonging to category Z. The improved loss function is given by the following equation:
$LOSS={{\mu }_{CO}}\sum\limits_{i=0}^{{{R}^{2}}}{\sum\limits_{j=0}^{Y}{CE_{ij}^{GT}}}\left[ {{\left( {{a}_{i}}-{{a}_{i}}^{*} \right)}^{2}}+{{\left( {{b}_{i}}-{{b}_{i}} \right)}^{2}} \right]+{{\mu }_{CO}}\sum\limits_{i=0}^{{{R}^{2}}}{\sum\limits_{j=0}^{Y}{CE_{ij}^{GT}}}\left[ \begin{align} & {{\left( \sqrt{{{q}_{i}}}-\sqrt{{{q}_{i}}^{*}} \right)}^{2}} \\ & +{{\left( \sqrt{{{f}_{i}}}-\sqrt{{{f}_{i}}^{*}} \right)}^{2}} \\\end{align} \right]+\sum\limits_{i=0}^{{{R}^{2}}}{\sum\limits_{j=0}^{Y}{CE_{ij}^{GT}}}{{\left( {{Z}_{i}}-{{Z}_{i}}^{*} \right)}^{2}}+{{\mu }_{I}}\sum\limits_{i=0}^{{{R}^{2}}}{\sum\limits_{j=0}^{Y}{CE_{ij}^{NGT}}}{{\left( {{Z}_{i}}-{{Z}_{i}}^{*} \right)}^{2}}+\sum\limits_{i=0}^{{{R}^{2}}}{CE_{ij}^{GT}}{{\sum\limits_{z\in Z}{\left( {{o}_{i}}\left( z \right)-{{o}_{i}}^{*}\left( z \right) \right)}}^{2}}$ (5)
Given that the traditional YOLO network is not suitable for small goods recognition scenario, this paper adopts both up-sampling and multi-scale to predict each feature map independently, and obtains a more satisfactory result for small goods recognition. The k-means clustering algorithm is used to determine the target prior box that matches the size of the target object. YOLOv3 uses the same k-means clustering algorithm as YOLOv2 to perform clustering analysis on the annotated borders in the training set. Assume that the border selected as the centre for clustering is represented by CH, the other borders are represented by FR, and the distance between them is represented by δ. The distance between the two borders can be calculated by the following equation.
$\delta \left( FR,CH \right)=-IE\left( FR,CH \right)$ (6)
In terms of predicting the categories of warehoused goods in intelligent logistics, the image information recognition model constructed in this paper is modified from the perspective of network structure. To recognize multi-category warehoused goods of different shapes and colours, the softmax layer is replaced using a logistic regression layer, obtaining a better classification accuracy.
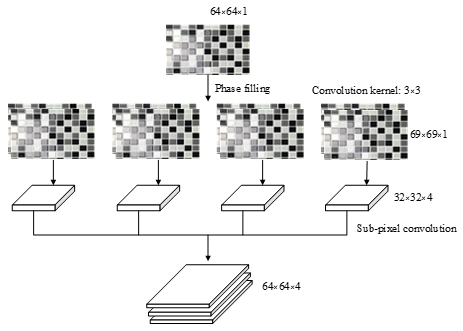
Analysis of existing machine vision techniques makes it clear that most models start with a series of processes on the original mosaic image before further processing the acquired full colour image. The model constructed in this paper looks to optimise this intermediate step of the mosaic.
Based on the analysis of goods target recognition scenarios in the real environment of intelligent warehouse logistics while considering features of the adopted machine vision systems, we collected the corresponding mosaic image sample sets of warehoused goods in intelligent logistics. According to the requirement of image recognition accuracy and recognition speed for warehoused goods in intelligent logistics, different mosaic image pre-processing networks were used for such goods. To further enhance the recognition accuracy, we improved the image information recognition model backbone network constructed in the previous section according to the specificity of the warehoused goods image target.
To reduce the risk of manual factors being introduced during the feature map enlargement operation, sub-pixel convolution is chosen for image up-sampling in this paper. The specific steps are described in detail below. Assume that the height and width of the feature map of a warehoused goods image are denoted by F and Q respectively, and the number of channels of the feature map is denoted by s2. The pixels at the same position of all feature images are rearranged, and then the s × s sub-map formed by the rearrangement is rearranged in order to finally output an sF×sQ×1 image, which can be considered as increasing the resolution of the feature map by a factor of s. Assume that the weights and biases learned by the network are represented by QK and φK respectively. The periodic pixel shuffle is represented by OR. Then the transformation process can be expressed by the following equation:
${{I}^{RS}}={{g}^{K}}\left( {{I}^{KS}} \right)=OR\left( {{Q}_{LK}}*{{g}^{K-1}}\left( {{I}^{KS}} \right)+{{\phi }_{K}} \right)$ (7)
The prior box of the YOLOv3 algorithm itself is not suitable for the detection of warehoused goods images in intelligent logistics. To speed up network convergence and reduce network training time, the pre-given prior boxes of different scales need to be modified to obtain the accurate location information of warehoused goods target in intelligent logistics. Figure 3 illustrates the original pre-processed network structure. In this paper, the k-means+ clustering algorithm is used to cluster the sample sets of the annotated goods images. Sample points that are far from the existing cluster centres are selected instead of the randomly generated initial cluster centres.
Figure 3. Structure of the original pre-processing network
Steps of the clustering algorithm are detailed below:
1) Determine the number of clustering categories;
2) Randomly select 1 sample point in the sample set and use it as the initial cluster centre;
3) Calculate the minimum value C(a) of the distance between other sample points in the sample set and the initial clustering centre, and then calculate the probability of each sample point identified as the next clustering centre, using the formula:
$\frac{C{{\left( a \right)}^{2}}}{\sum\nolimits_{a\in \psi }{C{{\left( a \right)}^{2}}}}$ (8)
4) Repeat the previous step until plenty of clustering centres have been selected.
5) Calculate the overlap rate error distance between each sample point in the sample set and each cluster centre, assign the distance value obtained from the calculation to the nearest cluster centre, obtain the classification results of all samples, and then carry out a new round of iteration.
6) The algorithm stops when the previous step is repeated until the clustering centres do not change.
Figure 4 presents the architecture of the modified model and modules of image information recognition. In this paper, the loss functions on confidence level and category are constructed based on the binary cross-entropy function. Assume that the loss weight of the coordinates of the target of the warehoused goods in intelligent logistics is represented by μCO, the loss weight of the confidence level of the target without warehoused goods is represented by μNGT, and the j-th detection box with and without warehoused goods target predicted in the i-th cell is represented by CEGTij and CENGTij respectively. The coordinates, confidence level and category information of the predicted and real target detection boxes are represented by (ai,bi,qi,fi,zi,oi) and (a*i,b*i,q*i,f*i,z*i,o*i) respectively, then the loss function expressions are
Figure 4. Modified model and modules for image information recognition
$L O S S=\mu_{C O} \sum_{i=0}^{R^2} \sum_{j=0}^Y C E_{i j}^{G T}\left[\begin{array}{l}\left(a_i-a_i^*\right)^2 \\ +\left(b_i-b_i^*\right)^2\end{array}\right]$ $+\mu_{C O} \sum_{i=0}^{R^2} \sum_{j=0}^Y C E_{i j}^{G T}\left[\begin{array}{l}\left(\sqrt{q_i}-\sqrt{q_i^*}\right)^2 \\ +\left(\sqrt{f_i}-\sqrt{f_i^*}\right)^2\end{array}\right]$ $-\sum_{i=0}^{R^2} \sum_{j=0}^Y C E_{i j}^{G T}\left[\begin{array}{l}z_i^* \log \left(z_i\right) \\ +\left(1-\hat{z}_i\right) \log \left(z_i\right)\end{array}\right]$$-\mu_I \sum_{i=0}^{R^2} \sum_{j=0}^Y C E_{i j}^{N G T}\left[\begin{array}{l}z_i^* \log \left(z_i\right) \\ +\left(1-\hat{z}_i\right) \log \left(z_i\right)\end{array}\right]$ $-\sum_{i=0}^{R^2} C E_{i j}^{G T} \sum_{z \in Z}\left[\begin{array}{l}o_i{ }^*(z) \log \left(o_i(z)\right) \\ +\left(1-o_i^*(z)\right) \log \left(1-o_i(z)\right)\end{array}\right]$ (9)
The original loss function only focuses on the distance between the sample points corresponding to (a,b,q,f) and the clustering centre, but the loss function shown in the above equation generates prediction boxes with large overlap rate values. However, when the prediction box of the warehoused goods target does not overlap with the real box, the overlap rate value is zero and the loss value cannot be further reduced. For this reason, this paper conducts the following scale-invariant RORV loss evaluation criterion for the regression of coordinates of the target box of warehoused goods. Assume that the two target bounding boxes are represented by X and Y, the minimum area enclosing X and Y is represented by Z, and the overlap rate value is represented by ORV, then there is:
$RORV=ORV-\frac{\left| Z\backslash \left( X\cup Y \right) \right|}{\left| Z \right|}$ (10)
The above equation shows that ORV is generally greater than RORV, and the difference between RORV and ORV is smaller when X and Y are closer and more similar in shape. When X and Y are completely overlapping, RORV and ORV are both 1. Since RORV introduces Z, the classification effect can still be guaranteed when X and Y do not overlap. the loss function of RORV can be calculated by the following equation.
${{L}_{RORV}}=1-RORV$ (11)
$L O S S=\mu_{c o} \sum_{i=0}^{R^2} \sum_{j=0}^Y C E_{i j}^{G T}(1-R O R V)$$-\sum_{i=0}^{R^2} \sum_{j=0}^Y C E_{i j}^{G T}\left[z_i^* \log \left(z_i\right)+\left(1-z_i^*\right) \log \left(1-z_i\right)\right]$$-\mu_I \sum_{i=0}^{R^2} \sum_{j=0}^Y C E_{i j}^{N G T}\left[z_i^* \log \left(z_i\right)+\left(1-z_i^*\right) \log \left(1-z_i\right)\right]$$-\sum_{i=0}^{R^2} C E_{i j}^{G T} \sum_{z \in \text { classes }}\left[\begin{array}{l}o_i^*(z) \log \left(o_i(z)\right) \\ +\left(1-o_i^*(z)\right) \log \left(1-o_i(z)\right)\end{array}\right]$ (12)
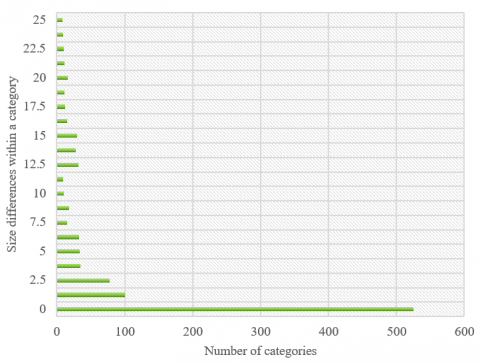
Figure 5. Distribution of dimensional differences within the warehoused goods category of intelligent logistics
Figure 5 presents the distribution of dimensional differences within the category of warehoused goods in intelligent logistics. We can see that the majority of warehoused goods in intelligent logistics have a size difference of 10% or less.
The training conditions under which the experiments were conducted in this paper were kept consistent with the test conditions. The model performance was characterised by running speed and mAP metrics. The experimental results for different pre-processing methods, different prior box setting cases, different multi-scale optimisation cases, and different loss function optimisation cases are shown in Table 1. Pre-processing method A is full colour recovery and B is phase convolution.
Table 1. Comparative experimental results of different models
|
Experiment No. |
Pre-processing Method No. |
Predefined prior box |
Optimisation Multi-scale |
Optimisation Loss function |
mAP |
Unit Test time |
|
1 |
A |
Yes |
No |
Yes |
75.16 |
42.5 |
|
2 |
B |
No |
No |
No |
91.52 |
40.3 |
|
3 |
A |
No |
Yes |
Yes |
93.67 |
49.6 |
|
4 |
B |
No |
Yes |
No |
97.48 |
41.3 |
|
5 |
B |
No |
No |
Yes |
90.62 |
47.8 |
|
6 |
A |
Yes |
No |
No |
98.54 |
46.2 |
|
7 |
B |
No |
Yes |
No |
93.47 |
49.8 |
|
8 |
A |
Yes |
Yes |
Yes |
96.13 |
47.1 |
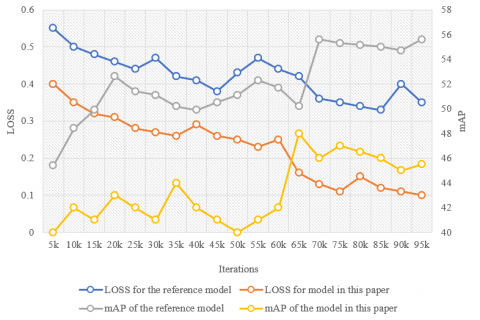
Figure 6. LOSS and mAP variation curves for models 2 and 8
Table 2. Comparison results of recognition performance of different algorithms
|
|
Accuracy |
Precision |
Recall |
Kappa |
|
ResNet18 |
86.57 |
87.48 |
87.58 |
0.8742 |
|
Multi_Stages |
80.25 |
80.63 |
82.37 |
0.8258 |
|
RetinaNet |
87.43 |
81.27 |
81.48 |
0.8374 |
|
Faster R-CNN |
82.58 |
84.53 |
85.82 |
0.8127 |
|
Model in this paper |
91.81 |
90.24 |
91.47 |
0.9147 |
The table reveals that the recognition speed of the constructed model for a single warehoused goods image is 45ms on average, which meets the needs of real-time recognition and retrieval of the intelligent logistics system. The mAP value of model 8 is higher than the other models, namely, the model with pre-processing method A, prior box setting, multi-scale optimisation and loss function optimisation has the best recognition effect. Figure 6 shows the LOSS and mAP variation curves for models 2 and 8, verifying the effectiveness of prior box setting, multi-scale optimisation and loss function optimisation operations.
To verify the effectiveness of the constructed image recognition model for warehoused goods in intelligent logistics, we designed performance comparison experiments with the reference models of ResNet18, Multi_Stages, RetinaNet and Faster R-CNN4. Table 2 gives the comparison results of the recognition performance of different algorithms. The performance indicators are accuracy, precision, completeness and Kappa coefficients. Table 2 reveals that the model constructed in this paper outperforms the other reference models in all four evaluation indexes, proving the effectiveness of setting prior boxes, performing multi-scale optimization and loss function optimization operations, and reducing the influence of the high similarity between warehoused goods on their recognition effects.
Table 3. Classification accuracy of different models
|
Warehouse Inventory Type of goods |
ResNet18 |
Multi_Stages |
RetinaNet |
FasterR-CNN |
Model in this paper |
|
Cyclical inventory |
78.16 |
74.39 |
81.28 |
83.52 |
84.95 |
|
In-transit inventory |
72.41 |
76.27 |
80.02 |
81.67 |
85.38 |
|
Buffer inventory |
72.05 |
65.69 |
83.97 |
81.29 |
87.04 |
|
Inventory for investment |
61.05 |
71.27 |
83.69 |
87.82 |
93.68 |
|
Seasonal inventory |
70.37 |
79.16 |
87.19 |
89.36 |
92.53 |
|
Dull inventory |
76.58 |
77.64 |
82.47 |
80.94 |
94.10 |
|
mAP |
77.28 |
79.62 |
85.38 |
87.52 |
95.96 |
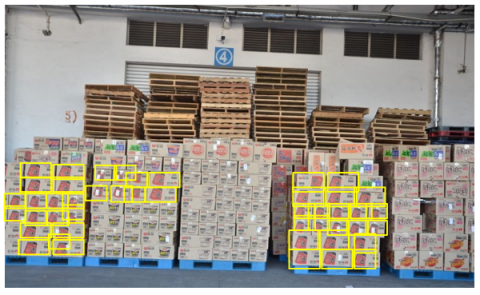
Figure 7. Recognition effect for the same type of warehoused goods in intelligent logistics
The classification accuracy of different models is given in Table 3. The specific categories of warehoused goods in intelligent logistics are cyclical inventory, in-transit inventory, buffer inventory, inventory for investment, seasonal inventory, and dull inventory. The above experimental results reveal that ResNet18 has the worst recognition performance for warehoused goods in intelligent logistics. The model in this paper has the best recognition performance, with the highest detection accuracy for each category and the optimal mAP value. Figure 7 gives the recognition effect of the same type of warehoused goods in intelligent logistics.
This paper unveils a study on the image information recognition and classification of warehoused goods in intelligent logistics based on machine vision technology. It presents a process related to warehouse management in intelligent logistics and a corresponding system architecture. It also constructs a YOLOv3 model for the image information recognition and classification of warehoused goods in intelligent logistics. The paper elaborates on the prior box settings and loss function correction methods, and finishes optimising the YOLOv3 model. Experimental results show the distribution of dimensional differences within a category of warehoused goods in intelligent logistics, and verify that most of the dimensional differences of such goods are within 10%. The comparison experimental results of different models and the LOSS and mAP variation curves of models 2 and 8 are given to verify the effectiveness of prior box setting, multi-scale optimisation and loss function optimisation operations. The paper also presents comparative recognition performance results of different algorithms and the classification accuracy results of different models, verifying that the model in this paper has the best recognition performance and the highest detection accuracy for each category along with the optimal mAP value. Finally, the paper presents the recognition effect for the same type of warehoused goods in intelligent logistics.
This work is supported by Doctoral Research Start-up Fund Project, Linyi University (Grant No.: 18LUBK02).
[1] Ren, H., Wang, K., Pan, C. (2021). Intelligent reflecting surface-aided URLLC in a factory automation scenario. IEEE Transactions on Communications, 70(1): 707-723. https://doi.org/10.1109/TCOMM.2021.3125057
[2] Zhao, T., Liu, L., Liu, S., Xie, Y., Qiu, X., Chen, Y. (2022). Research on production simulation and scheduling of printing shop for intelligent factory. In 2022 IEEE 10th Joint International Information Technology and Artificial Intelligence Conference (ITAIC), 10: 1342-1346. https://doi.org/10.1109/ITAIC54216.2022.9836632
[3] Lin, Y.S., Chai, C.W., Chao, T.W. (2022). Case study on the safety and disaster prevention system of factory intelligent warehouse. In 2022 IEEE 5th Eurasian Conference on Educational Innovation (ECEI), pp. 391-395. https://doi.org/10.1109/ECEI53102.2022.9829509
[4] Chu, L. (2022). Study the operation process of factory greenhouse robot based on intelligent dispatching method. In 2022 IEEE International Conference on Electrical Engineering, Big Data and Algorithms (EEBDA), pp. 291-293. https://doi.org/10.1109/EEBDA53927.2022.9744857
[5] Rieckmann, J.M., Torka, J., Gering, P. (2022). Weg zur intelligenten fabrik mensch im fokus towards an intelligent factory–human being focused. Zeitschrift für wirtschaftlichen Fabrikbetrieb, 117(1-2): 14-19. https://doi.org/10.1515/zwf-2022-1019
[6] Zhang, Y., Diao, J., Huang, X., Hong, W., Yin, X. (2022). An intelligent factory prediction model based on big data related analysis and machine learning. In International Conference on Electronic Information Engineering, Big Data, and Computer Technology (EIBDCT 2022), 12256: 661-666. https://doi.org/10.1117/12.2635377
[7] He, C. (2022). Application of intelligent technology on tunnel steel structure factory. Mathematical Problems in Engineering, 2022: Article ID 7640504. https://doi.org/10.1155/2022/7640504
[8] Sang, Y., Tan, J. (2022). Intelligent factory many-objective distributed flexible job shop collaborative scheduling method. Computers & Industrial Engineering, 164: 107884. https://doi.org/10.1016/j.cie.2021.107884
[9] Wu, Y., Dai, H.N., Wang, H., Xiong, Z., Guo, S. (2022). A survey of intelligent network slicing management for industrial IoT: integrated approaches for smart transportation, smart energy, and smart factory. IEEE Communications Surveys & Tutorials, 24(2): 1175-1211. https://doi.org/10.1109/COMST.2022.3158270
[10] Rieckmann, J.M., Torka, J., Gering, P. (2022). Towards an intelligent factory-Human being focused. Zeitschrift Kunststofftechnik/Journal of Plastics Technology, 117(1-2): 14-19.
[11] Pech, M., Vrchota, J., Bednář, J. (2021). Predictive maintenance and intelligent sensors in smart factory. Sensors, 21(4): 1470. https://doi.org/10.3390/s21041470
[12] Kou, Y., Zhang, L., Zhou, L. (2020). Construction of digital factory platform based on intelligent manufacturing. In International Conference on Application of Intelligent Systems in Multi-modal Information Analytics, pp. 205-211. https://doi.org/10.1007/978-3-030-51556-0_30
[13] Zhang, Q., Duan, G., Liu, S. (2021). Smart search over encrypted educational resources in cloud storage. In International Conference on Ubiquitous Security, pp. 90-101. https://doi.org/10.1007/978-981-19-0468-4_7
[14] Liu, Y., Zhang, Y., Liu, H., Li, Y. (2022). Permissioned Blockchain-based trustworthy edge storage scheme for smart grid. Recent Advances in Electrical & Electronic Engineering (Formerly Recent Patents on Electrical & Electronic Engineering), 15(2): 171-181. https://doi.org/10.2174/2352096515666220304105736
[15] Rane, D., Shinde, B., Vaity, S., Shingane, P. (2022). Smart image storage and retrieval for crime scene investigation. In 2022 10th International Conference on Emerging Trends in Engineering and Technology-Signal and Information Processing (ICETET-SIP-22), pp. 1-6. https://doi.org/10.1109/ICETET-SIP-2254415.2022.9791537
[16] Lamnatou, C., Chemisana, D., Cristofari, C. (2021). Smart grids and smart technologies in relation to photovoltaics, storage systems, buildings and the environment. Renewable Energy, 185: 1376-1391. https://doi.org/10.1016/j.renene.2021.11.019
[17] ur Rehman, U., Yaqoob, K., Khan, M.A. (2022). Optimal power management framework for smart homes using electric vehicles and energy storage. International Journal of Electrical Power & Energy Systems, 134: 107358. https://doi.org/10.1016/j.ijepes.2021.107358
[18] Sudhakar, A., Kumar, B.M. (2022). Maximum exploitation of electric vehicle storage in smart micro grids with stochastic renewable sources. Journal of Energy Storage, 48: 104029. https://doi.org/10.1016/j.est.2022.104029
[19] Liu, D., Zhang, Q., Chen, H., Zou, Y. (2022). Dynamic energy scheduling for end-users with storage devices in smart grid. Electric Power Systems Research, 208: 107870. https://doi.org/10.1016/j.epsr.2022.107870
[20] Fan, Y.C., Huang, S.Y., Chen, Y.Y., Chen, L.C., Leu, F.Y. (2022). Word embedding quantization for personalized recommendation on storage-constrained edge devices in a smart store. Mobile Networks and Applications, 27(1): 70-83. https://doi.org/10.1007/s11036-020-01710-4
[21] Al Khafaf, N., Rezaei, A.A., Amani, A.M., Jalili, M., McGrath, B., Meegahapola, L., Vahidnia, A. (2022). Impact of battery storage on residential energy consumption: An Australian case study based on smart meter data. Renewable Energy, 182: 390-400. https://doi.org/10.1016/j.renene.2021.10.005
[22] Yin, J., Li, J., Wang, L., Cai, B., Yang, X., Li, X., Lü, W. (2022). Integrated photoelectrochromic supercapacitor for applications in energy storage and smart windows. Journal of Energy Storage, 51: 104460. https://doi.org/10.1016/j.est.2022.104460
[23] Wang, C., Li, Z., Huang, L. (2020). Dangerous goods identification algorithm based on Generative Adversarial Networks. In Journal of Physics: Conference Series, 1682(1): 012027. https://doi.org/10.1088/1742-6596/1682/1/012027
[24] Chen, J., Zeb, A., Yang, S., Zhang, D., Nanehkaran, Y.A. (2021). Automatic identification of commodity label images using lightweight attention network. Neural Computing and Applications, 33(21): 14413-14428. https://doi.org/10.1007/s00521-021-06081-9
[25] Zhao, H. (2022). Image target recognition based on multiregional features under hybrid attention mechanism. Traitement du Signal, 39(2): 595-601. https://doi.org/10.18280/ts.390221
[26] Li, K., Yang, W., Zhang, L., Zhang, Z. (2022). Intelligent recognition of point source target image control points with simulation datasets. In Asian Conference on Pattern Recognition, pp. 387-401. https://doi.org/10.1007/978-3-031-02444-3_29