Yue Zhai | Weijia Zeng* | Nan Li
© 2022 IIETA. This article is published by IIETA and is licensed under the CC BY 4.0 license (http://creativecommons.org/licenses/by/4.0/).
OPEN ACCESS
Aiming at the problem of low accuracy of vehicle image detection and recognition caused by low visibility in foggy weather, an improved YOLOv5 algorithm is proposed. This algorithm adjusts the brightness and contrast of the image by adding the improved adaptive histogram equalization method to the image preprocessing, highlights the detailed information of vehicle image signs, and changes the backbone network standard convolution mode to the depth separable convolution method for model lightweight processing. By constructing the corresponding vehicle target detection data set, this paper is superior to the object detection model commonly used on the public data set in terms of performance and effectiveness, and draws the following conclusion from the comparison results of ablation experiments, the improved algorithm improves the detection accuracy of a single image and reduces the processing time.
traffic signs, YOLOv5, haze weather, vehicle detection
With the acceleration of expressway construction and the increase of traffic mileage, expressway traffic accidents are also becoming more and more frequent, and the types of causes are becoming more and more complex, bringing incalculable economic problems and emotional burdens to society and families [1-3]. The most important factor of expressway safety management is to predict the risk of traffic accidents that may occur in a certain period of time in the future according to the current traffic state of the expressway, the core of which is to improve the accuracy of prediction and expand the prediction period [4, 5]. Researchers in the field of expressway traffic management and meteorological services have conducted tentative research on traffic accidents under freezing disasters, dense fog and other environments [6-8]. Most of the research is based on traffic flow, driving speed and driving density at test points. For example, Pan et al. [9] selected factors that have a great impact on expressway traffic, such as low visibility, rainfall, ice, fog and so on, and made objective calculations using fuzzy mathematics and grey correlation degree methods, The danger of meteorological factors leading to traffic accidents on expressways is studied. Wang et al. [10] obtained the hidden danger sections of expressways and the main weather influencing factors by understanding the meteorological disaster risks and service needs of highway traffic in Hebei Province, using questionnaire survey, expert evaluation and comparative analysis. Ducret et al. [11, 12] used the same vehicle type to test the braking effect under different speeds and different precipitation conditions on the same standard asphalt road, and established the wet weather grade of the road surface. Zhang et al. [13-15] analyzed the daily variation characteristics of road surface temperature in Meicun and xianrenshan under different weather conditions by using the minute by minute meteorological data of road surface temperature, humidity, wind direction, wind speed and precipitation near Meicun and xianrenshan stations along the Shanghai Nanjing Expressway. Some studies have verified that highway traffic accidents are not only closely related to traffic flow, but also affected by weather characteristics. Weather characteristics are directly introduced into the model as explanatory variables, that is, it is assumed that the impact of weather characteristics and traffic flow characteristics on traffic accidents is independent of each other. For example, in the study of the relationship between highway accidents and high-speed loop detector data in Utrecht, the Netherlands [16], Researchers introduced the random forest method to analyze the importance of various vehicle driving variables in accidents, and found that there was a close causal relationship between vehicle speed, vehicle capacity and real-time traffic accidents. Using this result to adjust the variables in the neural network, the prediction accuracy was improved by 18%. The bottom layer of India's traffic accident classification system applies random forest algorithm to automatically classify, identify and process new traffic accidents. The classification accuracy of random forest method is verified by data comparison.
Although the existing studies have achieved fruitful phased results, there are few studies on highway traffic accident prediction and analysis considering the interaction between weather characteristics and traffic flow characteristics. Firstly, the interaction between weather characteristics and traffic flow dynamic characteristics is quantitatively analyzed to verify the role of weather characteristics in improving the accuracy of highway traffic accident prediction; then, a highway traffic accident risk prediction model based on dandelion propagation algorithm of learning rate is proposed to solve the interaction between weather characteristics and traffic flow characteristics in the risk prediction model. Through an example, it is verified that the dandelion propagation algorithm based on learning rate proposed in this paper supports the accuracy and reliability of highway traffic accident prediction under the interaction of weather characteristics and traffic flow characteristics.
YOLOv5 is divided into four versions according to the size of the model. In this paper, YOLOv5l with high recognition accuracy and moderate detection speed is studied, and its network structure is optimized and improved to make it more suitable for small target recognition of traffic signs in the night environment.
2.1 Image pre-processing
The visibility of traffic signs will be significantly reduced by the light intensity at night, which leads to the loss of traffic sign features in the image and reduces the recognition accuracy of traffic signs. This problem requires image preprocessing by increasing image brightness and contrast. Traditional methods use histogram equalization algorithm (HE) to adjust image contrast, but HE algorithm is based on the whole image, the image is over-exposed, so there will be detail loss. The improved histogram equalization algorithm (AHE) uses local enhancement as the target to equalize the image. However, for the image with uneven brightness distribution, the local contrast will be increased too much, resulting in local distortion. The loss of details or partial distortion caused by the above two algorithms will lead to poor recognition effect. The Constrained Contrast Histogram Equalization (CLAHE) algorithm can effectively improve the image contrast, but the interpolation process used in this algorithm will increase the reasoning time of the algorithm, which is not suitable for the end-to-end deep learning model in this paper. In this paper, an improved adaptive histogram equalization algorithm (IAHE) is proposed, which combines the advantages of AHE and CLAHE. This algorithm can improve the contrast and suppress the noise, and can achieve effective control without increasing the computation. The procedure for the IAHE algorithm is as follows.
$T=c \times \frac{n_x n_y}{K}$ (1)
In the formula: c denotes the constrained factor; nx is the number of pixels in the x-direction of the block; ny is the number of pixels in the y-direction of the block; K is the grayscale level.
$S=\sum_{x=0}^{K-1}\{\max [h(x)-T], 0\}$ (2)
$A=\frac{S}{K}$ (3)
After reassigning the pixel points, the histogram is represented by h'(x).
$h^{\prime(x)}= \begin{cases}T+A & h(x) \geq T \\ h(x)+A & h(x)<T\end{cases}$ (4)
Figure 1. Before and after pixel redistribution
A comparison of the original image and the effect of adding HE, AHE and IAHE pre-processing respectively is shown in Figure 2. As can be seen from the figure, the use of HE algorithm leads to overexposure of the image and some details are difficult to capture. As can be seen from the figure, the use of HE algorithm leads to overexposure of the image and some details are difficult to capture. The IAHE algorithm proposed in this paper improves image brightness and contrast on the basis of preserving image details and suppressing noise.
Figure 2. Comparison of pretreatment effect
2.2 Backbone network improvement
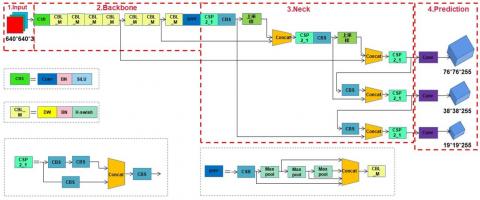
The backbone feature extraction network of the YOLOv5 model mainly contains CSP and SPPF. Although this design enhances the feature extraction ability of the network, this enhancement is at the cost of model computation speed and excessive parameter redundancy. Therefore, the backbone network of YOLOv5 model is improved and designed as a lightweight network. In this paper, the convolution method in Xception is used for reference, and the standard convolution of backbone network is replaced by Depthwise Separable Convolution (DSC), which greatly reduces the number of redundant parameters; The ReLU function of the convolution module is replaced with the H-Swish function. The improved network structure diagram is shown in Figure 3.
Figure 3. Network structure diagram
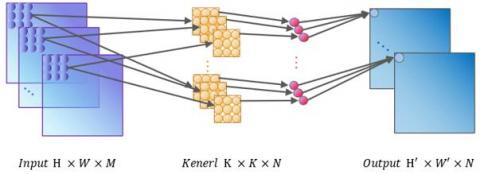
Figure 4. Traditional convolution method
Standard convolution performs simultaneous spatial and channel convolution on the feature map and accumulates the results to output the final features, the principle of which is shown in Figure 4. Different from the standard convolution approach, simultaneous convolution in spatial and channel dimensions is replaced by DSC with a channel-by-channel (depthwise Convolution) and pointwise Convolution in steps, the principle of which is shown in Figure 5.
Under standard convolution, the input M-dimensional feature image (feature map) is convolved with N M-dimensional convolution kernels with the same number of channels as the input feature map, respectively, to obtain the N-dimensional output result, which is calculated as shown in Eq. (5).
$C_1=H \times W \times M \times N \times K^2$ (5)
where, C1 denotes the total computation of traditional convolution; H and W denote the height and width of the feature map; K × K denotes the height and width of the convolution.
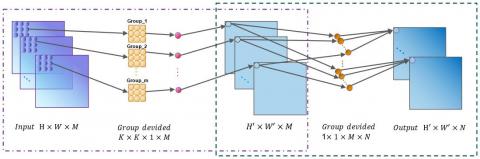
Figure 5. Depth-separable convolution method
Depth separable volume integral in two steps. The first step of channel-by-channel convolution is to compute the input feature map separately using convolution kernels, as shown in the dashed box on the left in Figure 5, the input image has M channels, so M convolution kernels are used to compute each channel separately, and the results are stacked to obtain the feature map of M channels; the second step is the channel fusion of the results obtained in the previous step using point-by-point convolution, as shown in the dotted box on the right in Figure 5, where N 1 × 1 × M convolution kernels are weighted and combined with the previous output to finally generate a new N-dimensional feature map with the computational quantities shown in Eqns. (6) and (7).
$C_d=H \times W \times M \times K^2$ (6)
$C_p=H^{\prime} \times W^{\prime} \times M \times N$ (7)
$C_2=C_d+C_p$ (8)
$\frac{C_2}{C_1}=\frac{1}{N}+\frac{H^{\prime} \times W^{\prime}}{H \times W \times K^2}$ (9)
where, H' and W' denote the height and width calculated channel by channel; Cddenotes the amount of computation for channel-by-channel convolution; Cp denotes the amount of computation for channel-by-channel convolution; C2 denotes the total computation of the depth-separable convolution. The dimensions before and after the convolution are constant, then H'×W' = H × W. Eq. (9) can be approximated as:
$\frac{C_2}{C_1}=\frac{1}{N}+\frac{1}{K^2}$ (10)
From the formula, the model parameters and computation of the depth-separable convolution can be approximately reduced to 1/K2 of the original standard convolution, which can significantly improve the model inference speed.
2.3 NMS improvement
Non-maximum suppression (NMS) is often used to filter the prediction frames, ranking the frames according to their confidence level, and suppressing the frames that have significant overlap with the prediction frames. When multiple targets have partial overlap, prediction frames with lower scores are easily removed, resulting in target misses. Soft-NMS retains the value of the prediction box with the highest confidence constant and update the confidence of the boxes that overlap with it using IoU, and the values of these boxes will be removed after iterative updates below the confidence threshold. Although this method can effectively retain prediction frames with low IoU and high confidence, this way of discarding redundant frames still leads to false detections. In this paper, we propose a weighted frame fusion WBF approach to generate optimal prediction frames, which replaces the redundant prediction frames from selective discarding to fusion. The confidence threshold is appropriately lowered to make the network output a certain number of prediction frames, and the WBF algorithm proceeds as follows.
$C=\frac{\sum_{i=1}^T C_i}{T}$ (11)
$X 1,2=\frac{\sum_{i=1}^T C_i * X 1,2_i}{\sum_{i=1}^T C_i}$ (12)
$Y 1,2=\frac{\sum_{i=1}^T C_i * Y 1,2_i}{\sum_{i=1}^T C_i}$ (13)
$C=C * \frac{\min (T, N)}{N}$ (14)
Both NMS and soft NMS remove the redundant frames, while WBF uses all the prediction frames, which can effectively reduce the problem of model error detection and false detection and improve the accuracy of model detection.
3.1 Dataset
Fewer publicly available object detection datasets in foggy weather. Although foggy days can be augmentation for the images, there is a big gap with the real foggy days. In order to show the real situation as much as possible, this paper selects the RTTS dataset. RTTS is currently a more comprehensive real-world fog-sky dataset, containing 4,322 real fog-sky images, labeled with 5 categories, namely cars, buses, people, bicycles and motorcycles, with 41,187 tags. The detailed distribution of each sample in the dataset is shown in Figure 6.
It is obvious from the figure that the number of cars and people accounts for 90% of the whole data set, the data distribution is unbalanced and the sample distribution is uneven, which seriously affects the accuracy of the model. It can be seen from the ablation experiments in the next section that the impact of the unbalanced sample distribution on the model is significantly improved after adding the focal loss function.
Figure 6. Distribution map of various samples in RTTS dataset
3.2 Ablation experiment
To verify the effects of each improvement on the original model, ablation experiments were designed, and the results are shown in Table 1. It can be seen that adding different factors individually has different degrees of improvement on the accuracy of the original model. Among them, adding ECA and improving downsampling improves mAP by 0.7% and 0.9%, respectively, and the improvement of the algorithm alone has less performance improvement. However, the improvement is most obvious after optimizing the loss function, which improves 5.3% compared with the original model mAP. This is due to the poor image quality of foggy weather and the imbalance between positive and negative samples, and the optimized classification function loss effectively improves the weight of difficult classification samples, which results in a larger improvement in algorithm accuracy. As can be seen from Table 1, the effect after the combination of the three improvements is improved by 8.6% compared with the original model, which indicates that the whole improvement is significant for the object detection under foggy weather.
Table 1. Ablation experiments result
|
Model |
Factors |
mAP/% |
||
|
ECA |
Downsampling |
Loss function |
||
|
YOLO |
- |
- |
- |
70.4 |
|
√ |
|
|
71.1 |
|
|
|
√ |
|
71.3 |
|
|
|
|
√ |
75.7 |
|
|
FD-YOLO |
√ |
√ |
√ |
79 |
Aiming at the problem of vehicle target image detection in foggy weather, this paper introduces the dense theory and proposes a yolov5 based detection model that replaces the down sampling layer. Among them, (1) the accuracy improvement of the model in fog environment is mainly realized by reducing the feature loss in the process of target image recognition and detection; (2) The optimization of the loss function and the improvement of the model convergence speed are mainly realized by adding the attention module in the feature extraction stage; (3) The low-quality images of foggy weather and the imbalance of positive and negative samples are enhanced by the global learning ability of attention. By constructing the corresponding vehicle target detection data set, this paper is superior to the object detection model commonly used on the public data set in terms of performance and effectiveness, and draws the following main conclusions from the comparison results of ablation experiments.
(1) The acquisition of data sets in the actual fog environment is a key issue in the research of vehicle image detection in fog weather. The fogging operation with uncertain environment is difficult to simulate the foggy scene of the actual environment. It can be realized by adding image depth estimation to the atmospheric scattering model, so as to simulate the actual foggy environment most realistically.
(2) Considering the simulation scale of the environment, the model involved in this study cannot meet the needs of fully deploying to edge devices. In future research, the model can be trimmed and quantified to reduce the scale of the model, and the lightweight network model can be directly used to reduce the scale of the model to improve the accuracy.
Foundation items: Project supported by Scientific and Research Project of Education Department of Liaoning Province (Grant No.: L2020006, L2020004), Science and technology innovation fund program of Dalian (Grant No.: 2021JJ13SN81) and Education Department Project of Liaoning Province (Grant No.: LJKZ1350, LJKZ1349).
[1] Al-nawayseh, M.K., Alnabhan, M.M., Al-Debei, M.M., Balachandran, W. (2013). An adaptive decision support system for last mile logistics in E-commerce: A study on online grocery shopping. International Journal of Decision Support System Technology (IJDSST), 5(1): 40-65. https://doi.org/10.4018/jdsst.2013010103
[2] Ning, T., An, L., Duan, X. (2021). Optimization of cold chain distribution path of fresh agricultural products under carbon tax mechanism: A case study in China. Journal of Intelligent & Fuzzy Systems, 40(6): 10549-10558. https://doi.org/10.3233/JIFS-201241
[3] Pan, F.Q., Yang, Y.Z., Zhang, L.X., Yang, X.X., Yang, J.S., Liu, M.J. (2021). Analysis of EEG characteristics of drivers at the entrance and exit of an undersea tunnel and research on driving safety. International Journal of Safety and Security Engineering, 11(2): 155-165. https://doi.org/10.18280/ijsse.110204
[4] Tao, N., Wang, X.P. (2018). Study on disruption management strategy of job-shop scheduling problem based on prospect theory. Journal of Cleaner Production, 194: 174-178. https://doi.org/10.1016/j.jclepro.2018.05.139
[5] Ning, T., Wang, X.P., Hu, X.P. (2019). Study on disruption management strategy of terminal logistics based on prospect theory. Systems Engineering-Theory & Practice, 39(3): 673-681.
[6] Song, L., Cherrett, T., McLeod, F., Guan, W. (2009). Addressing the last mile problem: transport impacts of collection and delivery points. Transportation research record, 2097(1): 9-18. https://doi.org/10.3141/2097-02
[7] Abdullatif, N., Kassem, S. (2020). Modelling of agent-based vehicle routing problem using unified modelling language. Journal Européen des Systèmes Automatisés, 53(6): 781-789. https://doi.org/10.18280/jesa.530604
[8] Janjevic, M., Kaminsky, P., Ballé Ndiaye, A. (2013). Downscaling the consolidation of goods–state of the art and transferability of micro-consolidation initiatives. European Transport, 54: 4.
[9] Pan, J., Fu, Z., Chen, H.W. (2019). Split delivery vehicle routing problem with minimum delivery amounts. Journal Européen des Systèmes Automatisés, 52(3): 257-265. https://doi.org/10.18280/jesa.520306
[10] Wang, W., Liu, Y., Wei, Y. (2013). Research on management strategies of reverse logistics in e-commerce environments. In LISS 2012, 321-326. https://doi.org/10.1007/978-3-642-32054-5_48
[11] Ducret, R., Delaître, L. (2013). Parcel delivery and urban logistics-changes in urban courier, express and parcel services: The French case. In 13th World Conference on Transport Research, July 15-18, 2013-Rio de Janeiro, Brazil.
[12] Durand, B., Gonzalez-Feliu, J. (2012). Impacts of proximity deliveries on e-grocery trips. In Supply Chain Forum: An International Journal, 13(1): 10-19. https://doi.org/10.1080/16258312.2012.11517284
[13] Zhang, G.Y., Wu, Y.G., Tan, Y.X. (2013). Bacterial foraging optimization algorithm with quantum behavior. Journal of Electronics & Information Technology, 35(3): 614-621. https://doi.org/10.3724/SP.J.1146.2012.00892
[14] Ning, T., Wang, X.P., Hu, X.P. (2019). Disruption management decision model for vehicle scheduling under disruption delay. Systems Engineering-Theory & Practice, 39(5): 1236-1245.
[15] Keller, R.A., Mehran, N., Austin, W., Marshall, N.E., Bastin, K., Moutzouros, V. (2015). Athletic performance at the NFL scouting combine after anterior cruciate ligament reconstruction. The American Journal of Sports Medicine, 43(12): 3022-3026. https://doi.org/10.1177/0363546515608482
[16] Ning, T., Gou, T., Liu, X.D. (2022). Simulation of cold chain distribution path of fresh agricultural products under carbon tax mechanism. Journal of System Simulation, 1-10. https://doi.org/10.16182/j.issn1004731x.joss.20-0903