Ankit Kumar | Kamred Udham Singh | Chetan Swarup* | Teekam Singh | Linesh Raja | Abhishek Kumar
© 2022 IIETA. This article is published by IIETA and is licensed under the CC BY 4.0 license (http://creativecommons.org/licenses/by/4.0/).
OPEN ACCESS
Given the pivotal role of digital images in our daily lives, it is important to detect copy-move forgery (CMF) of digital images. The detection of CMF is often based on feature detection and matching. For feature matching, the existing algorithms make use of the Euclidean distance. For feature detection, the Haar transform is one of the most popular techniques. This study retrieves image features through the Haar transform, and then simplifies the features by principal component analysis (PCA). After that, false boundaries were detected, localized, and removed. On this basis, the texture features of the input image were analyzed, using the gray-level co-occurrence matrix (GLCM). Finally, Euclidean distance was utilized to match features, and the mismatched features were labeled as forgeries. Then, the proposed approach was simulated in MATLAB, with accuracy as the performance metric. The simulation results show that our approach outperformed the PCA by 13.6% in accuracy.
GLCM, PCA, Haar, Euclidean distance
Thanks to technological advancements, the image processing technique has achieved significant progress in recent years [1]. Image processing can improve the quality of raw photos taken by cameras mounted on satellites, space probes, and aircrafts. These photos capture various features in the appropriate time frame for different purposes.
As a common application, image processing improves the aesthetic appeal of images, and helps to extract valuable information from the images. It is a subset of digital imaging. This versatile technique [2] can process both visual images and analog images. Agarwal et al. demonstrated various prominent imaging techniques, and explained how they have been used in practice.
Every image on digital screens is created by imaging. Hence, digital image processing becomes a holistic operation targeting the entire image, rather a series of discrete operations. Through image processing, it is possible to edit and improve the previously taken photos. For example, Bayram et al. [3, 4] analyzed images using computer vision, and divided the salient regions from the original images. Based on a set of salient regions, it is easy to recreate the original image.
The advancement of image processing techniques is particularly obvious in computer vision. The latest digital cameras can quickly capture many images, which are completely undetectable [5]. Recently, digital data storage is realized owing to technological advancements and increased database storage capacity [6]. This gives rise to several security concerns. For instance, the files are more vulnerable to digital alterations.
Against this backdrop, automatic forgery detection has gained popularity, due to its potential of enhancing the reliability of the object image [5]. In ideal cases, forgery detection algorithms should work without the prior knowledge of the image contents or any defense mechanisms, such as watermarks. Currently, passive forgery detection algorithms are being developed. The detection and identification of image forgery used to be accomplished manually.
The Digital Images Forensics Laboratory created a new digital forgery detection strategy called the shield of images and security measures. This strategy has been proved as effective in restoring image consistency in various situations. The addition, modification, or removal of contents are a few fundamental features that distinguish altered images from intact images. Sometimes, an image may be altered, without leaving any visible evidence of the manipulation.
Images can be falsified in various ways [7]. The existing forging techniques fall into three broad categories: copy-move forgery (CMF), image splicing, and image resampling. Among them, CMF is the simplest and most widely used technique of image alteration [8]. This technique copies and pastes an image onto another image to hide sensitive information.
Image splicing merges images from a single or multiple photos to create a false visual. If the splicing is incorrect, the borders between spliced parts may be obscured [9]. Besides, image splicing generates nonnegligible high-order Fourier statistics that are somehow disrupted [10]. This sheds light on how to deceive the target in individual forgery schemes [11]. To create an effective false image, each specified location undergoes geometric changes, such as rotation, scaling, stretching, skewing, and flipping. Interpolation is critical when using image splicing.
As for image resampling, episodic associations, which are not seen previously, are introduced into the original image.
CMF is a common technique for image modification. Before pasting an image segment on another image, it is necessary to slice and copy that image to conceal the redundant parts of the original image. This technique has gained popularity due to its simplicity and effectiveness, as well as technological advancements [12]. The superiority of this technique depends heavily on how it is implemented. By virtue of CMF, erroneous visuals can be fabricated to conceal the true information.
Figure 1. Common flow of CMF detection
As shown in Figure 1, the textured regions are used in conjunction with similar color and noise difference features to achieve CMF [13]. The changes in image statistics are so minor that they are not easily detected by the human eyes. To avoid confusion between the original and pasted image parts, the common practice is to burr the edge of the changed regions, during image modification.
Image modification overlaps an object within an image by another object within the same image, out of the various images [14]. It is a technique to improve the raw photos captured by cameras mounted on satellites, space probes, and aircrafts, as well as those captured by ground-based cameras.
In this paper, image features are extracted through the Haar transform, and then simplified by principal component analysis (PCA). After that, false boundaries were detected, localized, and removed. Furthermore, the texture features of the input image were analyzed, using the gray-level co-occurrence matrix (GLCM). Then, features were matched using Euclidean distance, and the mismatched features were labeled as forgeries. Finally, the proposed approach was proved accurate through MATLAB simulations.
This section reviews the cutting-edge works in feature extraction and image segmentation.
Gupta and Girdhar invented a new CMF detection method, without needing any knowledge of the source image. Firstly, a grayscale image was taken from a building, representing the overlapping blocks. Then, the image features were extracted by hybrid approaches, including PCA and oriented gradients (HOG) [15]. After that, the features were arranged lexicographically, making it simple to connect simulated areas with their corresponding features. After comparative experiments, it was learned that their technique outperformed the contrastive methods, while improving security, as evidenced by precision, recall, and accuracy.
Yeap et al. reviewed CMF by developing a passive forgery detection tool that tamper with the images, for CMF detection is a passive forgery detection approach. Researchers [16] used a rotatable binary robust independent elementary feature to extract image features, creating a novel CMF detection approach. The new approach was employed to process images with various geometrical incursions. Next, two databases were selected to test the performance of the approach. The results show that the approach detected CMF correctly in 84.33% and 82.79% of all images in the two databases, respectively. The approach was further verified on degraded images, where it achieved a greater-than-91% true positive rate.
Singh et al. noted the growing popularity of image forgery detection in forensic science, along with the development of image processing. Then, an overview was provided concerning CMF detection techniques. The overview covers all readily available approaches, and their various stages of development. It is concluded that the previous methodologies are not widely used, because of their respective limitations. These methodologies could be improved [17], and possibly further developed. For this purpose, a novel methodology was suggested, and proved capable of creating low-cost forensic image apps.
Drawing on research, Wu et al. created a deep neural network (DNN) to identify and forecast counterfeit masks easily. The primary goal of the DNN is to detect CMF. Wu et al. [18] adopted convolutional neural network (CNN) to extract the features of matching blocks. The CNN was used to determine the self-correlations in different blocks, and reduce the loss during the reconstruction of the forgery surface. By simulations on various features and matching systems, it was discovered that the proposed CNN produced significantly better results than previous approaches. There is a good chance that the CNN could successfully protect image data from anonymous intrusion.
Shabanian and Mashhadi proposed a novel block-based technique for detecting CMF in digital images [19]. The uniqueness of their technique lies in the measurement of similarity, using the structural similarity index. This index was chosen for similarity matching, eliminating the need for feature extraction, which can reduce the time cost of a task. Therefore, the efficacy of their technique is reflected by the ease of calculation and assessment. Some post-processing activities were conducted to assess the strength and responsiveness of the technique. Considering the frequency domain and statistical features, Dixit et al. demonstrated an innovative method of dividing images into overlapping blocks of fixed size [20]. Detection accuracy (DA) and false positive rate (FPR) were used to assess the efficacy of their method, against several current methods. The results reveal that their method outshined all the current methods in both DA and FPR [21, 22].
CFM detection boasts bright prospects in legal evidence, forensic investigation, defense, and many other fields. Dixit and Bag [23] discussed a CFM detection tool with the potential to identify sections of a picture that have been copied and paste. The CFM detection tool identifies forgeries in two steps. In the first phase, the tool determines whether the image is genuine or fabricated. If the image is deemed forged, then block matching will be initiated to locate the forged site. Steerable pyramid transform (SPT) was called to break the suspicious picture into several orientations. GLCM features were recovered from each orientation, and adopted to train the optimized support vector machine (OSVM). These features may be derived from each block of a suspected grey image, if the image is identified as fabricated. With the right similarity and distance threshold, it is possible to locate the forged site, using GLCM block features. The suggested CFM detection tool was evaluated on standard datasets CoMoFoD and CASIA. Even after JPEG compression, scaling, and rotation, the tool achieved stable performance.
CMF detection is the greatest challenge in image forensics. The legitimacy of images is crucial, when images are employed in criminal investigations, intelligence services, and medical paperwork. Mishra et al. [24] proposed a CMF identification technique. Firstly, a sparse recovery technique was utilized to detect questionable segments. Then, the histograms of these segments were compared to identify those containing the color information. After that, the essential points of the segments were located, before matching these segments. Next, morphological strategy was presented to extract the forged area. Various fabricated photos were used to test the effectiveness of the suggested technique. The simulation shows that the technique outperformed the state-of-the-art forgery detection systems: the technique achieved the best results on the detection of scaled forgeries; thanks to sparse recovery, the technique excluded true repeating patterns from the picture, whereas previous algorithms incorrectly treated such areas as counterfeit; on top of that, the technique was quicker than the other methods on average.
Forgery that alters the contents of a picture by concealing or adding visual information is demeaning. Agarwal et al. [25] explained the most popular image alteration techniques like CMF, which modifies an image by copying and pasting a specific section many times, and offered a unique key point-based approach for detecting faked photos subjected to various geometric and post-processing attacks. Accelerated KAZE (AKAZE) and features from accelerated segment test (FAST) were employed to extract significant points from an image. FAST keypoint extraction uses automated contrast thresholding to suppress non-maximum values. Based on the retrieved key points, two descriptors were generated, namely, scale-invariant feature transform (SIFT) and DAISY. The descriptors and PCA were adopted to eliminate low components susceptible to visual distortions. Keypoint descriptions were then compared by a correlation-based closest neighbor search. The hierarchical density-based spatial clustering of applications with noise (HDBSCAN) was used to find cluster similar key points. In addition, the keypoint outliers were removed by random sample consensus (RANSAC). Compared with current methods, their approach achieved the best F-measure and the lowest FPR, a sign of strong potential for forgery detection at pixel and image levels.
CMF is a systematic technique to detect image alteration, i.e., the copying, changing, and pasting back of sections of the original image. Depending on the scenario (e.g., brightness or contrast adjustment), several modifications or parameter changes may be performed on duplicate photos. Figure 1 shows the general flow of CMF. So far, many alternative detection techniques have been developed to deal with the problem of CMF. The majority of them follow a set of standard operating procedures, making the CMF detection more efficient.
This study blends and integrates CMF detection techniques into a unified framework, rather than separate the detection procedure into processes based on blocks and keypoints. Some phases in the flowchart (Figure 1) were rearranged, namely, some phases or components were excluded, making the entire flow more manageable. Figure 2 shows the flow of the proposed CMF detection pipeline.
Figure 2. Flow of the proposed CMF detection pipeline
This paper relies on PCA, a multivariate data analysis algorithm, to locate different data in a digital dataset involving several quantitatively dependent variables. The PCA algorithm highlights the duplicated portion with a dark grey tone. The primary goal is to extract meaningful information from a data table as quickly as possible. The information obtained represents new orthogonal variables. The variables that comprise a system are referred to as principal components.
Here, the similarity patterns of observations and variables are represented as dots on maps. For a known data matrix has p variables and n samples, the data is concentrated on each variable. The information on the source of the principal components is available in the middle of the matrix. This distribution does not affect the spatial relationships of the data or the variances associated with the variables. The linear combination of variables is denoted as X1, X2, ..., Xp. By applying the first principal component (Y1) to the final principal component (Yp), the combination can be described as:
$Y_{1}=a_{11} X_{1}+a_{12} X_{2}+\cdots+a_{1 p} X_{p}$ (1)
This combination can be represented as a matrix:
$Y_{1}=a_{1}^{T} X$ (2)
The primary principal component is estimated to locate the dataset with the largest possible variance. The variance of $Y_{1}$ can be increased by selecting large values for the weights $a_{11}, a_{12}, \ldots a_{1 p}$. A rigorous calculation ensures that the total of squares equals one.
$a_{11}^{2}+a_{12}^{2}+\cdots+a_{1 p}^{2}=1$ (3)
The second principal component is calculated similarly to the first principal component to eliminate correlations with the first principal component. This second principal component accounts for the next most significant variance.
$Y_{2}=a_{21} X_{1}+a_{22} X_{2}+\cdots+a_{2 p} X_{p}$ (4)
The above process is repeated until the p-th principal components is computed. The sum of these components equals the total number of variables in the real world. In this phase, it is possible to ensure that the sum of all principal components equals the total variance of all variables. Hence, the variation in the original variables to the principal components can be expressed as:
$Y=X A$ (5)
This study adopts GLCM to extract textual features from an input image. The texture features were used to identify the region of CMF in the image. Then, statistical texture analysis was carried out to compute identical texture features. The data were divided into three classes, based on the number of accessible intensity points: first-order, second-order, and higher-order. Following GLCM, it is possible to extract second-order statistical texture features with little trouble. This technique provides information on the locations of pixels with grey level values similar to one another.
3.1 Harr wavelets
The orthogonal Haar functions include only one wavelet during an interval, and remain zero in all other intervals. The uniform Haar wavelet is denoted by the letter i. Then, $h_{i}(x), x \in[a, b]$can be defined as [2]:
$h_{i}(x)= \begin{cases}1, & a+(b-a) \frac{k}{m} \leq x<a+(b-a) \frac{k+0.5}{m} \\ -1, & a+(b-a) \frac{k+0.5}{m} \leq x<a+(b-a) \frac{k+1}{m} \\ 0, & \text { otherwise, }\end{cases}$ (6)
where, $i=2^{j}+k+1(j=0,1,2, \ldots, J)$ is the dilation parameter; m=2j and k=0,1,2,...,2j-1 are the translation parameters. Note that $m=2^{j}$ is the most excellent value, which signifies the highest possible degree of resolution.
The Haar scaling function $h_{1}(x):=\chi_{[a, b]}(x), h_{1}(x):=$ $\chi_{[a, b]}(x)$ is the characteristic function on the interval $[\mathrm{a}, \mathrm{b}]$. The uniform Haar wavelet $x_{j}=a+(b-a)\left(\frac{j-0.5}{2 M}\right)$ can be derived by wavelet collocation. The collocation points can be described as:
$y(x)=\sum_{l=1}^{2 M} b_{l} h_{l}(x), l=2^{j}+k+1$
$j=0,1,2, \ldots, J, k=0,1,2, \ldots, 2^{j}-1$ (7)
The above formula represents the functional value of Haar wavelet, which belongs to $y \in L_{2}[a, b]$. The functional value can be represented by uniform Haar series
$b_{l}=\int_{-\infty}^{\infty} y(x) h_{l}(x) d x$
where, $b_{l}$ is Haar wavelet coefficients:
$u(x, t) \approx \sum_{l=1}^{2 M} \sum_{i=1}^{2 M} c_{l, i} h_{l}(x) h_{i}(t)=H^{T}(x) C H(t)$ (8)
Any function of two variables can be expressed as:
The variable of function $u(x, t) \in L_{2}[a, b] \times[a, b]$ can be approximated by:
$c_{l, i}=\left\langle h_{l}(x),\left\langle u(x, t), h_{i}(t)\right\rangle\right\rangle$ (9)
where, C is a $2 M \times 2 M$matrix of coefficients that may be calculated using the inner product.
Uniform Haar wavelets are Riemann-Liouville fractional integrals.
$I_{x}^{\alpha} h_{1}(x)=\frac{(x-a)^{\alpha}}{\Gamma(\alpha+1)^{\prime}}$
$c(l)=a+(b-a)\left(\frac{k+1}{m}\right)$
$a(l)=a+(b-a)\left(\frac{k}{m}\right)$,
$b(l)=a+(b-a)((k+0.5) / m)$, (10)
$P_{\alpha, l}(x)=I_{x}^{\alpha} h_{l}(x)=\frac{1}{\Gamma(\alpha)} \int_{a}^{x}(x-s)^{\alpha-1} h_{l}(s) d s$
$=\frac{1}{\Gamma(\alpha+1)}\left\{\begin{array}{l}(x-a(l))^{\alpha}, \\ a(l) \leq x<b(l) ; \\ (x-a(l))^{\alpha}-2(x-b(l))^{\alpha}, \\ b(l) \leq x<c(l) ; \\ (x-a(l))^{\alpha}-2(x-b(l))^{\alpha}+(x-c(l))^{\alpha},\end{array}\right.$ (11)
3.2 Quasilinearization technique for feature extraction
Then, any nonlinear second-order differential equation can be selected:
$y^{\prime \prime}(x)=f(y), y(0)=y(b)=0$.
Now, apply the quasilinearization technique to the second-order differential formula, and get the value of the wavelet:
$y_{n+1}^{\prime \prime}(x)=f\left(y_{n}\right)+\left(y_{n+1}-y_{n}\right) f^{\prime}\left(y_{n}\right)$,
$y_{n+1}(0)=y_{n+1}(b)=0$. (12)
where, $y_{0}(x)$ is an initial approximation.
Each function $y_{n+1}(x)$ is a solution of a linear formula (11), and $y_{n}$ value always comes from the initial iteration.
Drawing on Swaminathan et al. [6] and making $\max _{y}\left(|f(y)|,\left|f^{\prime}(y)\right|\right)=m<\infty$ and $k=\max _{u}\left|f^{\prime \prime}(u)\right|$, we have:
$\max _{x}\left|y_{n+1}-y_{n}\right| \leq \frac{b^{2}(k / 8)}{1-\left(b^{2} m / 4\right)}\left(\max _{x}\left(\left|y_{n}-y_{n-1}\right|\right)^{2} .\right.$ (13)
If convergence occurs, the quasilinearization approach exhibits quadratic convergence.
3.3 Convergence of Haar wavelet method [15]
In the interval, the value of $t \in[0,1]$. Then, the Haar wavelet can be computed as
The notations are used as
$h_{i}(x)= \begin{cases}1 & \text { for } t \in\left[\tau_{1}, \tau_{2}\right] \\ -1 & \text { for } t \in\left[\tau_{2}, \tau_{3}\right] \\ 0 & \text { elsewhere }\end{cases}$ (14)
where, $2^{j} j=0,1, \ldots, J$ is an integer; $k=0,1, \ldots, m-1$ is the value of the translation parameter $k=0,1, \ldots, m-1$, indicating the wavelet level. The integer $\mathrm{J}$ determines the maximal level of resolution.
$\tau_{1}=\frac{k}{m}, \tau_{2}=\frac{k+(1 / 2)}{m}, \tau_{3}=\frac{k+1}{m} .$ (15)
The index value $\mathrm{i}$ is computed as $i=m+k+1 ; i=2$ is the minimal value (then $m=1, k=0$ ) and $i=$ $2 M$ is the maximal value, where $M=2^{J}$. The index $i=1$ corresponds to the scaling function of the Haar wavelet $h_{1}(t) \equiv 1$.
The simple calculations are as follows:
$\int_{0}^{1} h_{i}(t) h_{l}(t) d t= \begin{cases}\frac{1}{m} & \text { for } i=l \\ 0 & \text { for } i \neq l\end{cases}$ (16)
Consequently, the functions $h_{i}(t)$ are orthogonal.
The proposed approach was compared with current methodologies on various metrics in MATLAB, including precision, recall, F-measure, and accuracy.
4.1 Performance metrics
Accuracy is calculated by dividing the number of test records by the number of successfully classified records. Precision measures the probability of a sample classified as positive to actually be positive. Recall is the number of true positives (TP) divided by the number of TP plus the number of false negatives (FN). Precision, recall, F-measure, and accuracy can be respectively calculated by:
F-measure combines the true positive rate (TPR), i.e., recall, and precision Pr into a single utility function, which is defined as $\gamma$-weighted harmonic means:
$F_{\gamma}=\frac{1}{\gamma(1 / \operatorname{tpr})+(1-\gamma)(1 / \operatorname{Pr})}$, where $0 \leq \gamma \leq 1$ (17)
where, $\gamma$ is a parameter that can emphasize either precision or recall.
Accuracy is a common metric for the performance of categorization techniques.
Accuracy $_{i}=\frac{\mathrm{TP}_{\mathrm{i}}+\mathrm{TN}_{\mathrm{i}}}{\mathrm{TP}_{\mathrm{i}}+\mathrm{FP}_{\mathrm{i}}+\mathrm{FN}_{\mathrm{i}}+\mathrm{TN}_{\mathrm{i}}}$ (18)
where, TPi is the number of correctly classified records belonging to the kidney disease class; FPi is the number of records incorrectly classified as having kidney disease; FNi is the number of records not classified as having a kidney disease TNi is the number of images that were not assigned to the correct kidney disease class.
Precision (P) quantifies the proportion of correct positive outcomes among all possible outcomes:
$P=T P /(T P+F P)$ (19)
Specificity measures the system ability to accurately recognize the absence of impurities in the ghee image in the current class. To obtain specificity, the number of true negatives recognized in the images must be counted, and divided by the amount of pure milk included in the images. It determines the specificity of the data.
Specificity $(S P)=(T N) /(T N+F P)$ (20)
Mean is a straightforward approach in pure mathematics, analysis, and computing. Various means have been invented to perform these duties. During an image processing, mean filtering is utilized for noise reduction.
$\bar{X}=\frac{\sum_{i=0}^{n} X_{i}}{n}$ (21)
Standard deviation provides a measure of variability or diversity in statistics. In the context of image processing, standard deviation indicates fraction of variance or dispersion occurs between the predicted value and the observed value. If standard deviation is very low, then the data points are highly likely to be incredibly near to one another. If standard deviation is very high, the data points are evenly distributed.
$\bar{X}_{r m s}=\sqrt{\frac{\sum\limits_{{{X}_{i}}=1}^{n}{{{({{X}_{i}}-\bar{X})}^{2}}}}{(n-1)}}$ (22)
Here, Anaconda, an enterprise-ready, secure, and scalable data science platform and Spyder are utilized to build the simulation environment for our approach (Python 3.6). We downloaded a kidney disease dataset containing 400 patient records to evaluate the performance of our approach. The data were preprocessed to remove null values. Then, the preprocessed data were divided into a training set (80%) and a test set (20%).
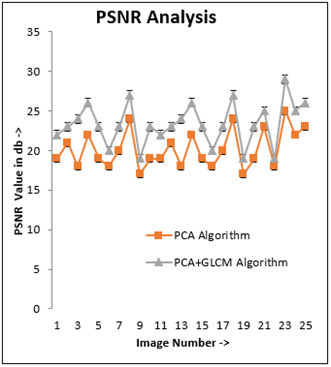
Figure 3. Peak signal-to-noise ratio (PSNR) comparison
Firstly, CMF detection was carried out separately by PCA and PCA plus GLCM. As shown in Figure 3, the latter approach gave a better PSNR value than the PCA.
Figure 4. Mean squared error (MSE) comparison PCA outperformed GLCM for the Mean Squared error
Figure 4 compares the MSEs of PCA and PCA plus GLCM. It can be seen that PCA plus GLCM produced a 4% higher MSE than PCA.
Figure 5. Accuracy comparison
Figure 5 compares the accuracies of PCA and PCA plus GLCM. Our approach achieved better accuracy than PCA.
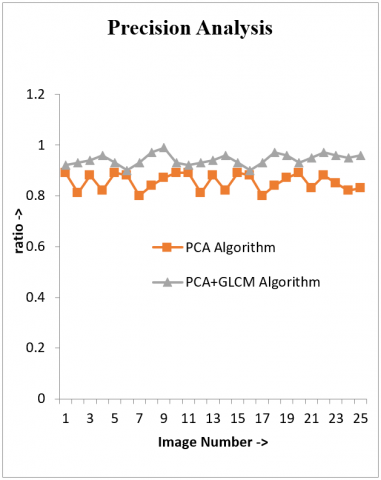
Figure 6. Precision comparison
Figure 6 shows that the precision of PCA plus GLCM is better than PCA.
Figure 7. Recall comparison
Figure 7 suggests the recall of PCA plus GLCM is better than PCA.
The superiority of our approach is discussed as follows: In our approach, PCA is adopted to extract feature matching blocks, while GLCM is called to detect texture features. The combination of PCA and GLCM determines the self-correlations in different blocks of feature data. During the reconstruction of the forgery surface, the combined method minimizes the MSE. The simulation on various features and matching systems shows that our approach produced significantly better results than prior approach. Image data would be successfully protected from anonymous intrusions, if the proposed strategy is implemented successfully.
Image processing handles the data collected in the form of images, while forgery detection aims to identify the altered parts of the input image. The existing approach uses the PCA algorithm to identify forgery. In this work, the GLCM algorithm is applied along with the PCA algorithm to identify forgery. This hybrid approach detects the texture features of the original image by calculating the co-occurrence matrix, and marks all forged parts on the image. MATLAB simulations prove that our approach enjoys a high PSNR and a low MSE.
[1] Kang, L., Cheng, X.P. (2010). Copy-move forgery detection in the digital image. 2010 3rd International Congress on Image and Signal Processing (CISP 2010), pp. 2419-2421. https://doi.org/10.1109/CISP.2010.5648249
[2] Agarwal, R., Jalal, A.S., Arya, K.V. (2020). Enhanced Binary Hexagonal Extrema Pattern (EBHXEP) descriptor for iris liveness detection. Wireless Personal Communications, 115(3): 2627-2643. https://doi.org/10.1007/s11277-020-07700-9
[3] Bayram, S., Avcibas, I., Sankur, B., Memon, N. (2006). Image manipulation detection. Journal of Electronic Imaging, 15(4): 041102.
[4] Popescu, A.C., Farid, H. (2005). Exposing digital forgeries by detecting traces of resampling. IEEE Transactions on Signal Processing, 53(2): 758-767. https://doi.org/10.1109/TSP.2004.839932
[5] Johnson, M.K., Farid, H. (2005). Exposing digital forgeries by detecting inconsistencies in lighting. Proc. ACM Multimedia and Security Workshop, New York, pp. 1-9. https://doi.org/10.1145/1073170.1073171
[6] Swaminathan, A., Wu, M., Liu, K.J.R. (2006). Image tampering identification using blind deconvolution. 2006 International Conference on Image Processing, pp. 2309-2312. https://doi.org/10.1109/ICIP.2006.312848
[7] Sutcu, Y., Coskun, B., Sencar, H.T., Memon, N. (2007). Tamper detection based on the regularity of wavelet transform coefficients. 2007 IEEE International Conference on Image Processing, pp. I - 397-I – 400. https://doi.org/10.1109/ICIP.2007.4378975
[8] Singh, K.U., Singhal, A. (2018). Channelized noise augmentation to endorse DICOM medical image for diagnosing. Journal of Advanced Research in Dynamical and Control Systems, 10(6): 2228-2247.
[9] Kumar, A., Singh, K.U., Raja, L., Singh, T., Swarup, C., Kumar, A. (2021). Design a framework for content based image retrieval using hybrid features analysis. Traitement du Signal, 38(5): 1449-1459. https://doi.org/10.18280/ts.380520
[10] Agrawal, R., Jalal, A.S., Arya, K.V. (2019). Fake fingerprint liveness detection based on micro and macro features. International Journal of Biometrics, 11(2): 177. https://doi.org/10.1504/ijbm.2019.099065
[11] Li, G., Wu, Q., Tu, D., Sun, S. (2007). A sorted neighborhood approach for detecting duplicated regions in image forgeries based on dwt and SVD. 2007 IEEE International Conference on Multimedia and Expo, pp. 1750-1753. https://doi.org/10.1109/ICME.2007.4285009
[12] Luo, W., Huang, J., Qiu, G. (2006). Robust detection of region-duplication forgery in digital image. 18th International Conference on Pattern Recognition (ICPR'06), pp. 746-749. https://doi.org/10.1109/ICPR.2006.1003
[13] Bayram, S., Sencar, H., Memon, N. (2009). An efficient and robust method for detecting copy-move forgery. 2009 IEEE International Conference on Acoustics, Speech and Signal Processing, pp. 1053-1056. https://doi.org/10.1109/ICASSP.2009.4959768
[14] Lin, C.Y., Wu, M., Bloom, J.A., Cox, I.J., Miller, M.L., Lin, Y.M. (2001). Rotation, scale, and translation resilient watermarking for images. IEEE Trans. Image Processing, 10: 767-782. https://doi.org/10.1109/83.918569
[15] Gupta, G., Girdhar, A. (2018). A robust passive method for detection of copy-move forgery in images. In Second IEEE International Conference on Inventive Computation Technologies, pp. 1-6.
[16] Yeap, Y.Y., Sheikh, U.U., Ab Rahman, A.A. (2018). Image forensic for digital image copy move forgery detection. 2018 IEEE 14th International Colloquium on Signal Processing & Its Applications (CSPA 2018), pp. 239-244. https://doi.org/10.1109/CSPA.2018.8368719
[17] Singh, K.U., Singh, V.K., Singhal, A. (2018). Color image watermarking scheme based on QR factorization and DWT with compatibility analysis on different wavelet filters. Journal of Advanced Research in Dynamical and Control Systems, 10(6): 1796-1811.
[18] Wu, Y., Abd-Almageed, W., Natarajan, P. (2018). Image copy-move forgery detection via an end-to-end deep neural network. 2018 IEEE Winter Conference on Applications of Computer Vision (WACV), pp. 1907-1915. https://doi.org/10.1109/WACV.2018.00211
[19] Shabanian, H., Mashhadi, F. (2017). A new approach for detecting copy-move forgery in digital images. 2017 IEEE Western New York Image and Signal Processing Workshop (WNYISPW), pp. 1-6. https://doi.org/10.1109/WNYIPW.2017.8356252
[20] Dixit, R., Naskar, R., Sahoo, A. (2017). Copy–move forgery detection exploiting statistical image features. 2017 International Conference on Wireless Communications, Signal Processing and Networking (WiSPNET), pp. 2277-2281. https://doi.org/10.1109/WiSPNET.2017.8300165
[21] Tilak Babu, SBG., Srinivasa Rao, C. (2022). An optimized technique for copy–move forgery localization using statistical features. ICT Express, 8(2): 244-249. https://doi.org/10.1016/j.icte.2021.08.016
[22] Hajialilu, S.F., Azghani, M., Kazemi, N. (2020). Image copy-move forgery detection using sparse recovery and keypoint matching. IET Image Process., 14(12): 2799-2807. https://doi.org/10.1049/iet-ipr.2018.6246
[23] Dixit, A., Bag, S. (2020), Composite attacks-based copy-move image forgery detection using AKAZE and FAST with automatic contrast thresholding. IET Image Process., 14(17): 4528-4542. https://doi.org/10.1049/iet-ipr.2020.1118
[24] Mishra, A., Agrawal, R., Khan, M.A., Jalal, A.S. (2019). A robust approach for palmprint biometric recognition. International Journal of Biometrics, 11(4): 389. https://doi.org/10.1504/ijbm.2019.102881
[25] Agarwal, R., Jalal, A.S., Arya, K.V. (2020). Local binary hexagonal extrema pattern (LBHXEP): A new feature descriptor for fake iris detection. The Visual Computer, 37: 1357-1368. https://doi.org/10.1007/s00371-020-01870-0