Neethu M Sathyan* | Sashi Rekha Karthikeyan
© 2022 IIETA. This article is published by IIETA and is licensed under the CC BY 4.0 license (http://creativecommons.org/licenses/by/4.0/).
OPEN ACCESS
The cold spot identification approach is limited due to the lack of high-resolution infrared thermal images. To solve the problem, infrared thermal images are enhanced using several ways. To improve the thermal images for cold spot detection, researchers used CLAHE, the Canny edge detection method, and deep learning approaches based on denoising autoencoder. The comparison of several enhancement methods based on quality metric factors leads to the selection of the best method. The noise in the Infrared (IR) image is reduced by using a high-resolution autoencoder. The ability to convert a 32 × 32 infrared image to a 64 x 64 resolution image is demonstrated. This study presents an information visibility restoration technique that includes stacked Denoising Autoencoder (DAE) to improve anomalous areas in the condenser's infrared thermal images keeping in mind the current popularity of deep learning models in machine learning. The use of a deep learning autoencoder improves structural similarity index of the image, which is comprehensive. The structural similarity index of the image is improved when a deep learning autoencoder is used. In comparison to CLAHE and the Canny edge detection approach, substantial research indicates that the High-resolution autoencoder is best suited for IR image improvement. Thermal imaging, the suggested technique can improve anomalies without sacrificing crucial information when compared to the straight discriminant analysis.
thermal imaging, IR, canny edge detection, high-resolution autoencoder, condenser image, SNR, MSE, structural similarity index measure
Nowadays, contactless imaging has become more popular for determining the temperature profile of an object. Infrared cameras are the most popular cameras used for this purpose. Visible lights are electromagnetic waves that can be seen through the naked eyes. In this visible light, we can see red to violet colors. The naked eye cannot see Infrared light, but it is useful for finding the temperature profile of the object surface [1]. All material emits infrared radiation, and when the temperature of the material increases, the wavelength of IR radiation decreases. Infrared light helps rescue workers equipped with longwave IR sensors to find out a lost person in forest in the night [2]. IR radiation can penetrate well in fog and smoke than the normal light and can reveal covered objects. IR sensors can detect the presence of a hotspot or cold spot in equipment or an electric circuit [3].
For some decades, Pulsed thermography (PT) could be used in the manufacturing industry as a non-destructive evaluation (NDE) method for defective spotting. It requires an external heating element to warm the element and would then reduce the temperature for a set duration of time. In the meantime, an infrared camera records a visual of the average temperature characteristics of the items. The interface, as well as close features of the element, could be assessed using the same temperature distributions. Infrared imaging can make tremendous applications in medical, industrial, defense, and agricultural fields. In industries, most of the problem occurs due to the mechanical or electrical issues of equipment [4]. Any damage in one piece of equipment leads to secondary damage of related equipment or interruption of the entire process. This will cause substantial financial loss to the industry. Equipment structural health can be identified in most of the cases using its temperature emission. The surface temperature profile of any object can easily be detected using Infrared cameras. Nowadays the Infrared thermography emerging technology is used for identifying the mechanical and electrical issues of equipment. This technology is contactless, fast, reliable, and can scan large areas within a short time.
The steam turbine power plant efficiency depends on the condenser performance. The condenser performance degradation due to air ingress can be identified by helium leak test, tracer gas method, and infrared camera. But due to the low resolution of the thermal image and very less temperature difference in the surface of the condenser, it is very difficult to understand the leakage of the Condenser through infrared image assessment. The proposed research work overcomes these issues by using high-resolution infrared cameras and advanced image processing tools and deep learning networks. The data for the research work is collected from Ratnagiri Gas Power Plant Ltd with a capacity of a 1967MW combined cycle power plant. The study has been conducted with 500 infrared thermal images of the condenser to detect the cold spot detection of the condenser air ingress test.
In industries, most equipment failure occurs due to the electrical or mechanical problems of equipment parts. If the problem is identified earlier, it will avoid equipment failure. Soliman [5] in most of the issues, shows the temperature difference on the surface. The infrared camera captures the infrared radiations emitted by the object. The camera denotes the surface temperature profile of the object in RGB color format. The infrared camera is helpful for hot spot and cold spot detection of equipment. In RGB color format, the hot spot is represented using red color. A hotspot is useful for finding short circuits, electric sparks, overheating parts of devices, etc. [6]. A cold spot means significantly less temperature compared to other parts of an image. In RGB color format, it is denoted using blue color. Cold spot detection helps find leakage in vacuum areas, cooling system leakage, etc. [7].
Advance infrared cameras Fluke 480 PRO is used for capturing the condenser image. It has a resolution of 640 x 480. Super-resolution of the 1280 x 960. The thermal sensitivity of the camera is less than 0.05℃. Image For improving the quality of IR, images use several image enhancement tools. In the RGB image, the cold spot is always located in the blue-colored area. The paper describes different thermal image enhancement techniques such as Contrast Limited Adaptive Histogram Equalisation (CLAHE), Canny edge detection algorithm, and high-resolution autoencoder deep learning methods. The performance assessment of the above enhancement methods is depicted, which gives the suitability of different methods for infrared thermal image enhancement.
The high-resolution autoencoder supervised learning method is effective for infrared thermal image enhancement. Through deep learning algorithms had reached the state-of-the-art quality of picture segmentation as well as picture retrieval challenges, the scenario in the NDE domain seems to be rather opposite, because of frequently hidden defects beneath the ground, it is also difficult to collect 100 percent correct regression coefficients labeling for the learning of a guided deep learning algorithm. Reliable, high accuracy is established by undertaking disruptive examination, such as transversal breaking of metal. Therefore, such a strategy could quickly grow extremely expensive and difficult. Moreover, it is understood that the strength of the tagging does have a significant impact on the findings. Such underlines the significance of reliable and accurate classification algorithm information about the effects' position as well as meteorological dimensions in the NDE field. These works are considered a self-supervised learning approach with stacked DAE to analyze temperature information to solve the accuracy tagging difficulty because this strategy does not rely on human past information but rather on the information themselves.
3.1 Condenser cold spot application
In a thermal power plant, electricity is generated using steam, high-pressure steam generated in a steam generator expanded in a turbine produces electricity. The condenser converts the low-pressure steam from the turbine to water. Water is then pumped into the steam generator for continuing the cycle. The condenser always maintains a vacuum inside it. Transferring heat to circulate water inside the condenser tubes, and saturated steam is passed outside the condenser tubes. Condenser pressure decreases with condenser temperature reduction, subsequently, the power plant efficiency will increase [8]. Condenser air ingress can be identified using lots of technologies such as helium leakage test [9]. It is time-consuming and expert knowledge is required for leakage detection.
The condenser is in a vacuum, the insoluble gases present in steam deteriorate the condenser vacuum. This rise in the condenser pressure leads to a reduction in power plant output and efficiency. Insoluble gases will blanket the heat transfer surface of the tubes, which reduces the heat transfer to the circulating water. Condenser air ingress detection is a challenging process. Methods like helium leak test, passage of helium gases through the condenser and helium detection will be placed on the chances of getting leaked [10]. So, in this case, expert knowledge is required. This is a well-proven technology in the industry.
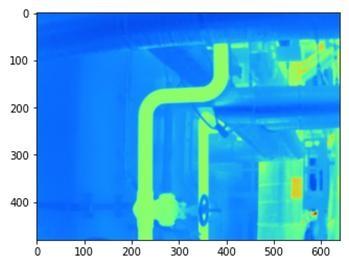
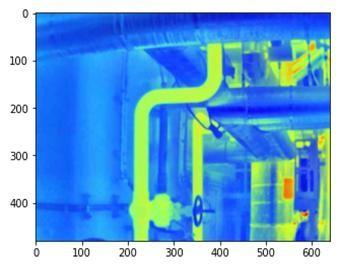
The other emerging techniques for condenser air ingress tests are IR thermal image assessment and ultrasound assessment methods. In the case of IR imaging of condensers, cold spot detection is also a challenging process by Balamurugan et al. [11]. IR camera captures the surface temperature profile of the condenser. Cold spot detection is a challenging process due to the temperature difference between the surface being significantly less. Hence the method is not so successful in the industries for the air ingress test. So cold spot detection using IR imaging requires advanced Image enhancement and other image processing tools for locating air ingress. Figure 1 shows the visible and IR thermal image of a condenser-connected pipeline flange.
Figure 1. Infrared thermal image
3.2 Cold spot identification challenge using IR
The condenser always maintains vacuum inside; hence the surface is concealed. Identification of surface temperature differences using IR imaging requires good quality IR image. A high-resolution camera is necessary for the same. An infrared image of the condenser gives us a surface temperature profile. The condenser surface temperature difference is meager. Maintain the vacuum condition in the condenser, which is concealed with a protective covering [12]. So the temperature variation in the surface area will be very low. The atmospheric air ingress leads to a slight reduction in the temperature of the surrounding area of the ingress point. The flanges connected to the condenser are the most probable location of air ingress.
The thermal image enhancement algorithm can be used to improve the quality of the image. The thermal image is typically represented using grayscale or RGB. The different shades of grayscale represent the different values of temperature on the surface. In the grayscale image, the different light grey colors denote high temperature and dark grey colors denote less temperature on the surface. RGB image, red color denotes high-temperature location, and blue color indicates less temperature. An enhanced blue area is required for identifying the cold spot.
3.3 Deep learning in thermal information processing
Several digital image challenges, like object classification and image analysis, have already shown that the deep learning algorithm works well. As a result, several researchers have concentrated on using certain techniques to analyze the information. To identify breaks in metal specimens, a deep conventional system is trained to point on information obtained using eddy current pulsing thermal imaging. Autoencoder, layered autoencoder, and diagnosing autoencoder are three types of autoencoders.
An autoencoder seems to be a sort of deep net that converts model parameters into a compact space and thereafter rebuilds the actual information using those compressed characteristics. The encoding, as well as decoding, are the two halves of an autoencoder. The transmitter converts an input into a compacted space, while the decoding reshapes the information. It could be self-taught because the broadcaster's input could be utilized as a clear reference to the cable network outcome. Its fundamental construction is depicted in Figure 2.
Figure 2. The model architecture of autoencoder
4.1 Image acquisition
The thermal image can be captured using an infrared camera. The spatial distribution of the surface temperature difference of an image is depicted in the visible image. This is possible by capturing infrared radiation which is emitted by the object and converted into visual form. Hence using an infrared camera represent the spatial distribution of surface temperature [13]. The application requires remote sensing of temperature; infrared imaging is more appropriate. RGB color format is used to depict the temperature difference. Thermal images can be captured using high-resolution infrared cameras such as Fluke Ti480 PRO. It has a super-resolution of 1280 x 960 pixels.
4.2 Enhancement of image quality
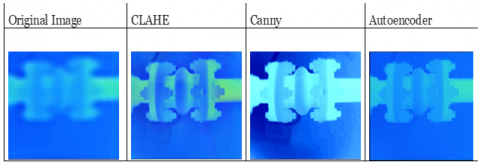
The quality of the thermal image is vital for thermal image processing. Different techniques are available for visual image enhancement, including histogram equalization, and adaptive histogram equalization [14]. For noise reduction, different filters such as median filter, Gaussian filter, Weiner filter can be applied [15]. Hybrid image enhancement methods are based on the objective of thermal image processing. Image enhancement is applied in both greyscale and RGB format. Blackhat transform approach histogram equalization and CLAHE is used for image enhancement [16]. Canny edge algorithm is used for enhancement of input images in Canny edge color segmentation approach.
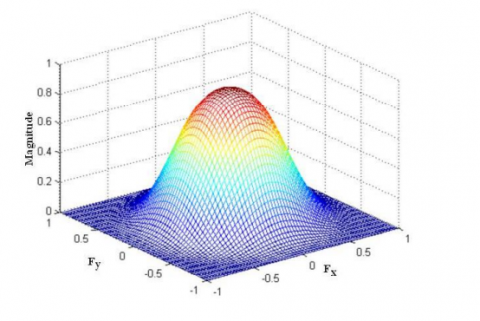
Figure 3. A plot of frequency response of 7-taps filter
The characteristic of the frequency response of the 7-taps kernel (Figure 3) shows Gaussian distribution. Hence the 7-taps kernel is used for the processing of Laplacian Pyramid based spatial enhancement an improved Canny edge algorithm gives better results than the traditional Canny edge algorithm in infrared image enhancement which is described by Liu et al. [17]. Canny Edge algorithm uses morphological operation for smoothening and OTSU method used in the double thresholding. An end-to-end infrared small target detection model is based on a denoising autoencoder network according to Shi and Wang [18]. Several strategies are used to improve the quality of thermal images. The approaches listed below can be used to improve the image quality of thermal images.
4.3 Contrast limited adaptive histogram equalization (CLAHE)
It corrects for contrast overamplification. It works on small regions than the whole image. The surrounding tiles are mixed using bi-directional interpolation. When there are parts of the image that are much brighter or darker than the rest of the image, the contrast in these areas will be inadequately improved. AHE relies on this by transforming each pixel with a transformation function derived from a neighborhood region. Abood [19] described the contrast enhancement of Infrared images using CLAHE. After calculating the histogram of the IR image, it calculates the density function.
$\operatorname{cdf}_{x}(i)=\sum_{j=0}^{i} p\left(x_{i}\right)$ (1)
where, sk is the new distribution of the histogram () pxi is related to the probability of occurrence of intensity level in an image. After normalizing the histogram equalization calculates the new distribution divide the image into three regions according to the specification of every region that is different from another region. Calculate the slope of every region.
Calculate the clip limit by using the equation:
$\beta=\frac{\mathrm{MN}}{\mathrm{L}_{\max }}\left(1+\frac{\alpha}{100}\left(\mathrm{~S}_{\max }-1\right)\right)$ (2)
where, α is the cutting factor, $\beta$ is the clip limit, $S_{\max }$ maximum possible slope.
When α varies between zero and hundred, the maximum slope between 1 and $S_{\max }$ is changed. Therefore, subdividing the whole image into subregions. Each of the histogram is evaluated and it is cut into the value. This redistributes all the values. Figure 4 shows the representation of the input image, the CLAHE enhanced image.
Algorithm 1: Enhancement of CLAHE image
Step 1; Excess is initialized to 0
Step 2: for m ranges from 0 to m-1
if g(m)>α, then
Excess+=g(m) – α
g(m) = α
end if
end for
Step 3: n=Excess/m
for m ranges from 0 to m-1
if g(m) < α-n, then
g(m)+=n
Excess+=n
else if g(m)<α, then
Excess-=α+g(m)
g(m)=α
end if
end for
Step 4: while Excess is greater than 0
for m ranges from 0 to m-1
if Excess> 0 then
if g(m)<α-n, then
g(m)+=1
Excess-=1
end if
end if
end for
end while
Figure 4. The IR image of a condenser and enhanced CLAHE image
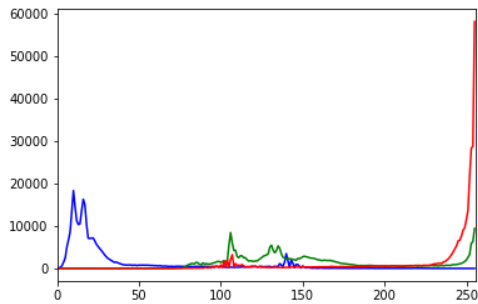
The CLAHE algorithm-based enhancement shows the clear visual change in the image. The image quality assessment values also indicate the enhancement of the image. The Signal to Noise Ratio and Mean Square Error of the enhanced image are 29 and 0.38 respectively. The human visual perception indicates structural similarity index measure (SSIM) is 0.7488. Figure 5 shows the histogram of the IR image of condenser and its enhanced image.
(a)
(b)
Figure 5. The histogram of IR image of a condenser and histogram of enhanced image
4.4 Canny edge detection algorithm
It is thought to be a better (in terms of false alarms) edge detection than the others. This is primarily due to Non-Maximum Suppression-Edges candidates that are not dominant in their vicinity are not considered edges and the Hysteresis Process entails traveling along with the candidates and lowering the threshold when a candidate is in the vicinity of an edge.
The Canny edge detection follows the following steps
1. Noise reduction
A Gaussian filter is used to smooth the edges. The equation for a Gaussian filter with (2k+1)*(2k+1) is
$\mathrm{H}_{\mathrm{ij}}=\frac{1}{2 \pi \sigma^{2}} \exp \left(-\frac{(\mathrm{i}-(\mathrm{k}+1))^{2}+(\mathrm{j}-(\mathrm{k}+1))^{2}}{2 \sigma^{2}}\right)$ (3)
2. Calculate the gradient
It calculates the stage of edge detection and intensity of direction by computing the image's gradient using: horizontal (x) and vertical (y). The derivatives Kx and Ky concerning x and y are determined for image smoothening. It is possible to implement it by convolving x with the Sobel kernels.
$\mathrm{K}_{\mathrm{x}}=\left[\begin{array}{ccc}-1 & 0 & 1 \\ -2 & 0 & 2 \\ -1 & 0 & 1\end{array}\right], \mathrm{K}_{\mathrm{y}}=\left[\begin{array}{ccc}1 & 2 & 1 \\ -2 & 0 & 2 \\ -1 & -2 & -1\end{array}\right]$ (4)
The gradient's magnitude G and slope are determined as follows.
$|G|=\sqrt{\mathrm{I}_{\mathrm{x}}^{2}+\mathrm{I}_{\mathrm{y}}^{2}}, \theta(\mathrm{x}, \mathrm{y})=\arctan \left(\frac{\mathrm{I}_{\mathrm{y}}}{\mathrm{I}_{\mathrm{x}}}\right)$ (5)
3. Non-maximum suppression
Non-maximum suppression works by locating the pixel in an edge with the highest value.
4. Double threshold
It applies the following two thresholds to the data: Values that are equal to or greater than the higher criterion remains unaffected.
5. Hysteresis-based edge tracking
The majority of thresholds employed a single threshold limit, which means that if the edge values move above and below this number, the line seems broken. Figure 6 shows the images of Canny edge detection algorithms.
Figure 6. IR condenser image and Canny edge algorithm
4.5 High-resolution autoencoder
Auto-encoders are a type of CNN that learn how to encode effectively and compress data, before learning how to decode the compressed version and retrieve the original entry. The encoder and decoder network are the two most important components. The network of encoders retrieves the data and compresses it by deleting some of the unecessary elements. The decoding network will then use the original image representation to recreate the original image. If the rebuilt input deviates from the original input during training, the loss will be substantial, thus the model will learn to reconstruct the data as close to the original input data as possible.
The autoencoder is used to improve the image quality, if it is designed correctly, it will try to restore the original data provided to the network. The proposed method makes modest adjustment in calculating loss function to achieve image improvement using encoders. High-resolution thermal images are first converted into low-resolution images, which are utilized as input images for training the network. The high-resolution images are then used as targets for training the network. A learning algorithm is capable of converting a low-quality picture to a high-quality picture. As a result, if any image is fed into the network, it will return an enhanced image.
The encoder is a series of convolutional blocks followed by pooling modules that compress the input of the model into a small segment known as the bottleneck. The decoder follows the bottleneck, which comprises a set of upsampling modules that convert the compressed feature back into an image. When it comes to simple autoencoders, the outcome should be the same as the input with a reduction of noise.
The major part of the encoder-decoder consists of convolutional blocks and pooling modules. Here it uses 2D convolutional block. The equation shows the convolution of the image,
$[\mathrm{Yi}, \mathrm{j}]=\sum_{\mathrm{m}=-\infty}^{\infty} \sum_{\mathrm{n}=-\infty}^{\infty} h[m, n] \cdot x[i-m, j-n]$ (6)
The Autoencoder uses 400 Infrared images for training. The low-resolution images are given as the input to the network. Here Relu is used as an activation function. The input images data size is set as 64*64. Table 1 shows the model summary of denoising high-resolution enhancement. Figure 7 depicts the low-resolution image of the condenser IR image and the high-resolution condenser IR image as the output of the autoencoder.
Table 1. High-resolution autoencoder summary
|
Layer (types) |
Outcome Structure |
Param |
|
Conv3DConv2d_l |
(None, 64,64,128) |
3585 |
|
(Conv2D) |
(None, 64,64,64) |
73545 |
|
Conv2d_2 (Conv2D) |
(None, 64,64,32) |
18533 |
|
Max_pooling2d |
(None, 32,32,32) |
0 |
|
Conv2d_3 (Conv2D) |
(None, 32,32,16) |
4682 |
|
Conv2d_4 (Conv2D) |
(None, 32,32,16) |
2415 |
|
Up_sampling2d |
(None, 64,64,16) |
0 |
|
Conv2d_5 (Conv2D) |
(None, 64,64,32) |
4631 |
|
Conv2d_6 (Conv2D) |
(None, 64,64,64) |
18562 |
|
Conv2d_7 (Conv2D) |
(None, 64,64,128) |
73520 |
|
Conv2d_8(Conv2D) |
(None, 64,64,32) |
3481 |
Figure 7. The low-resolution input image and high-resolution IR image of the condenser
Image quality can be assessed by comparing the values of SNR, MSE, SSIM. The image quality is good for greater SNR value, high entropy indicates a detailed image, MSE value will be closer to zero. The structural similarity measurement value is always in between 1 and -1. 1 indicates similarity between the image is more. Table 2 shows the quality assessment of two approaches of image and Canny color segmentation approach is slightly better than Blackhat transform approach.
The peak signal-to-noise ratio (PSNR) is the ratio of an image's maximum achievable power to the power of corrupting noise that influences the representation's quality. To calculate the PSNR of an image, it must be compared to an ideal clean image with the highest possible power. PSNR is defined by the equation,
$\mathrm{PSNR}=10 \log _{10} \frac{(\mathrm{L}-1)^{2}}{\mathrm{MSE}}$ (7)
MSE is the mean squared error & it is defined as:
$\mathrm{MSE}=\frac{1}{\mathrm{MN}} \sum_{i=0}^{\mathrm{m}-1} \sum_{j=0}^{\mathrm{n}-1}(\mathrm{O}(\mathrm{i}, \mathrm{j})-\mathrm{D}(\mathrm{i}, \mathrm{j}))^{2}$ (8)
The Structural Similarity Index (SSIM) is a perceptual metric that measures degradation of mage quality as a result of processing such as data compression or data transmission losses. It is a full reference metric that requires two images—a reference image and a processed image from the same image capture.
$\operatorname{SSIM}(x, y)=\frac{\left(2 \mu_{x} \mu_{y}+C_{1}\right)\left(2 \sigma_{x y}+C_{2}\right)}{\left(\mu_{x}^{2}+\mu_{\mathrm{y}}^{2}+C_{1}\right)\left(\sigma_{x}^{2}+\sigma_{y}^{2}+C_{2}\right)}$ (9)
where, μx the average of x, μythe average of $\mathrm{y}, \sigma_{\mathrm{x}}^{2}, \sigma_{\mathrm{y}}^{2}$ the variance of x and y, σxy the covariance of x and y. C1=(K1L)2, C2=(K2L)2 two variables to stabilize the division with weak denominator, L the dynamic range of pixel-values, K1=0.01 and, K2=0.03 by default. A comparative study of CLAHE, Canny Edge Detection algorithm, and High-resolution autoencoder is conducted, and the values are depicted in Table 2 based on the output.
Table 2. Quality measurement of different image enhancement techniques
|
|
SNR |
MSE |
SSIM |
|
CLAHE |
29.00 |
0.38 |
0.75 |
|
Canny Edge Detection |
12.66 |
0.42 |
0.42 |
|
High-resolution autoencoder |
31.00 |
0.25 |
0.91 |
Figure 8. Calculation of histogram
The Block diagram of its hardware realization is shown in Figure 8. For each pixel, the histogram and excess counter can be updated in less than six clocks. There will be no need for a buffer if the clock rate of the histogram engine is at least six times faster than the pixel arrival rate. However, if the clock rate is the same as the pixel arrival rate, there is a need for a buffer, with the size of 64 pixels on each engine. In this case, when the last pixel of each regional row arrives, there are still 53 pixels left for processing. The time for this processing is less than 318 clocks, which is less than the time that it takes for the first pixel of the next regional row, exactly 7×64=448
V component (in HSV model) and the L component (in LAB model) are enhancement adopted by CLAHE. The V and L components are divided into 8×8 tiles. The clip limit applied is 0.02. We applied Uniform distribution as the histogram frame for the tiles of the image. The modified gray levels expression for standard CLAHE technique with Uniform Distribution can be given as
$P=\left(P_{\text {Max }}-P_{\text {Min }}\right) \times R(f)+P_{\text {Min }}$ (10)
where, PMax–Maximum value of P PMin-Minimum value of P, R(f)-Cumulative distribution.
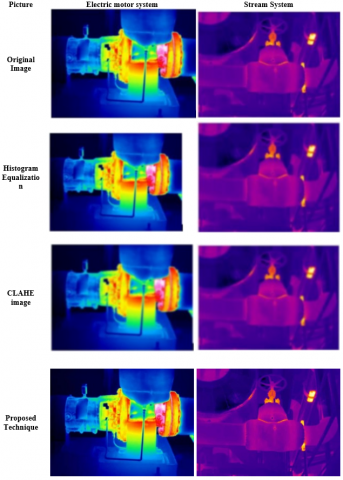
Figure 9 the results of thermal image enhancement demonstrated respectively by several methods: a- Original image. b- The histogram equalization method. c- The CLAHE method. d- The proposed method to enhance the image. The analysis infers that the proposed method demonstrates more specifics in the gained enhanced thermal images, which gives preferred visual quality over the histogram adjustment method and CLAHE. Table 3 shows experimental results for the lowest Image Enhancement Measure (EME) of original images and applies the processing of the proposed algorithm. It is noted that the results of the quality gained by the proposed algorithm are best concerns for EME measurement.
Figure 9. Comparison of proposed with existing systems
Table 3. EME measures results
|
Picture |
Original |
Histogram Equalization |
CLAHE |
Proposed Technique |
|
Tree |
0.834 |
8.434 |
5.034 |
16.23 |
|
Bus |
1.523 |
9.834 |
5.322 |
15.243 |
|
Road crossing |
4.098 |
18.543 |
18.854 |
30.234 |
|
hospital |
5.873 |
10.823 |
15.012 |
19.532 |
Condenser air ingress is detected using the thermal imaging of the condenser. The location of the thermal image cold spot denotes the point of air ingress. A high-resolution thermal image is a basic prerequisite for detecting cold spots quickly, which can be accomplished by enhancing the infrared image. Various IR image enhancement techniques are used on thermal images of the condenser to locate cold spots. Comparative research contrasts and compares the thermal image enhancement method to various other strategies. CLAHE, Canny edge algorithm, and high-resolution deep learning autoencoder are techniques for enhancing the quality of infrared images. The High-resolution autoencoder has a signal-to-noise ratio (SNR) of 31, which indicates that it produces less noise. The human visual perception indicator is the structural similarity index measure (SSIM), which has a higher value of 0.91 for high-resolution autoencoders. The High-Resolution Autoencoder algorithm performs better for Condenser cold spot identification as per the results of the comparison study. Air ingress in the condenser is identified accurately using high-resolution thermal imaging.
[1] Mamedova, R. (2021). Study profiles thermograms for determining diseases of the cattle limbs. InterConf, pp. 218-224. https://doi.org/10.51582/interconf.21-22.10.2021.029
[2] Liu, K., Qiao, W. (2019). PTB-TIR: A thermal infrared pedestrian tracking benchmark. IEEE Transactions on Multimedia, 22(3): 666-675. https://doi.org/10.1109/AVSS.2018.8639094
[3] Bianco, V., Mazzeo, P.L., Paturzo, M., Distante, C., Ferraro, P. (2020). Deep learning assisted portable IR active imaging sensor spots and identifies live humans through fire. Optics and Lasers in Engineering, 124: 105818. https://doi.org/10.1016/j.optlaseng.2019.105818
[4] Osornio-Rios, R.A., Antonino-Daviu, J.A., de Jesus Romero-Troncoso, R. (2018). Recent industrial applications of infrared thermography: A review. IEEE Transactions on Industrial Informatics, 15(2): 615-625. https://doi.org/10.1109/TII.2018.2884738
[5] Soliman, M.H.A. (2020). Industrial applications of infrared thermography: How infrared analysis can be used to improve equipment inspection. Mohammed Hamed Ahmed Soliman.
[6] Chou, Y.C., Yao, L. (2009). Automatic diagnostic system of electrical equipment using infrared thermography. In 2009 International Conference of Soft Computing and Pattern Recognition, pp. 155-160. https://doi.org/10.1109/SoCPaR.2009.41
[7] Bach, P.M., Kodikara, J.K. (2017). Reliability of infrared thermography in detecting leaks in buried water reticulation pipes. IEEE Journal of Selected Topics in Applied Earth Observations and Remote Sensing, 10(9): 4210-4224. https://doi.org/10.1109/JSTARS.2017.2708817
[8] Latchoumi, T.P., Balamurugan, K., Dinesh, K., Ezhilarasi, T.P. (2019). Particle swarm optimization approach for waterjet cavitation peening. Measurement, 141: 184-189. https://doi.org/10.1016/j.measurement.2019.04.040
[9] Gwynne, C. (2008). Looking for condenser air ingress. A summary of detection methods and the use of carbon dioxide as a tracer gas. Power Plant Chemistry, 10.
[10] Lebeda, S. (1985). Helium leakage test for a steam turbine condenser. Brown Boveri Review, 72(7): 376-378.
[11] Balamurugan, K., Uthayakumar, M., Sankar, S., Hareesh, U.S., Warrier, K.G.K. (2018). Preparation, characterisation and machining of LaPO4-Y2O3 composite by abrasive water jet machine. International Journal of Computer Aided Engineering and Technology, 10(6): 684-697. https://doi.org/10.1504/IJCAET.2018.095203
[12] Li, X., Wang, N., Wang, L., Kantor, I., Robineau, J.L., Yang, Y., Maréchal, F. (2018). A data-driven model for the air-cooling condenser of thermal power plants based on data reconciliation and support vector regression. Applied Thermal Engineering, 129: 1496-1507. https://doi.org/10.1016/j.applthermaleng.2017.10.103
[13] Lucchi, E. (2018). Applications of the infrared thermography in the energy audit of buildings: A review. Renewable and Sustainable Energy Reviews, 82: 3077-3090. https://doi.org/10.1016/j.rser.2017.10.031
[14] Mello Román, J.C., Vázquez Noguera, J.L., Legal-Ayala, H., Pinto-Roa, D.P., Gomez-Guerrero, S., García Torres, M. (2019). Entropy and contrast enhancement of infrared thermal images using the multiscale top-hat transform. Entropy, 21(3): 244. https://doi.org/10.3390/e21030244
[15] Stojanović, M., Vlahović, N., Stanković, M.S., Stanković, S.S. (2018). Deep Features in Correlation Filters for Thermal Image Tracking. In 2018 14th Symposium on Neural Networks and Applications (NEUREL), pp. 1-6. https://doi.org/10.1109/NEUREL.2018.8587030
[16] Arunkarthikeyan, K., Balamurugan, K. (2021). Experimental studies on deep cryo treated plus tempered tungsten carbide inserts in turning operation. In Advances in Industrial Automation and Smart Manufacturing, pp. 313-323. https://doi.org/10.1007/978-981-15-4739-3_26
[17] Liu, L., Liang, F., Zheng, J., He, D., Huang, J. (2018). Ship infrared image edge detection based on an improved adaptive Canny algorithm. International Journal of Distributed Sensor Networks, 14(3): 1550147718764639. https://doi.org/10.1177/1550147718764639
[18] Shi, M., Wang, H. (2020). Infrared dim and small target detection based on denoising autoencoder network. Mobile Networks and Applications, 25(4): 1469-1483. https://doi.org/10.1007/s11036-019-01377-6
[19] Abood, L.K. (2018). Contrast enhancement of infrared images using Adaptive Histogram Equalization (AHE) with Contrast Limited Adaptive Histogram Equalization (CLAHE). Iraqi Journal of Physics, 16(37): 127-135. https://doi.org/10.30723/ijp.v16i37.84