Yi Liu | Qian Zhang | Shuang Lu* | Lei Liu | Jing Zhang | Shuai Ma
© 2022 IIETA. This article is published by IIETA and is licensed under the CC BY 4.0 license (http://creativecommons.org/licenses/by/4.0/).
OPEN ACCESS
Tourist attractions need to optimize and upgrade their tourist services and tourist experience, according to the trendy topics on the Internet and the we media. This calls for objective evaluation of tourist experience, and accurately depiction of tourist emotions upon looking at tourism landscape images (TLIs). However, most of the existing methods for image emotional analysis cannot overcome the semantic gap, or handle an extraordinarily large image set. To solve the problems, this paper implements emotional analysis and annotation of TLIs based on tourist experience Firstly, the flow of tourist experience evaluation was expounded, and a model was constructed to evaluate tourist experience. Next, the forms of feature-based semantic information were specified for TLIs, and the emotional features were calculated for such images. After that, a semantic selection model was established to generate the emotional feature subsets of TLIs. Finally, the proposed model was verified through experiments on image emotional classification and annotation, and the relevant results were analyzed in details.
tourist experience, tourism landscape images (TLIs), emotional information, emotion annotation
Owing to the diversity of tourist experiences, the tourists from different cultures have varied emotions upon seeing the same tourism landscape image (TLI) [1-7]. If the same TLI has difference in basic features like color, shape, and texture, the tourists will also have different subjective feelings [8-14]. Based on the objective evaluation and analysis of tourists’ consumption preferences and their travel experience, it is possible to guide tourist attractions to optimize and upgrade their tourist services and tourist experience, according to the trendy topics on the Internet and the we media [15-19]. Thus, it is a challenging task to describe the emotions generated by tourists observing TLIs.
Yoshihara et al. [20] assessed the psychology of South Korean, Chinese, and Japanese tourists of the sightseeing landscapes of Hiroshima, and identified the new and attractive features to foreigners. A total of 40 scenes were selected as stimulus images for the psychological experiment, all of which come from the tourism homepage of Hiroshima Prefecture. Compared with the typical scenes of Japan, the selected scenes are immensely popular. Kota et al. [21] attempted to clarify how Chinese tourists evaluate Hiroshima’s tourism landscapes, and provide the basic data for boosting the number of Chinese tourists to Japan. The evaluation tendency and structure of each group of tourists were identified, according to the psychological evaluation relationship of each landscape image. Taking Jinji Mountain Park in Fuzhou as an example, Jin et al. [22] combined web text analysis and Ingenuity Pathway Analysis (IPA) model to discuss the tourist image perception of urban mountain parks from the angle of online big data. The results show that the tourist experience elements of the park had a high total score, reflecting the good overall tourist feelings of tourism activities, and the weakest element should be corrected. Chiu et al. [23] aimed to explore mobile-based cultural heritage tourism, as well as the design and production of tourists’ learning results. The participants were divided into control and experimental groups to examine their learning results of cultural and historical knowledge before and after the travel. It was found that independent foreign travel groups have difficulty in finding suitable attractions. Li and Sasaki [9] intended to develop an effective way to extract tourism features from the photos on tourism websites. Specially, a tourism feature extraction was designed, and an experiment was conducted to extract tourism feature words, trying to determine the threshold of feature filtering. Finally, the results of the proposed method were compared with the findings of the predecessors. The comparison demonstrates the feasibility and exposes the limitations of their approach.
There are many problems to be solved for the existing analyses on image emotions. The semantic gap may appear easily, if the top-layer emotional semantics are identified by the bottom-layer features of the image. This issue cannot be handled effectively by the existing approaches, which rely heavily on the limited set of emotional semantics. Despite its superiority in solving the semantic gap, deep learning models overlook the association between middle-layer semantics and emotional semantics, and cannot process an extraordinarily large image set. To solve the problems, this paper implements emotional analysis and annotation of tourism landscape images (TLIs) based on tourist experience Firstly, Section 2 expounds the flow of tourist experience evaluation, and constructs a model to evaluate tourist experience. Section 3 gives the forms of feature-based semantic information of TLIs, and calculates the emotional features for such images. Section 4 establishes a semantic selection model to generate the emotional feature subsets of TLIs. Finally, the proposed model was verified through experiments on image emotional classification and annotation, and the relevant results were analyzed in details.
The emotional attributes of TLIs refer to the cognitive-level semantics that trigger emotional responses of tourists, such as landscape objects, tourist scenes, and tourist behaviors. Tourist emotions are highly abstract, and their cognitive-level semantics differ sharply. As a result, it is very difficult to artificially construct a rich set of tourists’ emotional attributes. The tourists’ emotional attributes of TLIs can be automatically mined by analyzing the existing information about online tourist experience. To build a set of emotional features consistent with tourists’ emotional experience, this paper proposes a novel selection strategy for tourists’ emotional features. Specifically, a semantic selection model was constructed based on four emotional feature attributes, and used to select the tourists’ emotional attributes from the label set. This strategy fully utilizes the metadata on tourist experience, and effectively solves the defects with the current semantic set for TLI emotional analysis.
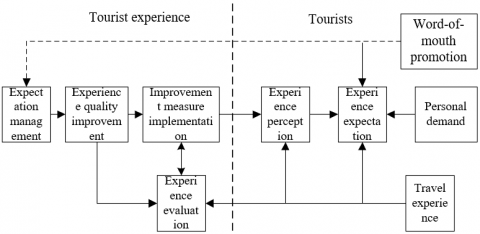
Based on the evaluation of the objective attributes of tourist experience, this paper adds dimensions like tourist expectation management, experience quality improvement, and improvement measure implementation, from the angle of tourism activities or tourist service providers. Figure 1 explains the flow of tourist experience evaluation. It can be seen that the evaluation of tourist experience needs to fully consider the difference between tourist expectation and the actual experience. The evaluation method can be widely applied to assess the tourist experience of various forms of tourism, including but not limited to self-driving tour, group tour, mountaineering, and folk culture experience.
Figure 1. Flow of tourist experience evaluation
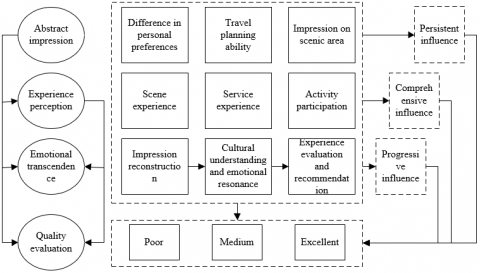
Based on tourist expectation, the proposed evaluation model for tourist experience adds the dimension of tourist experience perception to analyze how the interaction between tourist expectation and experience perception acts on the final tourist satisfaction (Figure 2). The evaluation involves the tourist experience quality on three layers, and focuses on the accumulation of tourist emotions. The measuring dimensions can be universally applied to different forms of tourism.
Figure 2. Tourist experience evaluation model
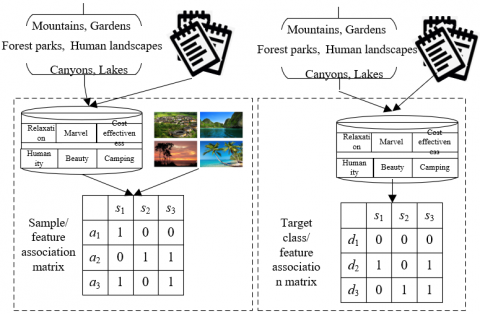
Judging by the features of the metadata on tourist epxerience, the emotional labels uploaded by many tourists are weakly correlated with the contents of TLIs. In these images, the importance of semantics is negatively proporitonal to the semantic gap. For a TLI, the highly modellable semantics tend to be specific, and the poorly modellable semantics tend to be abstract and uncertain. Hence, this paper clusters the image attributes related to tourist emotional labels in a specific TLI set, and evaluates the modellable degree of each semantic, according to the intra-class and between-class visual differences of images. This approach can extract tourists’ emotional labels from a few TLIs, and, to a certain extent, ease the problems of sample imbalance. Figure 3 shows the forms of feature-based TLI semantics.
Figure 3. Forms of feature-based TLI semantics
The semantic information of tourist experience for an image needs to be acquired based on visual features, in order to map TLI visual features to the target classes of emotions. As shown in Figure 3, the visual feature-based tourist experience semantics take one of the two forms: the association between emotional target classes and visual features, and the association between TLI samples and visual features.
Let Pi be the attribute set of associated emotional labels for an image. For each semantic d in the semantic set D, the semantic similarity between d and the i-th TLI can be calculated with Pi. Let δ(.) be the cosine similarity between input vectors. Then, the semantic similarity SIS(d,ai) between the semantic d and the i-th TLI can be calculated by:
$\operatorname{SIS}\left(d, a_{i}\right)=\frac{1}{n} \sum_{p_{i j} \in P_{i}} \delta\left(d, p_{i j}\right)$ (1)
According to the semantic similarity SIS(d,ai), the top-L TLIs are selected to form the representative image set of each semantic. Let fl be the l-th image cluster of semantic d; δ(ai,aj) be the cosine distance between the i-th and j-th image attributes in the cluster. Then, the intra-cluster visual difference VD(fl) of each image cluster can be calculated by:
$V D\left(f_{l}\right)=\frac{1}{\left|f_{l}\right|} \sum_{a_{i}, a_{j} \in f_{l}} \delta\left(a_{i}, a_{j}\right)$ (2)
Let a*fl be the mean vector of all visual attributes in the l-th image cluster. Then, the intra-cluster visual difference ICD(F) can be calculated by:
$\operatorname{ICD}(F)=\frac{\sum_{\forall f_{i}, f_{j} \in F} \quad \delta \left(a_{f_{i}}^{*}, a_{f_{j}}^{*}\right)}{|F| *(|F|-1)}$ (3)
Formula (3) shows that the ICD(F) can be derived from the cosine distance between the mean visual attributes of any two clusters in the set of image clusters. Similar to VD(fl), the smaller the ICD(F), the higher the modellable degree of the corresponding semantic.
Information entropy can measure the stability of image visual attributes associated with a specific semantic. Let B be a random variable; m be the sample size. Then, the information entropy of a random value bi with the probability of GAi can be calculated by:
$F\left(b_{i}\right)=-\sum_{i=1}^{m} G A\left(b_{i}\right) \log _{2} G A\left(b_{i}\right)$ (4)
To obtain the final modellable degree SM(d) of each semantic, this paper takes VD(fl) as the probability weight of each cluster, and amplifies the information entropy of each image cluster for the semantic, in combination with ICD(F). Let η(fl) be the ratio of the number of intra-cluster images to the number of representative images. Then, ON(d) can be calculated by:
$O N(d)=\left\{\sum_{i=1}^{L} V D\left(f_{l}\right) \times \eta\left(f_{l}\right) \log \eta\left(f_{l}\right)\right\}\times(1+\operatorname{ICD}(F))$ (5)
Then, the semantic modellable degree SM(Ψ) of the semantic feature set can be calculated by:
$O N(\Psi)=\sum_{d \in \Psi} O N(d)$ (6)
Formula (6) shows that the SM(Ψ) is the sum of the modellable degrees of the selected semantics.
For each attribute of tourist emotions, if a specific emotion of tourist experience is strongly associated with this attribute, it would appear concentratedly in a class of TLIs. In other words, the images have recognizable tourist emotions. Let Σmi=1(bi=r) be the number of TLIs belonging to emotional class r; Σi:bi=r(pij=d) be the total number of class r TLIs whose associated tourist labels have semantic d. Then, the conditional probability GA(d|r) for semantic d under emotional class r can be calculated by:
$G A(d \mid r)=\frac{\sum_{i b_{i}=r} \quad \left(p_{i j}=d\right)}{\sum_{i=1}^{m} \quad\left(b_{i}=r\right)}$ (7)
The prior probability GA(d) of semantic d can be obtained by the total probability formula. After the tourist-defined semantic space of the TLIs is divided by the known emotional classes, the distribution GA(d) of each semantic can be calculated by:
$G A(d)=\sum_{r} G A(d \mid r) G A(r)$ (8)
The conditional probability GA(d|r) and distribution GA(d) are thus obtained by formulas (7) and (8). Let GA(r) be the ratio of the number of TLIs belonging to class r according to the prior probability of emotional classes to the total number of TLIs; GA(d|r) be the ability of semantic d to differentiate emotion r. Based on the Bayes' theorem, the probability GA(d|r) of a TLI to fall into class r under the known semantic d can be calculated by:
$G A(d)=\frac{G A(d \mid r) G A(r)}{G A(d)}$ (9)
The final identifiability RQ(d) of tourist emotions in the TLI can be calculated by:
$R Q(d)=F(R \mid d)=-\sum_{r} G A(r \mid d) \log _{2} G A(r \mid d)$ (10)
Figure 4. Top-5 semantics by identifiability score
Superimposing RQ(d) values, the identifiability score RQ(Ψ) of tourist emotions in the set of emotional features can be obtained as:
$R Q(\Psi)=\sum_{d \in \Psi} R Q(d)$ (11)
The tourists may give repeated emotional labels. To prevent redundant attributes from these labels, this paper measures the features of the emotional feature set of each TLI by the mutual information calculation method. Figure 4 displays the top-5 semantics by the identifiability score.
As the statistical mean in a joint probability space, mutual information can measure the shared information of variables V and W, that is, the degree of reduction of a variable when the other variable remains constant. Let LG(v,s) be the joint probability distribution function of V and S; LG(v) and LG(s) be the marginal probability distribution functions of V and S, respectively. Then, the mutual information can be calculated by:
$TB(V;W)=\sum_{v \in V} \sum_{s \in S} L G(v, s) \log \left(\frac{L G(v, s)}{L G(v) L G(s)}\right)$ (12)
This paper measures the degree of correlation EO(D;Ψ) between the emotional feature set and the semantic space, based on the mutual information. Let di and dj be the i-th and j-th semantics of the semantic space and the selected emotional feature set, respectively. Then, EO(D;Ψ) can be calculated by:
$E O(D ; \Psi)=\sum_{d_{i} \in D} \sum_{d_{j} \in \Psi} L G\left(d_{i}, d_{j}\right) \log \left(\frac{L G\left(d_{i}, d_{j}\right)}{L G\left(d_{i}\right) L G\left(d_{j}\right)}+1\right)$ (13)
Each TLI has a limited number of emotional features. The emotional finiteness FS(Ψ) of an image can be characterized by the size |Ψ| of the emotional feature set:
$F S(\Psi)=\frac{1}{|\Psi|}$ (14)
To obtain the emotional feature subsets of each TLI, this paper constructs a semantic selection model based on the four emotional features obtained in the preceding section, namely, semantic modellable degree, tourist emotion identifiability, degree of semantic correlation, and emotional finiteness. The weights to balance the four emotional features are denoted by θ1, θ2, θ3, and 1-θ1-θ2-θ3, respectively. Then, the objective function of the model, i.e., the maximization of emotional features of the selected subset, can be established as:
$\max _{\Psi}\left\{\begin{array}{l}\theta_{1} O N(\Psi)+\theta_{2} R Q(\Psi) \\ +\theta_{3} E O(\Psi ; D)+\left(1-\theta_{1}-\theta_{2}-\theta_{3}\right) F S(\Psi)\end{array}\right\}$ (15)
Formula (15) shows that, with the growing size |Ψ| of the emotional feature set, the semantic modellable degree, tourist emotion identifiability, and degree of semantic correlation increase, while the emotional finiteness decreases. To simplify the emotional evaluation of TLIs, this paper sets |Ψ| to a constant n. Further, a constraint was introduced to the objective function (15) to update the model. Let G and gii=ON(di) be a diagonal matrix and its elements, respectively; E and eii=RQ(di) be the other diagonal matrix and its elements, respectively; T and tij=EO(di,dj) be a symmetric matrix and its elements, respectively. Suppose vector o, which satisfies oi∈{1,0}, represents whether semantic di is selected as an emotional feature and entered to Ψ. The final optimization problem can be expressed as:
$\max _{o} \sum_{i=1}^{w} o_{i}^{2}\left(\theta_{1} g_{i i}+\theta_{2} e_{i i}\right)$
$+\left(1-\theta_{1}-\theta_{2}\right) \sum_{i, j}\left\|o_{i}-o_{j}\right\|^{2} g_{i j}$
s.t. $o_{i} \in\{1,0\}, \sum_{i}^{w} o_{i}=n$ (16)
The quadratic programming problem of the TLI emotion evaluation problem can be generally expressed as:
$\min _{o} \frac{1}{2} o^{T} X o-o^{T} y$, s.t. $Y_{1} a=d, Y_{2} a \leq \varphi$ (17)
Let $X \in R^{m \times m}$ denote a symmetric matrix satisfying Y1 $\in$Rn×n, d $\in$ Rn, Y2 $\in$ Rt×m, φ $\in$ Rt, y $\in$ Rm, and X=-{θ1V+θ2Q+(1-θ1-θ2)(ψU-U)}; ψU denote a diagonal matrix; φGii=Σwj=1gij. Then, oi is set as a random real number in [0, 1]. Then, the TLI emotion evaluation problem can be converted into a quadratic linear programming optimization problem with an inequality constraint:
$\min _{o} o^{T} X o$, s.t. $0 \leq o \leq 1,1^{T} o=n$ (18)
The vector o can be obtained by solving formula (18). Then, the top-n concepts can be selected to generate the needed subset of emotional features.
Firstly, the authors compared the accuracies of different image emotional analysis methods, including the method based on artificial features, the method based on middle-layer semantic attributes, the method based on object class response, the method based on scene class response, library support vector machine (LibSVM), and our method. The results in Table 1 show that our method, which solves the TLI emotional feature set, has a clear advantage over the other method, because it makes up for the shortcomings of middle-layer semantic set. The advantage was the most prominent on image sets 2 and 3: the accuracy of our method was more than 8.5% higher than that of the method based on middle-layer semantic attributes. Hence, our method is suitable for classifying the positive and negative emotions in TLIs.
Figure 5. Effectiveness of emotional feature sets
Table 1. Accuracies of image emotional analysis methods
|
Method |
Method 1 |
Method 2 |
Method 3 |
Method 4 |
Method 5 |
Our method |
|
Image set 1 |
46.27 |
51.06 |
49.24 |
53.09 |
54.26 |
64.11 |
|
Image set 2 |
66.05 |
70.91 |
69.47 |
73.62 |
74.18 |
77.49 |
|
Image set 3 |
65.38 |
68.29 |
65.41 |
77.58 |
71.62 |
78.58 |
|
Image set 4 |
34.61 |
42.73 |
36.95 |
45.74 |
42.68 |
50.26 |
|
Image set 5 |
66.18 |
70.95 |
70.62 |
78.93 |
78.61 |
79.13 |
Table 2. Predicted emotional labels
|
Method |
Method 1 |
Method 2 |
Method 3 |
Method 4 |
Method 5 |
Our method |
|
|
Image set 1 (with emotional labels) |
Dimensional prediction |
0.658 |
0.617 |
0.642 |
0.629 |
0.694 |
0.718 |
|
Mean prediction |
0.562 |
0.553 |
0.608 |
0.615 |
0.607 |
0.682 |
|
|
F1-score |
0.283 |
0.295 |
0.264 |
0.249 |
0.283 |
0.395 |
|
|
Image set 2 (with emotional labels) |
Dimensional prediction |
0.752 |
0.647 |
0.713 |
0.736 |
0.738 |
0.793 |
|
Mean prediction |
0.517 |
0.536 |
0.592 |
0.648 |
0.616 |
0.685 |
|
|
F1-score |
0.162 |
0.185 |
0.197 |
0.164 |
0.208 |
0.253 |
|
Next, a comparative experiment was carried out on emotional feature sets, aiming to verify whether the proposed emotional feature selection strategy could improve the performance of TLI emotional analysis. The TLI emotional analysis effect was observed on emotional feature sets of different sizes. According to the results in Figure 5, the TLI emotions were better analyzed on the middle-layer semantic attributes, using the constructed emotional feature set, than using the random emotional feature set. The main reason is that the emotional labels of tourist experience contain many labels unrelated to visual contents, which may hinder TLI emotional classification.
In addition, 15,621 TLIs were randomly selected from six image sets. All these images are mainly about tourism landscapes. Their emotions were labeled based on tourist experience. Figure 6 compares the TLI emotional labels with the original emotional labels. The x-axis is the score of TLI emotions against a nine-point scale, and the y-axis is the original valuation results and the evaluation results on TLIs in classes A-C. The comparison shows that the evaluated results obtained through the experiences were only slightly different from the original labels. Thus, it is scientific to label the TLI emotions based on tourist experience.
Figure 6. TLI emotional labels vs. original emotional labels
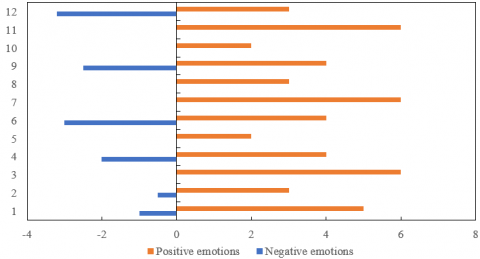
Figure 7. Evaluation results on the positive and negative emotions in TLIs
Figure 7 presents the evaluation results on the positive and negative emotions in TLIs. It can be seen that the results on the TLIs with positive emotions were all greater than 2; the results on the TLIs with negative emotions were basically smaller than -1; the results on the TLIs with neutral emotions fell between 2 and -1. By combining TLI emotional preferences and tourist experience satisfaction, it is possible to divided the TLIs into positive, negative, and neutral intervals. The experimental results agree with the general definition of TLI emotional tendencies. The evaluation of positive and negative emotions in TLIs provides an important reference for labeling image emotional semantics.
Finally, this paper compares the emotional labels of TLIs predicted by our method with those forecasted by five different methods: the predicted label matrix-based method, the noise matrix-based method, the user label matrix-based method, the low-rank matrix approximation framework-based method, and the weakly supervised depth matrix-based method. The results in Table 2 show that our method achieved the best prediction results: the TLI emotional labels were predicted accurately by utilizing the multiple information on tourist experience, and learning the deep visual features of TLIs.
This paper carries out emotional analysis and annotation of TLIs based on tourist experience Firstly, the authors explained the flow of tourist experience evaluation, and built a model to evaluate tourist experience. Next, the feature-based semantic information forms were defined for TLIs, and the emotional features were calculated for such images. On this basis, a semantic selection model was established to generate the emotional feature subsets of TLIs. Through experiments, the authors compared the accuracies of multiple TLI emotional analysis methods, and confirmed that our method is relatively suitable for evaluating the emotions of TLI sets, which involves both positive and negative emotions. Besides, the comparative experiment on emotional feature sets reveals that our emotional feature selection strategy improves the effectiveness of TLI emotional analysis. In addition, the TLI emotional labels were compared with the original labels, and the emotional labels predicted by different methods were compared. The results demonstrate that, it is scientific to label TLI emotions based on tourist experience.
2021 Philosophy and Social Science planning project of Henan Province, Research on the strategy of screening, protection and Utilization of rural red cultural resources in Central Plains, Grant No.: 2021BYS051; 2021 Philosophy and Social Science project of Henan Province, Research on the protection of traditional Village landscape features in Henan province, Grant No.: 2021BYS048; Research on color identification system and planning path of traditional villages in central China under the background of rural revitalization strategy, Special Application for Key Research and Development and Promotion of Henan Province, Grant No.: 212400410381; Research on Strategies for Memory Protection and Inheritance of Industrial and Trade Traditional Villages in Henan from the Perspective of Village Culture, Humanities and Social Science Project of Henan Education Department, Grant No.: 2021-ZZJH-453; Research on Spatial Satisfaction Evaluation and Renewal Protection Strategy for Inheritance of Traditional Village Context in Southern Henan province, Humanities and Social Science Project of Henan Education Department, Grant No.: 2021-ZDJH-0422; Research on promoting the characteristic development of Henan cultural industry with social innovation, Subject of Henan social science planning, Grant No.: 2018BYS022.
[1] Kuo, C.L., Lin, C.L. (2016). The analysis of cognitive image and tourism experience in Taiwan’s old streets based on a hybrid MCDM approach. Fuzzy Systems and Data Mining II, 293: 476-486. https://doi.org/10.3233/978-1-61499-722-1-476
[2] Pliakos, K., Kotropoulos, C. (2015). Building an image annotation and tourism recommender system. International Journal on Artificial Intelligence Tools, 24(5): 1540021. https://doi.org/10.1142/S0218213015400217
[3] Yang, Q., Sheng, K. (2018). A study for the protection and utilization of the Huzhou new rural tourism landscape resources based on a Rural Residence Image System (RRIS). Lowland Technology International, 20(1): 37-46. https://cot.unhas.ac.id/journals/index.php/ialt_lti/article/view/184.
[4] Chantrapornchai, C., Bunlaw, N., Choksuchat, C. (2018). Semantic image search: case study for western region tourism in Thailand. Journal of Information Processing Systems, 14(5): 1195-1214. https://doi.org/10.3745/JIPS.04.0088
[5] Saito, N., Ogawa, T., Asamizu, S., Haseyama, M. (2018). Tourism category classification on image sharing services through estimation of existence of reliable results. In Proceedings of the 2018 ACM on International Conference on Multimedia Retrieval, pp. 493-496. https://doi.org/10.1145/3206025.3206085
[6] Hou, X.Q., Wang, C.S., Xiao, W.W. (2017). Data mining technology for tourism image creation. Agro Food Industry Hi-Tech, 28(1): 2027-2030.
[7] Kharkongor, W.B., Paul, A., Bora, S., Chakrabarti, D. (2017). Meghalaya tourism: inculcating cultural image in developing enroute mini halts. In International Conference on Research into Design, pp. 255-265. https://doi.org/10.1007/978-981-10-3521-0_22
[8] Kim, S.E., Lee, K.Y., Shin, S.I., Yang, S.B. (2017). Effects of tourism information quality in social media on destination image formation: The case of Sina Weibo. Information & Management, 54(6): 687-702. https://doi.org/10.1016/j.im.2017.02.009
[9] Li, S., Sasaki, J. (2019). A study on the tourism features extraction from photos in a tourism website by image analysis. In 2019 IEEE 10th International Conference on Awareness Science and Technology (iCAST), pp. 1-5. https://doi.org/10.1109/ICAwST.2019.8923581
[10] Lei, H., Liu, J., Zhang, L. (2019). Tourism image endorsement based on experiment and variance analysis. In IOP Conference Series: Earth and Environmental Science, 371(5): 052001. https://doi.org/10.1088/1755-1315/371/5/052001
[11] Latorre-Martínez, M.P., Iñíguez-Berrozpe, T., Plumed-Lasarte, M. (2014). Image-focused social media for a market analysis of tourism consumption. International Journal of Technology Management, 64(1): 17-30.
[12] Fan, G., Chen, C., Zhang, Y. (2013). Remote sensing image in the application of agricultural tourism planning. Sensors & Transducers, 153(6): 161-165. https://www.proquest.com/openview/a8da6eb8554aea4299089c6389b72b14/1?pq-origsite=gscholar&cbl=52938.
[13] Liang, R., Luo, S. (2019). Research on image perception of Guilin tourism destination based on network text analysis. In E3S Web of Conferences, 118(03019): 1-4. https://doi.org/10.1051/e3sconf/201911803019
[14] Xie, X.X. (2015). Tourism image orientation and marketing promotion strategy for resource-based cities. ISME-2015, SCITEPRESS, pp. 210-213. https://doi.org/10.5220/0006022402100213
[15] Fukada, H., Kasai, K., Ohtsu, S. (2015). A field experiment of system to provide tourism information using image recognition type AR technology. In New Trends in Networking, Computing, E-learning, Systems Sciences, and Engineering, pp. 381-387. https://doi.org/10.1007/978-3-319-06764-3_47
[16] Wu, L.H., Jiang, W.J., Cao, J. (2014). Research of image watermarking algorithm and application in eco-tourism digital museums copyrights protection. In Ecosystem Assessment and Fuzzy Systems Management, pp. 243-255. https://doi.org/10.1007/978-3-319-03449-2_23
[17] Ye, X.Q. (2014). Analysis of the tourism image orientation about the interaction between the release of tourism destination information and tourists perception. In Applied Mechanics and Materials, 644: 6043-6046. https://doi.org/10.4028/www.scientific.net/AMM.644-650.6043
[18] Zhang, X. (2018). The deconstruction and reconstruction of tourism image of an ancient town: ---Using the ancient town of Songkou as a case study. In Proceedings of the 2018 International Conference on Computers in Management and Business, pp. 28-32. https://doi.org/10.1145/3232174.3232189
[19] Zhuang, Y., Chiu, D.K., Jiang, G., Hu, H., Jiang, N. (2013). Effective location-based geo-tagged image retrieval for mobile culture and tourism education. In International Conference on Web-Based Learning, pp. 152-161. https://doi.org/10.1007/978-3-642-41175-5_16
[20] Yoshihara, T., Nishina, D., Tanaka, T., Kawase, K., Takagishi, H. (2017). A study on the psychological evaluation of tourism landscape images in Hiroshima a psychological evaluation by Korean subjects. Journal of Asian Architecture and Building Engineering, 16(1): 223-229. https://doi.org/10.3130/jaabe.16.223
[21] Kota, K., Daisaku, N., Wei, L., Hua, J., Takahiro, T., Toshiro, Y. (2015). A study on the psychological evaluation of tourism landscape images in Hiroshima. Journal of Environmental Engineering (Japan), 80(708): 99-108.
[22] Jin, B., Lin, B., Yan, Y., Pan, H. (2021). Research on tourism image perception of Fuzhou Jinjishan Park from the perspective of big data. In 2021 4th International Conference on Information Systems and Computer Aided Education, pp. 438-443. https://doi.org/10.1145/3482632.3482725
[23] Chiu, C.C., Wei, W.J., Lee, L.C., Lu, J.C. (2021). Augmented reality system for tourism using image-based recognition. Microsystem Technologies, 27(4): 1811-1826. https://doi.org/10.1007/s00542-019-04600-2