Manikanta Prahlad Manda | Daijoon Hyun*
© 2021 IIETA. This article is published by IIETA and is licensed under the CC BY 4.0 license (http://creativecommons.org/licenses/by/4.0/).
OPEN ACCESS
Traditional thresholding methods are often used for image segmentation of real images. However, due to distinct characteristics of infrared thermal images, it is difficult to ensure an optimal image segmentation using the traditional thresholding algorithms, and therefore, sometimes this can lead to over-segmentation, missing object information, and/or spurious responses in the output. To overcome these issues, we propose a new thresholding technique that makes use of the sine entropy-based criterion. Moreover, we build a double thresholding technique that makes use of two thresholds to get the final image thresholding result. Besides, we introduce the sine entropy concept as a supplement of the Shannon entropy in creating threshold-dependent criterion derived from the grayscale histogram. We found that the sine entropy is more robust in interpreting the strength of the long-range correlation in the gray levels compared to the Shannon entropy. We have experimented with our method on several infrared thermal images collected from standard image databases to describe the performance. On comparing with the state-of-art methods, the qualitative results from the experiments show that the proposed method achieves the best performance with an average sensitivity of 0.98 and an average misclassification error of 0.01, and second-best performance with an average sensitivity of 0.99 and an average specificity of 0.93.
image segmentation, thermal images, long-range correlations, sine entropy, double thresholding
Image thresholding is the simplest method of image segmentation. For a grayscale thermal image, image thresholding separates objects from the background using a threshold value in such a way that a pixel is determined to be an object if its intensity is greater than the threshold value, and background otherwise. This method is very fast due to its simplicity, so it is mainly used for security systems [1], where a large number of images should be processed in real-time.
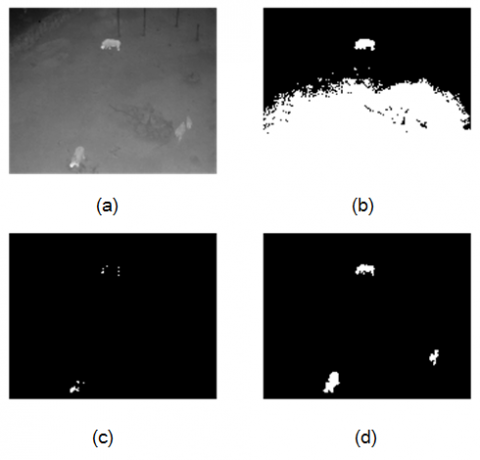
Consider a grayscale thermal image in Figure 1(a), where three animals are target objects. The figure has a small difference in contrast between object and background. So, it is not easy to choose a threshold that accurately separates the pixels into two classes. One recent method [2] selects a threshold that incorrectly recognizes most areas as the white object (see Figure 1(b)). In another recent approach [3], target animals are erroneously perceived as black background (see Figure 1(c)). Even several other approaches in our experiments do not clearly distinguish the objects in this image. Figure 1(d) shows the resulting binary image using two thresholds which are determined by sine entropy; this correctly detects the three objects.
In this paper, we propose an image thresholding method that employs two threshold values, called double thresholding, where each threshold is determined by using sine entropy; to our knowledge, the sine entropy is used for image thresholding for the first time in this paper. For a given image and its grayscale histogram, let a low threshold tL and high threshold tH be selected, in which tL maximizes total sine entropy for the intensity from 0 to 255 (assuming 8-bit image) and tH maximizes it from (tL+1) to 255. The pixels of the image are classified into objects and background musing those thresholds. The pixels with intensity greater than tH are set as objects, while those with intensity less than tL are classified as background. The pixels with intensity between the two thresholds are classified with reference to neighboring pixels.
Figure 1. Motivational example: (a) input grayscale image, (b)-(c) the binary images of recent methods [2, 3], and (d) the binary image of the proposed method
This method provides better separation by taking into account continuity with surrounding pixels. The rest of the paper is organized as follows. In section II, the previous works for image thresholding and the basic concept of sine entropy are briefly reviewed. Section III proposes a double thresholding method using sine entropy. The experimental results are shown in Section IV, where the effectiveness of the proposed method is evaluated in terms of accuracy and runtime. Conclusions are drawn in Section V.
2.1 Previous works
There are two popular image thresholding methods for general images. The first method selects a threshold value that maximizes the inter-variance between object and background [4], while the second determines a threshold that maximizes the total Shannon entropy of two classes [5]. They often fail to segmentize the object from the background in thermal images when two classes have a small difference in contrast or one class has a long-range correlation. In addition to them, various thresholding methods have been proposed to improve the segmentation accuracy for thermal images. One study iteratively searches threshold values around the previous best solutions, where Shannon entropy is used to evaluate the thresholds [6]. The other method uses optical imaging principles to identify the object area and filter out some background pixels. Conventional image thresholding is then applied to the rest of the histogram [7]. Shannon entropy and Tsallis entropy are measured in background class and object class, respectively, and the smaller one is selected at each intensity [8]; this is to improve the accuracy even in long-range correlation. Calculates hyper entropies of object and background to measure the uncertainty of entropy and selects the larger one for each intensity [2]. The intensity with the largest entropy value is finally selected as a threshold [2, 8]. Another study performs the image thresholding using Shannon entropy, and the seed points are selected for the subsequent step of region growing, which changes the pixels in the background into object according to the neighboring pixels [3].
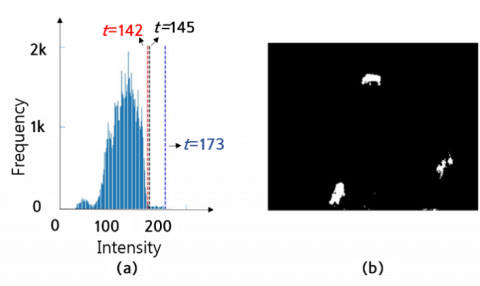
Figure 2. (a) Grayscale histogram of Figure 1 (a) and (b) corresponding thresholding result of the sine entropy
2.2 Sine entropy
The Shannon entropy uses a logarithmic function, which requires predefining the log(0) value as 0 to avoid the runtime errors when it is used to measure the information associated with the zero grayscale frequencies during the image thresholding [9]. Using the sine entropy as an alternative for the Shannon entropy is another solution to overcome this limitation [10]. In addition, the Shannon entropy for thresholding often suffered from misinterpreting the long-range correlations in the gray level intensities for the infrared thermal images with irregular histogram characteristics [11]. Consider the gray level histogram in Figure 2 (a) of the image shown in Figure 1 (a). The grayscale intensity at 145 is the threshold representing the ground truth image. There exist highly concentrated gray levels of the object region between intensities from 145 to 173 illustrating the long-range correlation. The Shannon entropy produces a threshold at 173, which completely misinterpreted the long-range correlations in the object region. However, the sine entropy produces a threshold at 142, which correctly interpreted the long-range correlation and therefore yields a more accurate segmentation than the Shannon entropy as shown in Figure 2 (b). In these two respects, sine entropy has the advantage over Shannon entropy.
We thus propose using sine entropy for image thresholding. The sine entropy S for a discrete probability distribution P is defined as:
$S=\sum_{i=1}^{k} \sin \left(\pi p_{i}\right)$ (1)
where, pi is the possibility of i- state in P; the state indicates a level of intensity in image thresholding.
To improve the accuracy of image thresholding, we propose a double thresholding method that uses two threshold values, in which each threshold value is obtained by maximizing the total sine entropy between the two classes. Among the two thresholds, one threshold (low threshold) is used to mark the pixels that are weakly associated with the object region and the second threshold (high threshold) is used to mark the pixels that are strongly associated with the object region. Finally, image segmentation is achieved with the help of the double thresholding method. Image segmentation using the double thresholding method is described in section 3.1 and threshold selection using the sine entropy is described in section 3.2.
3.1 Double thresholding method
Double thresholding aims to suppress the spurious responses caused using a single threshold for image segmentation. The method scans all pixels in the range [low threshold, high threshold] to suppress the spurious responses. A given thermal image is transferred to a grayscale image and its corresponding histogram, where the number of pixels with each intensity is counted and represented in y-axis of the histogram. We iteratively set a threshold value to each intensity from 0 to the upper limit of intensity, 255 in this example, and find the best threshold which corresponds to the maximum total sine entropy (see Section 3.2); it is set to a low threshold tL. Next, we visit the histogram from (tL+1) to 255 and find the best threshold value with the maximum total sine entropy again; the result is set to a high threshold tH. We divide the pixels of the image into the object and the background using those two thresholds; the pixels with intensity greater than tH are set to the object, and those less than tL are set to the background; the remaining pixels with the intensity between tL and tH are classified by considering the classes of adjacent pixels. If there is at least one object in four adjacent pixels, the pixel is set to object; background otherwise. Finally, we obtain a binary image, in which white objects are clearly distinguished from the black background.
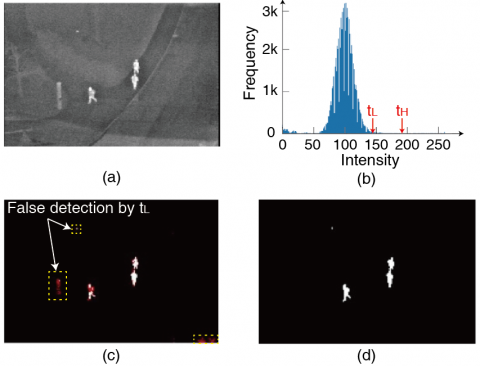
Figure 3. (a) An example of a grayscale image, (b) its corresponding histogram, (c) binary image using the low threshold, and (d) the final binary image of the proposed method
In Figure 3(a), the objects are three people with relatively high temperatures. In the corresponding histogram of Figure 3(b), tL and tH are calculated as 147 and 192. The pixels with an intensity greater than 192 are set to the object, and those less than 147 are set to the background. In Figure 3(c), the object and the background are represented in white and black colors, respectively, while the remaining pixels are colored in red. The dotted boxes indicate false objects which are determined by tL; after checking the classes of the surrounding pixels, they are identified as background. The final binary image is shown in Figure 3(d).
3.2 Threshold selection using sine entropy
Consider an image with N pixels and its grayscale histogram. Let G={g0, g1, g2, ..., gL-1} be a discrete random variable representing the histogram. The corresponding probability distribution of G is given by:
$p_{i}=\left\{\frac{g_{i}}{N} \mid 0 \leq i \leq L-1\right\}$ (2)
where, L is the number of intensities; e.g., 256 for an 8-bit image. We visit each intensity as a candidate of threshold t, where the pixels corresponding to the intensity less than t are set to the background and the remaining pixels are set as the object. The total sine entropy is calculated by adding sine entropies of the background and the object as shown in Eq. (3):
$S(t)=\sum_{i=0}^{t-1} \sin \left(\pi\left(\frac{p_{i}}{P_{1}}\right)\right)+\sum_{i=t}^{L-1} \sin \left(\pi\left(\frac{p_{i}}{P_{2}}\right)\right)$ (3)
where, P1 and P2 are given by $P_{1}=\sum_{i=0}^{t-1} p_{i}$ and $P_{2}=\sum_{i=t}^{L-1} p_{i}$.
This is repeated for the target range of intensity values, and the intensity with the maximum total sine entropy is selected as a threshold, as shown in Eq. (4):
$t=\operatorname{argmax}\{S(t)\}$ (4)
Experiments are carried out on a set of images from LTIR dataset [12], piglet thermal image database [13] as well as OSU thermal pedestrian database [14]. The LTIR database contains sequences of different environments that include natural as well as man-made background, indoors as well as outdoors. This database contains images with various natures of the objects such as camouflage objects, moving objects, shadows, reflections, and so on, which gives an opportunity to discuss the challenges in thermal image segmentation. The Piglet Thermal image database contains sequences that were recorded at natural light conditions. There is a high contrast between the background and object regions, however, the high peak ratio of pixels’ frequency between the background and object regions is a key challenge to consider when this database is used to test a thermal image segmentation method. The OSU Thermal Pedestrian database contains sequences of natural background that were recorded at different weather conditions. Few challenging events such as small pedestrian regions, false objects, pedestrians appearing in different poses, etc. may arise when image thresholding is applied to extract object information. The images in this database are characterized by low resolution. The algorithm of the proposed method is implemented in Python, and the ground truth images are generated manually and used as references.
Each image is transformed to grayscale and the proposed method is applied to the image to segmentize the object from the background; the result is obtained as a binary image, where white pixels represent the object and the black pixels represent the background. A graphical flow of the proposed image segmentation method is illustrated in Figure 4.
Figure 4. Graphical flow of the proposed image segmentation (a) Grayscale image (b) Selecting tL and tH from the histogram (c) Pixels labeled tL (d) Pixels labeled by tH (e) final segmentation result using the double thresholding method
4.1 Analysis on image thresholding results
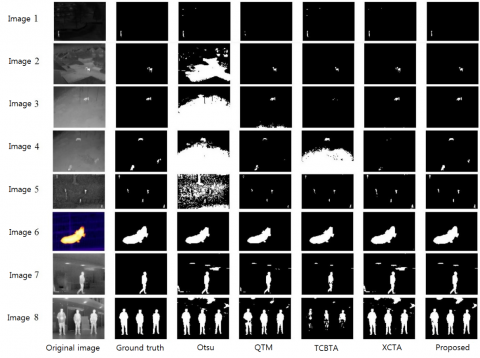
Figure 5 compares the resulting binary images of the proposed method to four image thresholding methods, such as Otsu [4], QTM [8], TCBTA [2], and XCTA [3], where 8 sample images are used for the analysis. The original images and their ground truths for the samples are shown in columns 1-2, respectively, and the results of image thresholding methods are shown in columns 3-7. Small object detection or tracking is one of the important applications of infrared thermal imaging. As shown in Figure 5, images 1-5 represent different situations in which thermal imaging is used to detect and track small targets.
Figure 5. The comparison of resulting binary images for four existing thresholding methods (Otsu, QTM, TCBTA, and XCTA) and the proposed method
For image 1, the background is homogeneous and uniform, and also the object appears warmer than that of the background. With this regard, extracting object information is relatively simple for image 1 and almost all methods have produced closer results to the ground truth image except the QTM method. The QTM method strongly focuses on local long-range correlations so that it misjudges the pixels that exhibit global long-range correlations in the object region. We can observe how the traditional image thresholding methods failed to give satisfactory results for infrared thermal image thresholding especially for small targets with complex background and this fact is depicted through the results of the Otsu method for images 2 and 3. The reason for this failure is that the presence of a valley point between the two highest peaks lies in the background grayscale distribution. However, except for a portion of the object information lost by the TCBTA method, all other methods are successful in extracting the object information. The Otsu method has delivered the worst performance among the results of all methods. This is because some parts of the background have similar grayscale intensity as the object. In image 4, one object among the three and a portion of pixels in the other two objects have approximately the same grayscale intensities as the background. TCBTA method has extracted correctly one object information that has better contrast with the background however this method fails to separate the other two objects that have low contrast with the background; QTM method correctly extracted two objects' information that possesses strong local long-range correlations however this method has missed out on the information of the dim object which posses global long-range correlations; Wrong judgment of seed threshold selection by XCTA method leads to complete failure in extracting all three objects' information; the proposed global long-range correlations in the object region. We can observe how the traditional image thresholding methods failed to give satisfactory results for infrared thermal image thresholding especially for small targets with complex background and this fact is depicted through the results of the Otsu method for images 2 and 3. The reason for this failure is that the presence of a valley point between the two highest peaks lies in the background grayscale distribution. However, except for a portion of the object information lost by the TCBTA method, all other methods are successful in extracting the object information. The Otsu method has delivered the worst performance among the results of all methods. This is because some parts of the background have similar grayscale intensity as the object. In image 4, one object among the three and a portion of pixels in the other two objects have approximately the same grayscale intensities as the background. TCBTA method has extracted correctly one object information that has better contrast with the background however this method fails to separate the other two objects that have low contrast with the background; QTM method correctly extracted two objects' information that possesses strong local long-range correlations however this method has missed out on the information of the dim object which posses global long-range correlations; Wrong judgment of seed threshold selection by XCTA method leads to complete failure in extracting all three objects' information; the proposed method detected all the pixels in the local region of the dim object using the low threshold and all the pixels in the brighter object region using the high threshold and finally by utilizing hysteresis thresholding to discard false object region pixels detected by the low threshold, it has successfully provided an accurate image thresholding result. For image 5, there exist two false objects; a pole and a tree. The pole has approximately the same grayscale intensities as the objects and the tree has approximately the same grayscale intensities as the background. As the QTM method and the TCBTA focuses mainly on local grayscale properties, both methods extracted the object information efficiently. Since the XCTA method identified a few pixels in the pole region as seed points, the pole has appeared as the object in the result. Our method has successfully eliminated the brighter non-object region (a pole) using the high threshold and provided better thresholding results compared to the other methods.
We can observe high contrast between the object and background regions in image 6 and it gives a bimodal behavior in the histogram. The Ostu works well for the images with bimodal nature in the histogram and it is depicted in the segmentation result. Also, all remaining methods including the proposed method were produced satisfactory results for image 6. There is a clear contrast between the object(s) and background regions for image 7 and image 8. However, due to reflections, some background objects in image 7 and image 8 have similar grayscale intensities as the object(s). Thresholding results for the Otsu method, the XCTA method, and the TCBTA method depicts the difficulties that arise with using one threshold for image segmentation. Missing object information is one issue that we can see in the result of the TCBTA method for image 8 and appearing more false objects in the result is another issue that can be observed in the results of the Otsu method and the QTM method for image 7 and image 8. Selecting the pixels in the object regions as seed thresholds allows the XCTA method to extract the object information completely, at the same time selecting some pixels in the background region (pixels affected by the reflections) as seed thresholds lead to more severe issues. When compared to all other methods, the XCTA has more false objects in the result for image 7 and image 8. The connectivity check between the two thresholds in the proposed method helps in minimizing the appearance of the false object pixels and produced a more satisfied result compared to all other methods.
4.2 Effectiveness of the proposed method
The effectiveness of the proposed is analyzed in more detail in the form of evaluation metrics. For that, the sensitivity, selectivity, precision [15], and misclassification error (MCE) [16] are calculated between the binary image segmentation result and the ground truth image. The sensitivity value indicates the fraction of object region pixels that are correctly identified. The selectivity value indicates the fraction of background region pixels that are correctly identified. The precision value indicates the proportion of the genuine object region pixels that are relevant. Misclassification determines the fraction of pixels that are wrongly classified. The value of MCE lies between 0 and 1. An MCE value very close to 0 indicates better image thresholding quality. The mathematical expression of the various quantitative metrics is expressed as:
Sensitivity $=\frac{\left|G T_{O} \,\, \cap \,\, S_{O}\right|}{\left|G T_{O}\right|}$ (5)
Specifficity $=\frac{\left|G T_{B} \,\, \cap \,\, S_{B}\right|}{\left|G T_{B}\right|}$ (6)
Precision $=\frac{\left|G T_{O} \,\, \cap \,\, S_{O}\right|}{\left|S_{O}\right|}$ (7)
$M C E=1-\frac{\left|G T_{O} \,\, \cap \,\, S_{O}\right|+\left|G T_{B} \,\, \cap \,\, S_{B}\right|}{\left|G T_{O}\right|+\left|G T_{B}\right|}$ (8)
where, GTO denotes the set of object pixels and GTB denotes the set of the background pixels of the ground truth image, and SO denotes the set of the object pixels and SB denotes the set of background pixels of the image thresholding result.
The quantitative performances of various thresholding methods are evaluated on an image set of 100 images collected from the three databases and the average values obtained for different quantitative metrics of the various methods are listed in Table 1-3. According to Table 1, the Otsu method ranks first in terms of sensitivity however this method ranks last for other metrics due to wrong judgment in the classification of most of the background region pixels. The QTM method ranks first in terms of specificity, however, missing object region information in the thresholding results leads to unsatisfactory classification errors of object region pixels and fewer false performance in terms of other metrics. Due to fewer responses in the thresholding results, the proposed method has produced satisfactory performance in terms of all metrics. The proposed method ranks first in terms of precision and MCE.
Table 1. Comparison of average quantitative metric values of various methods for image set collected from LTIR database
|
|
Sensitivity |
Specificity |
Precision |
MCE |
|
Otsu |
1.00 |
0.72 |
0.34 |
0.27 |
|
QTM |
0.70 |
0.99 |
0.84 |
0.02 |
|
TCBTA |
0.70 |
0.91 |
0.78 |
0.10 |
|
XCTA |
0.85 |
0.98 |
0.79 |
0.01 |
|
Proposed |
0.96 |
0.99 |
0.91 |
0.01 |
Table 2. Comparison of average quantitative metric values of various methods for image set collected from Piglet thermal image database
|
|
Sensitivity |
Specificity |
Precision |
MCE |
|
Otsu |
0.89 |
0.99 |
0.99 |
0.02 |
|
QTM |
0.73 |
1.00 |
1.00 |
0.03 |
|
TCBTA |
0.92 |
0.99 |
0.99 |
0.01 |
|
XCTA |
1.00 |
0.98 |
0.91 |
0.02 |
|
Proposed |
0.99 |
0.99 |
0.95 |
0.01 |
Table 3. Comparison of average quantitative metric values of various methods for image set collected from OSU Thermal Pedestrian database
|
|
Sensitivity |
Specificity |
Precision |
MCE |
|
Otsu |
1.00 |
0.63 |
0.01 |
0.36 |
|
QTM |
0.83 |
1.00 |
1.00 |
0.01 |
|
TCBTA |
1.00 |
0.99 |
0.94 |
0.01 |
|
XCTA |
1.00 |
0.99 |
0.56 |
0.02 |
|
Proposed |
1.00 |
0.99 |
0.92 |
0.01 |
Due to bimodal histogram characteristics exhibited by the images in the piglet database, all methods produced satisfactory performances in terms of all metrics, and the obtained metrics are shown in Table 2. According to Table 3, the high sensitivity value achieved by all the methods except the QTM method indicates the existence of a few pixels that are wrongly identified as object regions. The high selectivity value achieved by the QTM method indicates the existence of a few pixels that are wrongly identified as background region pixels. A precision value of 1 achieved by the QTM method indicates that all classified object region pixels are indeed classified as genuine object region pixels. Due to fewer errors in the overall classification of pixels, the TCBTA method ranks first followed by the proposed method.
The average runtimes of the five methods are listed in Table 4. The proposed method takes 2.4 ms to segment an image; specifically, 1.4 ms for finding the first threshold tL, 0.6 ms for finding the second threshold tH, and 0.4 ms for connectivity operation. It is more than the runtimes of the other methods. However, because the image thresholding method is so fast, a certain amount of runtime increase is tolerable.
Table 4. Runtime comparison of five image thresholding methods
|
Method |
Otsu |
QTM |
TCBTA |
XCTA |
Proposed |
|
Avg. Runtime (ms) |
2.0 |
1.7 |
1.9 |
2.2 |
2.4 |
In this paper, a new sine entropy-based double thresholding method is introduced for thermal images. Compared to the other methods, our method can better handle the issues that normally occur when extracting the small object information. Consequently, the proposed method has outstanding performance in terms of sensitivity, specificity, precision, and misclassification error. Although we obtained satisfactory results, a few false objects appear in the thresholding results for certain infrared thermal images is a remarkable limitation that we need to be considered in future studies.
[1] Kerbaa, T.H., Mezache, A., Oudira, H. (2020). Parameter Estimation in radar K-clutter plus noise based on Otsu's algorithm. Ingénierie des Systèmes d’Information, 25(3): 295-302. https://doi.org/10.18280/isi.250302
[2] Wu, T., Hou, R., Chen, Y. (2016). Cloud model-based method for infrared image thresholding. Mathematical Problems in Engineering, 2016: 1571795. https://doi.org/10.1155/2016/1571795
[3] Yu, X., Zhou, Z., Gao, Q., Li, D., Ríha, K. (2018). Infrared image segmentation using growing immune field and clone threshold. Infrared Physics & Technology, 88: 184-193. https://doi.org/10.1016/j.infrared.2017.11.029
[4] Otsu, N. (1979). A threshold selection method from gray-level histograms. IEEE Transactions on Systems, Man, and Cybernetics, 9(1): 62-66. https://doi.org/10.1109/TSMC.1979.4310076
[5] Pun, T. (1980). A new method for grey-level picture thresholding using the entropy of the histogram. Signal Processing, 2(3): 223-237. https://doi.org/10.1016/0165-1684(80)90020-1
[6] Azarbad, M., Ebrahimzade, A., Izadian, V. (2011). Segmentation of infrared images and objectives detection using maximum entropy method based on the bee algorithm. International Journal of Computer Information Systems and Industrial Management Applications, 3: 26-33.
[7] Zhou, Y., Gao, M., Fang, D., Zhang, B. (2016). Tank segmentation of infrared images with complex background for the homing anti-tank missile. Infrared Physics & Technology, 77: 258-266. https://doi.org/10.1016/j.infrared.2016.06.008
[8] Lin, Q., Ou, C. (2012). Tsallis entropy and the long-range correlation in image thresholding. Signal Processing, 92(12): 2931-2939. https://doi.org/10.1016/j.sigpro.2012.05.025
[9] Wong, A.K., Sahoo, P.K. (1989). A gray-level threshold selection method based on maximum entropy principle. IEEE Transactions on Systems, Man, and Cybernetics, 19(4): 866-871. https://doi.org/10.1109/21.35351
[10] Yao, K. (2014). Sine entropy of uncertain set and its applications. Applied Soft Computing, 22: 432-442. https://doi.org/10.1016/j.asoc.2014.04.023
[11] De Albuquerque, M.P., Esquef, I.A., Mello, A.G. (2004). Image thresholding using Tsallis entropy. Pattern Recognition Letters, 25(9): 1059-1065. https://doi.org/10.1016/j.patrec.2004.03.003
[12] Berg, A., Ahlberg, J., Felsberg, M. (2015). A thermal object tracking benchmark. In 2015 12th IEEE International Conference on Advanced Video and Signal Based Surveillance (AVSS), Karlsruhe, Germany, pp. 1-6. https://doi.org/10.1109/AVSS.2015.7301772
[13] Lu, M., He, J., Chen, C., Okinda, C., Shen, M., Liu, L., Yao, W., Norton, T., Berckmans, D. (2018). An automatic ear base temperature extraction method for top view piglet thermal image. Computers and Electronics in Agriculture, 155: 339-347. https://doi.org/10.1016/j.compag.2018.10.030
[14] Davis, J.W., Keck, M.A. (2005). A two-stage template approach to person detection in thermal imagery. In 2005 Seventh IEEE Workshops on Applications of Computer Vision (WACV/MOTION'05)-Volume 1, Breckenridge, CO, USA, pp. 364-369. https://doi.org/10.1109/ACVMOT.2005.14
[15] Wu, H., Sun, X., Liu, Y., Wang, D., Wei, B. (2020). Fusion between shape prior and graph cut for vehicle image segmentation. Traitement du Signal, 37(2): 255–262. https://doi.org/10.18280/ts.370211
[16] Monteiro, F.C., Campilho, A.C. (2006). Performance evaluation of image segmentation. In International Conference Image Analysis and Recognition, pp. 248-259. https://doi.org/10.1007/11867586_24