Ankit Kumar | Kamred Udham Singh* | Linesh Raja | Teekam Singh | Chetan Swarup | Abhishek Kumar
© 2021 IIETA. This article is published by IIETA and is licensed under the CC BY 4.0 license (http://creativecommons.org/licenses/by/4.0/).
OPEN ACCESS
In recent years, scholars have found content-based image recovery to be a particularly interesting and exciting field. This field develops quick image recovery algorithms that are very similar to pictures from various data sources. There is currently a lot of space and sources for data storage. Finally, once data sources are obtained, there is just competition for the exact and best result. The result is filtered using the heuristic correlation based on the above features of the photographs. The overall matching scores are calculated by adding all these individual feature ratings. The recommended method will be used to retrieve all images containing the content of the query image. The scores will be used to rate the match. The results of the combined method simulation demonstrate that the strategy is successful. This proposed model will improve the accuracy of search results. This research model, like the other metadata models on the web, is interactive and familiar for searching pictures from huge databases and data sources. This model also has a number of handy features built in to improve precision and efficiency. Although there are a few little mysteries in this model, they must be answered subsequently.
RGB, HSV, image content, histogram, CBIR, efficiency
In today's world, CBIR (Content Based Image Retrieval) is a wide subject that is open to new ideas and growth [1, 2]. There are two techniques for searching for images: the first is text-based searching, which is the old-fashioned manner, and the second is content-based or retrieval methods, which is also known as query by example searching. In the first approach, the user must input the keywords for the photos, and the search will proceed on the basis of the keywords entered. This method may be seen in action in the Google search engine. When using the content-based image retrieval technique, on the other hand, there are certain image factor contents, and these contents are in the form of distances. These distances can simply be matched with the query image for an accurate result. In a typical query image, the user can provide a field of interest for the researchers who will be working on the image. The usage of the internet and World Wide Web applications is rising at an exponential rate, as is the amount of data available to users. Every day, or we might say every minute, a massive quantity of picture database is added to the internet, and this number is growing by the minute. Because of this, it is clear that we require effective and efficient retrieval systems for this massive picture collection in order to obtain correct results. The development of new techniques and attempts to alter existing methods are ongoing activities for researchers working toward the achievement of these types of approaches. For searching the visually similar images from a large database is done by its visual information. It is obvious that the system using this method of retrieving the images from database need not to face the drawbacks of text-based searching. By means no need of entering the keywords manually, because now the search is based on visual information itself. The searching of images with the help of their visual content like color, texture and shape is called CBIR (Content Based Image Retrieval). CBIR is system or technique to organize and retrieve the images on behalf of their visual information.
The following are the two main steps for CBIR [3]:
1. The image has to change in mathematical form by re-encoding and stored in a database.
2. There should be a method to compare the query and stored images (mathematical forms).
An image is a collection of pixels and it will remain same with contained features except it is not re encoded into other form. These pixels have gap between them, and this gap contains the visual information about the image, so by re-encoding process this information can be capture and store. This process is called feature extraction. The mathematical form that images contains called its signature and the components of signature are called features [4, 5].
A color moment is an example of signature constructed from color feature. Some visual information about the image or subpart of the image are called features, if the feature is related to subpart of the image then it is known as local features and if it is a part of image then known as global features [6, 7].
Local features: Local feature techniques are more successful at retrieving information from images and have greater discriminative power than global feature approaches. However, with large image datasets, the number of local characteristics that can be recovered for each image can be enormous.
Global features: Global features, such as colour space and object identification, are used to describe the entire image's content, whereas local features describe a small patch (or collection of pixels) within the image. The extraction of global descriptors accelerates the extraction of features and the computation of similarity.
There are two level for features one is low-level, and another is high-level features, features those can be extracted from the pixels itself called low-level features. High-level features can be obtained by combinations of low-level features [8, 9]. Color and shape are the example of low-level features. Some common low-level features are following:
I. Color
II. Texture
III. Shape
Color carries a great deal of information about a picture, and this characteristic, without a doubt, enhances the attractiveness of the image; as a result, this property is utilized as a major actor in the image search process, as seen below. When it comes to images, shapes do not always represent their real shapes; rather, they represent the shapes of certain regions inside a given image [10]. This characteristic may be retrieved from an image by applying segmentation or edge detection techniques to it. Because the segmentation process is extremely tough and complicated, it is sometimes necessary to employ human vision and intellect in order to obtain the desired forms.
A new research topic in cyber security and privacy is privacy protection in Content Based Image Retrieval (CBIR). Modern CBIR systems typically use an interactive mechanism, namely relevance feedback, to improve retrieval precision. It is a difficult problem to protect the user's privacy in such Relevance Feedback based CBIR (RF-CBIR). We investigate this issue in this paper and propose a new Private Relevance Feedback CBIR (PRF-CBIR) scheme. PRF-CBIR can benefit from the performance boost of relevance feedback while also preserving the user's search intent. The new PRF-CBIR is divided into three stages: 1) private search; 2) private feedback; 3) local retrieval Private query executes the initial query with a privacy controllable feature vector; private feedback creates the feedback image set by introducing confusing classes in accordance with the K-anonymity principle; and local retrieval re-ranks the images on the user side. PRF-CBIR meets the privacy requirements, according to the privacy analysis. The experiments on real-world image collection confirm the efficacy of the proposed PRF-CBIR scheme.
This paper presents a novel image descriptor for content-based image retrieval tasks that combines contour and colour information into a single vector. Operations are performed on a fixed lattice of discrete positions by a set of edge detecting kernels that calculate region derivatives at different scales and orientations, loosely inspired by the human visual system and its mechanisms for efficiently identifying visual saliency. The description method employs a weighted edge histogram, with bins populated based on whether the regions contain edges belonging to the salient contours, and the discriminative power is enhanced further by incorporating regional quantized colour information. The proposed technique is efficient and adaptable to the specifics of each depiction, and it requires no training data to adjust parameters. An experimental evaluation of the proposed descriptor on seven benchmarking datasets against 13 well-known global descriptors, as well as SIFT and SURF implementations (both in VLAD and BOVW), demonstrates its effectiveness and efficiency.
Images are typically stored in a compressed format to reduce storage size due to the dramatically increased volume of remote sensing (RS) image archives. Existing content-based RS image retrieval (CBIR) systems require fully decoded images as input, making large-scale CBIR problems computationally demanding. To address this limitation, we present in this paper a novel CBIR system that performs coarse-to-fine progressive RS image description and retrieval in the partially decoded Joint Photographic Experts Group (JPEG) 2000 compressed domain. Initially, the proposed system 1) decodes the code blocks associated only with the coarse wavelet resolution and 2) discards the most irrelevant images to the query image based on similarities computed on the coarse resolution wavelet features of the query and archive images. The remaining images' code blocks associated with the subsequent resolution are then decoded, and the most irrelevant images are discarded by computing similarities between the image features associated with both resolutions. This is accomplished by employing the pyramid match kernel similarity measure, which gives greater weight to features associated with finer wavelet resolution than to those associated with coarse wavelet resolution. These steps are repeated until the codestreams with the highest wavelet resolution are decoded. The final retrieval is then performed on a very small set of fully decoded images. The experimental results obtained on two benchmark archives of aerial images show that the proposed system is much faster than standard CBIR systems while providing similar retrieval accuracy.
Fabric image retrieval, a special case of Content Based Image Retrieval (CBIR), has recently become a research hotspot due to the potential values in many areas such as e-commerce and inventory management. It is also a difficult problem with numerous obstacles, such as the variety and complexity of fabric appearance, as well as the high requirements for retrieval accuracy. This paper proposes a novel approach for fabric image retrieval based on multi-task learning and deep hashing to address this issue. A multi-classification-task learning model with uncertainty loss and constraint is presented by the fabric cognitive system to learn fabric image representation. The extracted features are then encoded into 128-bit hashing codes using an unsupervised deep network. Furthermore, hashing codes are used as a fabric image index for image retrieval. To evaluate the proposed approach, we expanded and upgraded the dataset WFID, which was created specifically for fabric image retrieval in our previous research. The experimental results show that the proposed method outperforms the current state-of-the-art.
One of the most difficult and ambiguous tasks in content-based image retrieval (CBIR) is correctly understanding the human query intention and measuring its semantic relevance with images in the database. Because of visual saliency's impressive ability to predict human visual attention, which is closely related to query intention, this paper attempts to explicitly discover the essential effect of visual saliency in CBIR through qualitative and quantitative experiments. To that end, we first use an eye-tracking apparatus to generate fixation density maps of images from a widely used CBIR dataset. These ground-truth saliency maps are then used to assess the impact of visual saliency on the task of CBIR by investigating various potential methods of incorporating such saliency cues into the retrieval process. We discover that visual saliency is indeed beneficial to the CBIR task, and that the best saliency involving scheme may differ for different image retrieval models. In response to the findings, this paper proposes two-stream attentive convolutional neural networks (CNNs) with saliency embedded within for CBIR. The proposed network has two streams that handle two tasks at the same time. The primary stream is concerned with extracting discriminative visual features that are closely related to semantic attributes. Meanwhile, the auxiliary stream aims to help the main stream by redirecting feature extraction to the salient image content that a human might notice. Image similarity can be computed as the human does by reserving conspicuous content and suppressing irrelevant regions by fusing these two streams into the Main and Auxiliary CNNs (MAC). Extensive experiments show that the proposed model performs admirably in image retrieval on four publicly available datasets.
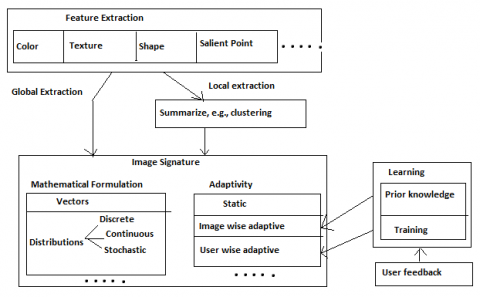
A comparison will be carried out between the signatures of the pictures once they have been generated and saved in a database, as described above. Similarity measurements are used to describe the process of comparing two things. When comparing the signature of a query picture with the signatures of images in the database, they are called signature comparisons. Those images with signatures that are more comparable to those of the query image will be retrieved [11]. The following are the major components of a Content-Based Image Retrieval System (CBIR System) shown in Figure 1. Extraction of characteristics: As explained in the preceding section, this process involves re-encoding the picture using low-level features and storing the resulting image in a feature database.
Figure 1. An overview of image signature formulation
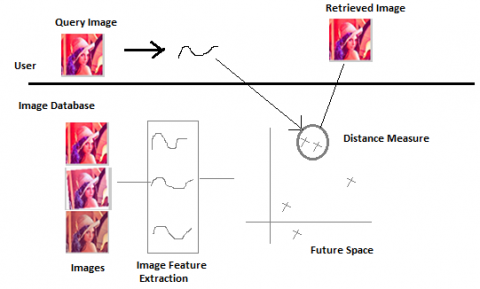
Figure 2. CBIR process
Figure 2 shows a diagrammatic view of Content Based Image Retrieval Process as discussed above.
2.1 Principle of content based image Meta search
The color and texture characteristics of a picture are extremely essential and expressive visual characteristics. These feature descriptors have been the subject of much research. The retrieval of similarity is an excellent example of an application that fits this description. In terms of color descriptors, a color histogram [12], which displays the color distribution in an image [13], is a very excellent example of a color histogram.
Figure 3 includes three basic components common to most meta-search engines: the query dispatcher, query translator, and display interface component.
Figure 3. IMAGINGMSE
2.2 Comparison techniques
The presentation of an image in feature space is mandatory in all systems [14]. To calculate distance between query image and other stored images Euclidean distance vector model is there for easy calculations.
3.1 Features of color
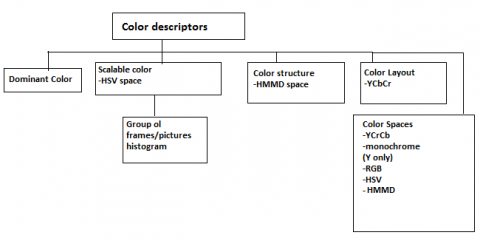
Color is the most prominent aspect of the picture, and it is utilized as a strong and efficient tool in content-based image retrieval systems. The primary goal of this technique is to provide photos that are visually comparable to the query image in terms of color and texture. There are a variety of ways for extracting color images, but this study will focus on the color histogram as a starting point. In an image, color histograms are a technique to describe the distribution of colors in the picture shown in Figure 4, and each color histogram represents a different color in the image's relevant color space. If the distance between the query picture histogram and the data image histogram is more than one, then the histograms should be compared [15].
3.2 Algorithm
In this algorithm the wavelet-based approach for efficient extraction of images using histograms and color heuristic and other features. This also contains the accuracy of the result with well monopoly with the metadata. Because of its perceptual uniformity, the HSV color space is used in this dissertation [16]. That is, the three components H (Hue), S (Saturation) and V (Value) are closely related with the way human eye perceives the color. The approach here is to extract two histograms, for Hue and for Saturation. It is not considered in our color measurement approach because of its perceptual uniformity [17].
|
Algorithm 1: RGB to HSV color space |
|
Input: Color Space of RGB |
|
Output: Color Space of HSV |
|
Def RGB_HSV() |
|
Compute Max= max(R,G,B) |
|
Compute Min= min(R,G,B) |
|
If (Max==0 ): |
|
Saturation =0 |
|
Else |
|
Saturation=(Max+Min)/Min |
|
If (Max==Min) |
|
Hue is under defined (Achromatic Color) |
|
Else |
|
If (Max==R && G> B) |
|
Hue =60*(G-B)/(Max-Min) |
|
Else if (Max==R && G>B) |
|
Hue=60*(2.0+(B-R)/(Max-Min) |
|
Else if (G==Max) |
|
Hue=60*(2.0+(B-R)/(max-Min)) |
|
Else |
|
Hue=60*(4.0+(R-G)/(Max-Min)) |
|
End |
3.3 Edge histogram descriptor
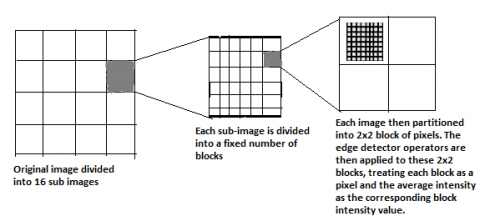
Those image blocks whose edge strengths exceed a particular minimum threshold are related to computing histogram [18]. Thus, for an image block, this work can analyze five edge strengths, one for every five filters from image. Basic idea of edge histogram descriptor is shown in Figure 5 and Figure 6.
3.4 Discrete wavelet transform
$\begin{aligned}
&W_{0}(j, k 1, k 2) \\
&=\frac{1}{\sqrt{N 1 N 2}} \sum W_{n=0}^{S 1=1 N 2=1}(n 1, n 2) \theta_{j 0 . k 1 k 2}\quad(n 1, n 2)
\end{aligned}$ (1)
$\begin{aligned}
&W_{1}(j, k 2, k 3) \\
&=\frac{1}{\sqrt{N 1 N 2}} \sum W_{n=0}^{s 1=1 N 2=1}(n 1, n 2) \theta_{j 0 . k 1 k 2}\quad(n 1, n 2)
\end{aligned}$ (2)
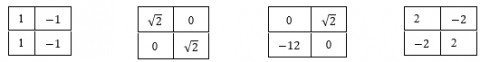
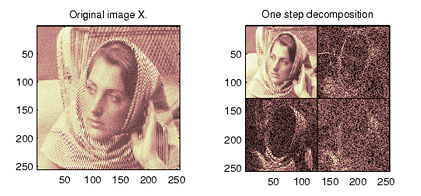
where, i = H, V, D indicate the directional index of the wavelet function. j0 = 0 initially represents the starting scale. ϕ and ψ are standard functions of discrete variables. The first level decomposition of a gray scale image appears in the Figure 7.
Figure 4. Color space descriptors
Figure 5. Computing the edge histogram descriptor
Figure 6. Filter for edge detection
Figure 7. First level decomposition of image through DWT
3.5 Relative smoothness
Statistical techniques characterize textures using the statistical properties of the grey levels of the points pixels comprising surface image. Statistical Texture analysis is an important issue with applications ranging from remote sensing and crop classification to object-based image coding and tissue recognition in medical images. The texture analysis of each decomposed image is carried out by calculating following relevant features If $\sigma$ is the standard deviation. Relatives moothness is given by Ref. [9]:
$R=1-\frac{1}{1+\sigma^{2}}$ (3)
3.6 Dominant color
3.6.1 Algorithm
The colors in an image or a specified region are the very first cluster to be calculated or computed in order to calculate or compute this descriptor. The percentages and the small number of colors are calculated, and as a result, the result is referred to as an outcome. It is also possible to determine the variances of colors allocated to a particular dominant color. When the colors are concentrated in a specific location, the percentages of the colors should sum up to 1. Color variance can be specified in an optional field, if desired [18]. The spatial coherence of the main colors in the image is used to indicate the overall spatial homogeneity of the dominant colors in the image. The picture of the dominating color is represented by fifty different hues, and the colors chosen to depict the image of the dominant color might change. The simple color histogram is generated by selecting the 50 most frequent colors in the image and calculating the simple color histogram. The determination of the dominating color is mostly reliant on the information in the foreground. The foreground information is sufficient for computing, identifying, and searching through the pictures and flow chart for feature calculation shown in Figure 8. The following algorithm has been proposed to do this [19].
3.7 Proposed algorithm
|
Purpose: The algorithm is to retrieve images similar to the input image. |
|
Input: N no of RGB image for Extract Feature |
|
Output: Extract the Content from Image |
|
Step 1: For image I to N perform |
|
Each image layer should have the Transform applied (R, G, and B). There will be three possible output orientations for the final photos (vertical, horizontal, and diagonal). |
|
Step 2: Calculate the colour moments for each ranklet picture (vertical, horizontal, and diagonal) in the supplied layer. |
|
Step 3: Create a feature vector to represent the picture with 27 numerical values contained within it. |
|
Step 4: Calculate the distance between the input image and the centroid of each cluster using Euclidian Distance, and find the smallest distance. |
|
Step 5: Distance between a picture and images in the cluster that are closest to each other is calculated by image. |
|
Retrieve the first n images that is similar to the input image. |
Figure 8. Flowchart for feature calculation
3.8 Combined weighted features
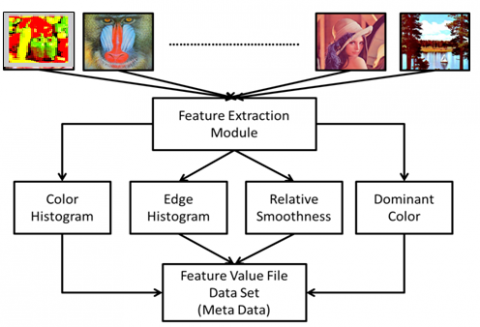
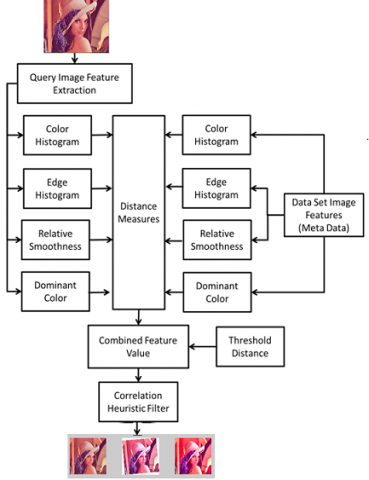
The characteristics are retrieved from the search dataset and saved as meta-data associated with the picture file, which may be accessed by other applications. The fact that each of the characteristics has relevance in some particular sectors means that none of them can be disregarded [20]. It is necessary to generate a composite feature value that will be compared to the feature values of the query image. When a query picture is provided to the query engine, the query engine calculates all of the above-mentioned decrypted features for the query image and determines the distances between the stored features and the query features, as shown in the diagram. The next section contains the measurements for the distances. In terms of combined features, this simply means combining the feature values for a certain image after multiplying the value by the weight allocated to the feature in question. According to the application of the searching pictures domain, the weights of the photos are different shown in Figure 9. The weights allocated to natural photos are different from the weights assigned to medical images while searching for them. By dynamically changing these weights depending on the search image domain [21], it is possible to achieve more effective results.
Figure 9. Flowchart for meta search based on contents
3.8.1 Euclidian distance
The Pythagorean formula using to calculate the “ordinary” distance between two points is known as the Euclidean distance or Euclidean metric [22]. The formula is given as following: -
In general, for an n-dimensional space, the distance is shown in Eq. (4):
$\begin{aligned} d(p, q)=\sqrt{\left(p_{1}-q_{1}\right)^{2}}+\left(p_{2}-q_{2}\right)^{2} & \\+\cdots \cdot.+\left(p_{i}-q_{i}\right)^{2}+\left(p_{n}-q_{n}\right)^{2} \end{aligned}$ (4)
3.8.2 Cosine distance
By measuring the cosine of the angle between two points we can implement the cosine similarity. The lowest value of cosine if the angle is below 1 is -1 and the value at 0 is 1. The use of cosine of the angle is to determine whether the two vectors are in rough or same direction [23]. If there are two vectors say A and B then the cosine similarity is represented using a dot product shown in Eq. (5): -
$\cos (\theta)=\frac{A \cdot B}{\|A\| B \|}=\frac{\sum_{i=1}^{n} A_{i} \times B_{i}}{\sqrt{\sum_{i=1}^{n}\left(A_{i}\right)^{2}} \times \sqrt{\sum_{i=1}^{n}\left(B_{i}\right)^{2}}}$ (5)
The similarity of the result can be measure as for -1 it’s exactly the opposite and for 1 its exactly the same, where 0 indicates independence and the in between values are representing the intermediate similarity or dissimilarity [24].
3.8.3 Correlation meta heuristic
The correlation ratio given by equation [25] below is also widely used to measure the quality of the registration process shown in Eq. (6): -
$R^{2}(i, j)=\left[\frac{\operatorname{Cov}(I, J)}{\sqrt{\sum_{r}(i(s)-i)^{2} X \sqrt{\sum_{r}(j(s)-j)^{2}}}}\quad\right]$ (6)
4.1 Input dataset
We have taken the data set from https://www.kaggle.com/emmarex/plantdisease. The image of different plant are utilized for algorithm testing includes both conventional images such as Lena, Baboon, Onion, and other such characters, as well as photographs taken with a digital camera. The pictures are decorated with a variety of patterns and textures. The picture characteristics have been discovered in the R, G, and B color domains. The numerous pictures that were utilized for the algorithm's performance evaluation have been displayed. Some of the basis pictures in these photographs are the same as in the study [26]. Through a series of changes performed on the basis pictures, several other images have been created. The aim of this large database with such a wide range of images is to see if the system is capable of searching for images that are identical to the base image but have undergone certain linear modifications before being shown. This vast and diversified dataset enhances the effect of our technique to searching a huge dataset of pictures that are transformations of other images, which is based on transforming images of other images. We will use the photos given below as input images, and our algorithm will compute the characteristics of the images, which will then be saved in the MATLAB data files that we will create. The query photos may or may not be the same as the input images that were provided [27].
4.2 Feature calculation
The methods described in the preceding chapter are used to compute a variety of characteristics. In this part, we demonstrate the effects of several characteristics. In MATLAB, the values of these characteristics are saved in data files. Each of the characteristics is represented by a numeric value that was calculated as part of the feature computation. These values are computed for both the query image and the background image. The characteristics of the query feature and those of the previously stored features are compared to one another and distances are determined. If the distances between the photos are smaller than a certain threshold, the images are considered to have the same content and are presented in the query result as a result.
Figure 10. The image dataset
Examples of feature file values are provided in the table below. The value of the smoothness of the picture is stored in the ‘smth' variable. The histogram of the RGB picture is stored in the ‘colorhist' variable, which has 256 bins [28]. The term 'edgehist' refers to the image's edge characteristics. Finally, we determine which colors are the most prominent in a given picture. Also based on the color histogram, they are also a good choice. These colors represent the 50 most often occurring colors in a picture. Each image is represented by a distinct MATLAB file with all of the information about it. This is the metadata required for the search.
smth: 0.9984
colorhist: [1x256 double]
edgehist: [0.0062 0.0099 0.0087 0.0074 0.0034]
domcolor: [1x50 double]
Figure 10 shows the MATLAB data files that store the values of various features. One file is created for each image in the dataset. The sample values of features shown earlier are contained in these files. So when the query engine starts it imports all these files to the MATLAB simulator [29]. Query image also containing temporary feature vector. This temporary feature vector is compared with all these files and distances are found. The distances less than a particular threshold are taken as a query match and displayed in the results. Images with distant features are ignored in the search result.
4.3 Image query
As shown in Figure 11, we can browse the image from the dataset by the browser window. The sample browse window is shown below. This gives us flexibility to select the query image from the whole available storage space show in Figure 12.
Figure 11. Browse window for query image
Figure 12. Sample query image for simulation performance analysis
4.4 Performance of individual features
Now I'll be able to examine the results of the various characteristics that were discovered throughout the search of the previously mentioned search picture. During the search [30], we will be able to see both visual and distance-based results. The photos will be displayed in the ascending order of the distances in the visual-based results. The distance metrics are used to determine the distances between the various characteristics of the object.
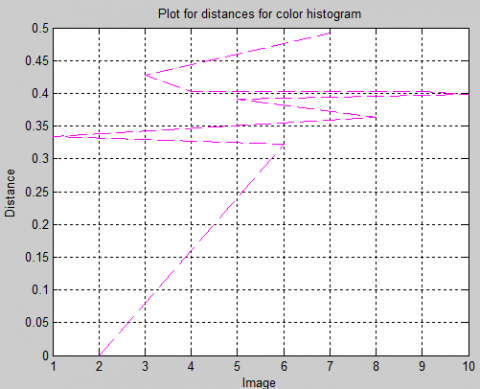
4.5 Search results for color histogram feature
The results of the search are displayed in the figures in this section, which are based on a color histogram comparison of the query image with the photos from the dataset. The distances depicted in the picture represent the values of the difference between the query image and a certain image attribute. It is obvious that the majority of comparable pictures have been effectively searched, with the exception of the geometrically altered images, which are difficult to locate [31]. The plot between the pictures and the parametric distance is depicted in the following Figure 13. As a result of the large variance in the image distances from the feature, this feature is extremely essential and should be given greater weight when feature combination is performed.
Figure 13. Image versus parametric distance plot for color histogram
4.6 Search results for edge histogram feature
The search results shown in this section are based on an edge histogram comparison of the query picture with the dataset images, and the figures in this section represent the results of that comparison. The distances depicted in the picture represent the values of the difference between the query image and a certain image attribute. It is plainly evident that the majority of the comparable photos have been properly searched, but the images with differing contrast values are separated by a greater distance than the other images. An image with high contrast has more edges than a low contrast image, which accounts for this [32]. The plot between the pictures and the parametric distance is depicted in Figure 14 (right). Because the variance in the plot is very small, the weight that should be assigned to each feature during feature combination should also be small.
The HSV color model was used to compute gradients using the orientation component of the Weber local descriptor (WLD). This is because the bulk of chrominance information is lost when gray-scale photos are used. Since rotation invariant characteristic from the chrominance component is useful for obtaining discriminative features, local gradient orientations were retrieved. It was necessary to determine the gradient orientation [40] from the angle between the reference axis and the vector in the horizontal and vertical locations x. $\quad \theta\left(y_{c}\right)=\alpha_{s}^{1}=$ $\arctan \left(\frac{u_{t}^{11}}{u_{t}^{10}}\right), f_{10}=\left[\begin{array}{l}-1 \\ +1\end{array}\right]$ and $f_{11}=\left[\begin{array}{l}-1 \\ +1\end{array}\right]$. When filters $f_{10}$ and $f_{11}$ are applied to an input image, then outputs $u_{t}^{11}$ and $u_{t}^{10}$ are obtained. $u_{t}^{10}=y_{5}-y_{1}$ and $u_{s}^{11}=y_{7}-y_{3} \cdot \theta$ is quantized into $T$ gradient orientations. Firstly, mapping is done before quantization $f: \theta \rightarrow \theta^{\prime}: \theta^{\prime}=$ $\arctan 2\left(u_{s}^{11}, u_{s}^{10}\right)+\pi \quad$ and $\quad \arctan 2\left(u_{s}^{11}, u_{s}^{10}\right)=$ $\left\{\begin{array}{ll}\theta, & u_{s}^{11}>0 \text { and } u_{s}^{10}>0 \\ \pi-\theta, & u_{s}^{11}>0 \text { and } u_{s}^{10}<0 \\ \theta-\pi, & u_{s}^{11}<0 \text { and } u_{s}^{10}<0 \\ -\theta, & u_{s}^{11}<0 \text { and } u_{s}^{10}>0\end{array}, \theta \in[-\pi / 2, \pi / 2]\right.$, and $\theta^{\prime} \in$$[0,2 \pi]$. The value of is taken into account while doing the mapping. The following equation is used for quantization function. $\varphi_{s}=f_{r}\left(\theta^{\prime}\right)=(2 q / Q) \pi$, and $q=\mod \left(\theta^{\prime} /(2 \pi /\right.$ $T)+(1 / 2))$. If $T=8$ then $\varphi_{s}=(s \pi) / 4(s=0,1, T-1)$. To extract gradient orientation for distinct granular components of visual representation, employ the multi-scale gradient orientation. The discriminative capacity of a single resolution can be improved by using a multi-scale gradient orientation. It's calculated by taking the length of $(2 \mathrm{R}+1)$ and employing square neighbors of P pixels.
Figure 14. Image versus parametric distance plot for edge histogram
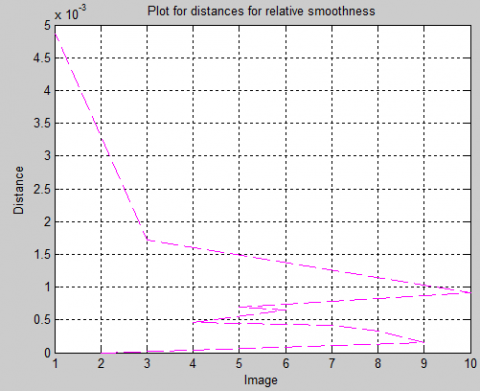
Figure 15. Image versus parametric distance plot for relative smoothness
4.7 Search results for relative smoothness feature
The search results are displayed in the figures in this part on the basis of a relative smoothness comparison of the query image with the dataset images, as illustrated in the figures in this section. It is the difference values between the query image and a specific picture's relative smoothness that are represented by the distances indicated in the figure. The smoothness proportion of the pictures with differences in brightness and contrast is not the same for all of them. However, this is extremely useful since the smoothness of any picture can be discovered in the DWT domain. It has the benefit of being almost identical in frequency response between comparable pictures, which makes a calculating feature in the DWT domain advantageous. The plot between the pictures and the parametric distance is depicted in the Figure 15. As a result of the large variance in the image distances from the feature, this feature is extremely essential and should be given greater weight when feature combination is performed.
4.8 Search results for dominant color feature
The search results are displayed in the figures in this part on the basis of a relative smoothness comparison between the query picture and the dataset images. The distances indicated in the picture represent the values of the difference between the query image and the prominent colors of a particular image. The photos with a variation in brightness and contrast do not have the same prominent colors as the images with the same brightness and contrast. However, this is quite useful because colors are the most distinguishing characteristics of any image. The plot between the pictures and the parametric distance is depicted in the following Figure 16. Because the variance in the plot is very small, the weight that should be assigned to each feature during feature combination should also be small.
Figure 16. Image versus parametric distance plot for dominant color
4.9 Combined feature performance
We decide a threshold for the combined distance score. All the images less than this threshold are contestants for successful search. This is correlation comparison heuristic. We will see the effect of this extra heuristic in the next section. Figure 17 shows the plot between the images and the combined parametric distance. The lower part of the plot has very little variation and most of the images have higher distance. So we can say that we can clearly define a boundary threshold for which the images having distance more than the boundary can be ignored in the final result shown in Figure 18.
Figure 17. Image versus parametric distance plot for combined features
Figure 18. Image versus parametric distance plot comparison of all the parameters and their combined matching score
4.10 Result of correlation as similarity measure heuristics
The HSV colour model was utilised to generate gradients using the orientation component of the Weber local descriptor, which was derived from the Weber local descriptor (WLD). This is due to the fact that when gray-scale photographs are utilised, the majority of the chrominance information is lost. Because the rotation invariant characteristic of the chrominance component is beneficial for collecting discriminative features, which is explained in figure 18. The orientations of local gradients were recovered from the chrominance.
When the query picture is received, the suggested technique will be utilized to obtain all of the photos with content that is linked to the query image. A ranking of the match will be determined based on the results of the game. In order to get the total matching score, all of the features are weighted according to the application and put together. This score directs the search for all of the photos that have a high combined score. Because of weighted feature and application dependency, we must apply one more constraint heuristic to these results in order to make them more accurate. The results of the combined method's simulations indicate that the technique is successful in reducing the risk of injury. The accuracy of search results will improve as a result of the suggested model. When it comes to looking for pictures from large databases and data sources, this research model is highly interactive and familiar, much like the other meta-data models that are available on the web for searching images from large databases and data sources. In addition, this model has a number of useful characteristics that will help to enhance its accuracy and efficiency in the future. Despite the fact that this model has a few tiny puzzles that must be solved thereafter.
[1] Kavitha, C., Prabhakara Rao, B., Govardhan, A. (2011). Image retrieval based on color and texture features of the image sub-blocks. International Journal of Computer Applications, 15(7): 33-37.
[2] Kekre, H.B., Thepade, S.D., Maloo, A. (2010). Image retrieval using fractional coefficients of transformed image using DCT and Walsh transform. International Journal of Engineering Science and Technology, 2(4): 362-371.
[3] Singha, M., Hemachandran, K. (2012). Content based image retrieval using color and texture. Signal and Image Processing: An International Journal, 3(1): 39-57.
[4] Ahmed, K.T., Aslam, S., Afzal, H., Iqbal, S., Mehmood, A., Choi, G.S. (2021). Symmetric image contents analysis and retrieval using decimation, pattern analysis, orientation, and features fusion. IEEE Access, 9: 57215-57242. https://doi.org/10.1109/ACCESS.2021.3071581
[5] Shen, L., Zhu, W., Wang, X., Xing, L., Pauly, J.M., Turkbey, B., Harmon, S.A., Sanford, T.H., Mehralivand, S., Choyke, P.L., Wood, B.J., Xu, D. (2021). Multi-domain image completion for random missing input data. IEEE Transactions on Medical Imaging, 40(4): 1113-1122. https://doi.org/10.1109/TMI.2020.3046444
[6] Brogan, J., Bharati, A., Moreira, D., Rocha, A., Bowyer, K.W., Flynn, P.J., Scheirer, W.J. (2021). Fast local spatial verification for feature-agnostic large-scale image retrieval. IEEE Transactions on Image Processing, 30: 6892-6905. https://doi.org/10.1109/TIP.2021.3097175
[7] Bharati, A., Moreira, D., Flynn, P.J., de Rezende Rocha, A., Bowyer, K.W., Scheirer, W.J. (2021). Transformation-aware embeddings for image provenance. IEEE Transactions on Information Forensics and Security, 16: 2493-2507. https://doi.org/10.1109/TIFS.2021.3050061
[8] Zhu, H., Zhao, Y., Wang, R., Wang, R., Chen, W., Gao, X. (2021). LLISP: Low-light image signal processing net via two-stage network. IEEE Access: Practical Innovations, Open Solutions, 9: 16736-16745. https://doi.org/10.1109/ACCESS.2021.3053607
[9] Kumar, A., Goyal, D., Dadheech, P. (2018). A novel framework for performance optimization of routing protocol in VANET network. Journal of Advanced Research in Dynamical & Control Systems, 10(Sp2): 2110-2121.
[10] Rossi, A., Hosseinzadeh, M., Bianchini, M., Scarselli, F., Huisman, H. (2021). Multi-modal Siamese network for diagnostically similar lesion retrieval in prostate MRI. IEEE Transactions on Medical Imaging, 40(3): 986-995. https://doi.org/10.1109/TMI.2020.3043641
[11] Chen, B., Li, H., Fan, H., Wang, S. (2021). No-reference screen content image quality assessment with unsupervised domain adaptation. IEEE Transactions on Image Processing, 30: 5463-5476. https://doi.org/10.1109/TIP.2021.3084750
[12] Kumar, A., Dadheech, P., Kumari, R., Singh, V. (2019) An enhanced energy efficient routing protocol for VANET using special cross over in genetic algorithm. Journal of Statistics and Management Systems, 22(7): 1349-1364. https://doi.org/10.1080/09720510.2019.1618519
[13] Liao, L., Xiao, J., Wang, Z., Lin, C.W., Satoh, S. (2021). Uncertainty-aware semantic guidance and estimation for image inpainting. IEEE Journal of Selected Topics in Signal Processing, 15(2): 310-323. https://doi.org/10.1109/JSTSP.2020.3045627
[14] Kumar, A., Dadheech, P., Singh, V., Poonia, R.C., Raja, L. (2019). An improved quantum key distribution protocol for verification. Journal of Discrete Mathematical Sciences and Cryptography, 22(4): 491-498. https://doi.org/10.1080/09720529.2019.1637153
[15] Liu, C., Ma, J., Tang, X., Liu, F., Zhang, X., Jiao, L. (2021). Deep hash learning for remote sensing image retrieval. IEEE Transactions on Geoscience and Remote Sensing, 59(4): 3420-3443. https://doi.org/10.1109/TGRS.2020.3007533
[16] Kumar, A., Dadheech, P., Singh, V., Raja, L., Poonia, R.C. (2019) An enhanced quantum key distribution protocol for security authentication. Journal of Discrete Mathematical Sciences and Cryptography, 22(4): 499-507. https://doi.org/10.1080/09720529.2019.1637154
[17] Dadheech, P., Goyal, D., Srivastava, S., Kumar, A. (2018). A scalable data processing using Hadoop & MapReduce for big data. Journal of Advanced Research in Dynamical & Control Systems, 10(Sp2): 2099-2109.
[18] Sen Gupta, S., Hossain, S., Kim, K.D. (2021). HDR-like image from pseudo-exposure image fusion: A genetic algorithm approach. IEEE Transactions on Consumer Electronics, 67(2): 119-128. https://doi.org/10.1109/TCE.2021.3066431
[19] Xiang, J., Zhang, N., Pan, R., Gao, W. (2021). Fabric retrieval based on multi-task learning. IEEE Transactions on Image Processing, 30: 1570-1582. https://doi.org/10.1109/TIP.2020.3043877
[20] Kumar, A., Sinha, M. (2019). Design and analysis of an improved AODV protocol for black hole and flooding attack in vehicular ad-hoc network (VANET). Journal of Discrete Mathematical Sciences and Cryptography, 22(4): 453-463. https://doi.org/10.1080/09720529.2019.1637151
[21] Xu, J., Zhou, W., Chen, Z., Ling, S., Le Callet, P. (2021). Binocular rivalry oriented predictive autoencoding network for blind stereoscopic image quality measurement. IEEE Transactions on Instrumentation and Measurement, 70: 1-13. https://doi.org/10.1109/TIM.2020.3026443
[22] Yan, Y., Ren, W., Hu, X., Li, K., Shen, H., Cao, X. (2021). SRGAT: Single image super-resolution with graph attention network. IEEE Transactions on Image Processing, 30: 4905-4918. https://doi.org/10.1109/TIP.2021.3077135
[23] Cui, H., Zhang, G., Wang, T.Y., Li, X., Qi, J. (2021). Combined model color-correction method utilizing external low-frequency reference signals for large-scale optical satellite image mosaics. IEEE Transactions on Geoscience and Remote Sensing, 59(6): 4993-5007. https://doi.org/10.1109/TGRS.2020.3018591
[24] Stojkovic, A., Aelterman, J., Luong, H., Van Parys, H., Philips, W. (2021). Highlights analysis system (HAnS) for low dynamic range to high dynamic range conversion of cinematic low dynamic range content. IEEE Access, 9: 43938-43969. https://doi.org/10.1109/ACCESS.2021.3065817
[25] Zha, S., Pappas, T.N., Neuhoff, D.L. (2021). Hierarchical lossy bilevel image compression based on cutset sampling. IEEE Transactions on Image Processing: A Publication of the IEEE Signal Processing Society, 30: 1527-1541. https://doi.org/10.1109/TIP.2020.3043587
[26] Chen, D., Yuan, L., Liao, J., Yu, N., Hua, G. (2021). Explicit filterbank learning for neural image style transfer and image processing. IEEE Transactions on Pattern Analysis and Machine Intelligence, 43(7): 2373-2387. https://doi.org/10.1109/TPAMI.2020.2964205
[27] Cho, S.I., Kang, S.J. (2021). Learning methodologies to generate kernel-learning-based image downscaler for arbitrary scaling factors. IEEE Transactions on Image Processing, 30: 4526-4539. https://doi.org/10.1109/TIP.2021.3073316
[28] Van Nguyen, T., Thanh Nhat Mai, T., Lee, C. (2021). Single maritime image defogging based on illumination decomposition using texture and structure priors. IEEE Access, 9: 34590-34603. https://doi.org/10.1109/ACCESS.2021.3060439
[29] Zamir, S.W., Vazquez-Corral, J., Bertalmio, M. (2021). Vision models for wide color gamut imaging in cinema. IEEE Transactions on Pattern Analysis and Machine Intelligence, 43(5): 1777-1790. https://doi.org/10.1109/TPAMI.2019.2938499
[30] Ma, J., Wu, J., Li, L., Dong, W., Xie, X., Shi, G., Lin, W. (2021). Blind image quality assessment with active inference. IEEE Transactions on Image Processing, 30: 3650-3663. https://doi.org/10.1109/TIP.2021.3064195
[31] Kumar, A., Sinha, M. (2019). Design and development of new framework for detection and mitigation of wormhole and black hole attacks in VANET. Journal of Statistics and Management Systems, 22(4): 753-761. https://doi.org/10.1080/09720510.2019.1609555
[32] Kumar, A., Dadheech, P., Beniwal, M.K., Agarwal, B., Patidar, P.K. (2020) A fuzzy logic-based control system for detection and mitigation of blackhole attack in vehicular Ad Hoc network. In: Chaudhary A., Choudhary C., Gupta M., Lal C., Badal T. (eds) Microservices in Big Data Analytics. Springer, Singapore. https://doi.org/10.1007/978-981-15-0128-9_15