Qiuyu Bo | Wuqun Cheng*
© 2021 IIETA. This article is published by IIETA and is licensed under the CC BY 4.0 license (http://creativecommons.org/licenses/by/4.0/).
OPEN ACCESS
This paper designs an intelligent groundwater level monitoring system based on image recognition and Internet of things (IoT). Image recognition technology was employed to process the water level image, and determine the water level line. The IoT was adopted to transmit the collected multimedia data accurately to the monitoring end, thereby realizing the automatic remote monitoring of real-time water level. After analyzing the image recognition technology and the key algorithm of water level recognition, the authors designed the whole process of groundwater level monitoring with two modules: water level monitoring base station, and remote monitoring management center. The water level monitoring base station is embedded with a data acquisition module to periodically collect data, including water level, videos, and images. The collected data were sent to the remote monitoring management center through the cellular network. Then, flood or low water warning could be determined according to the historical data. Finally, the proposed groundwater level monitoring system was tested. The results show that the system not only solves the problem of measurement accuracy, but also improves the work efficiency.
image recognition, internet of things (IoT), groundwater level monitoring, edge detection algorithm
Groundwater resources and water security have great impacts on social stability, economic development, and ecological protection. The two issues can be reflected well by the important hydrological index of water level, which could be detected by many methods at the water level station. However, the traditional manual measurement of water level puts monitoring personnel at risk, and has a poor real-time performance. If water level gauge is adopted, the working mode will be very complex, and the measuring accuracy will be limited by the environment. In addition, neither manual measurement nor gauge measurement supports remote measurement. With technological progress, the traditional water level measuring approaches will be inevitably replaced by intelligent automatic water level monitoring methods.
As an important means of non-contact measurement, computer vision can automatically process and analyze the images collected by cameras, identify, locate, and track the targets in the monitoring scene, and analyze, judge, and predict target behaviors. To realize automatic remote acquisition of real-time water level at a high accuracy, it is necessary to build an automatic water level detection system based on the mature Internet of things (IoT) and image processing technology.
Based on image recognition and IoT, this paper designs and develops an intelligent remote monitoring system of groundwater level. The system relies on image recognition technology to process water level images, and determine the water level line. Then, the collected multimedia data were transmitted accurately to the monitoring end via the IoT, such as to realize the automatic, remote monitoring of groundwater level in real time.
Currently, groundwater level is generally measured by manual reading of water level gauge [1], or collection by automatic water level sensors [2]. By the detection principle, automatic water level sensors can be divided into float type, pressure type, capacitance type, radar type, ultrasonic type, etc.
The float-type water level gauge [3] uses the float to sense the rise and fall of water level, and directly drives the float to record the data mechanically. The investment cost is high, because a logging device is needed to sense the rising and falling water level.
The pressure-type water level gauge measures the water pressure with a pressure probe [4]. The different currents at different depths are converted into water levels. The advantage of the method is that the sensor can be fixed at the bottom of water without logging, and the atmospheric pressure can be eliminated by pressure pipe, enabling the direct measurement of water level.
The capacitance-type water level gauge [5] converts the water level detection into the induction of capacitance parameters, and displays it on the meter through the current.
The radar-type and ultrasonic-type water level gauges [6, 7] send radar/ultrasonic wave to the liquid level, and then receive the echo from the liquid level. The distance to the liquid level is obtained from the water level gauge, by calculating the return time of the echo. The water level is thus derived. The weaknesses of the two methods include high cost, device complexity, maintenance difficulty, and susceptibility to environmental disturbance. As a result, the two water level gauges often encounter measured water level drift.
In general, the above water level sensors work under a complex mode, and their accuracy is greatly affected by the environment. Hence, none of them can support remote monitoring of water level.
In recent years, digital image processing has been applied to water conservancy management. Zhang et al. [8] adopted image graying, horizontal edge detection, and K-means clustering (KMC) to detect the water level. Ding et al. [9] drew a calibration line near the water gauge to enhance the features of the video image, e.g., gray equalization and binarization, detected image edges with Robert operator, extracted the straight lines (i.e., water level line and calibration line) from the image through Hough transform, and derived the water level from the relationship between the two values. Kim et al. [10] used light intensity correction, shape correction, corrosion expansion to extract the approximate region of the water level from the original image, and then denoised the approximate to obtain the accurate water level. Based on Kalman filter, Hwung et al. [11] proposed a predictive correction method to estimate the position of horizontal plane. Fleury et al. [12] positioned the pre-installed calibration line and water level line by subtracting the two adjacent frames of the video image, and calculated the water level value according to their relative position. Hu and Li [13] held that the energy of flowing water area is relatively low in the high frequency area of the continuous video frames, and calculated the water level by spectral transformation of the video image.
To sum up, the existing water level detection methods can detect the water level, but at a relatively accuracy. This paper presents a novel image recognition algorithm to identify the water level, which improves the recognition accuracy. Besides, a complete system was built to transmit and store groundwater level data, as well as monitoring field images and videos.
The automatic image recognition algorithm of water level focuses on water surface and water level gauge of the water level image. The other contents of the image are essentially interferences. The water level line could be identified by the pixel value located at the boundary between the water level gauge and the water surface. Because the position of the water gauge is fixed in the water level image, the known information can be used to convert the said pixel value into the actual water depth.
This paper proposes a water level recognition algorithm based on dictionary learning. More precisely, the basis of our algorithm is supervised dictionary learning, which is more suitable for water level image recognition. As shown in Figure 1, the algorithm flow includes the following steps: image preprocessing, water gauge positioning, and water level recognition.
Figure 1. The flow of water level recognition algorithm
3.1 Image preprocessing
The color water level image collected by the camera contains lots of redundant information, which pushes up the computing load and drags down the recognition speed of the water level monitoring system. To improve system efficiency and accuracy, the image being collected should be preprocessed first. The preprocessing can ensure the accurate recognition of draft related information, improve the visual effect of draft image, and underpin rapid and accurate recognition. In our algorithm, the image is preprocessed through image graying, image enhancement, image segmentation, and classification.
Image enhancement is used to highlight the meaningful information in the image, and weaken the redundant information. Considering the large brightness deviation of the processed draft image, it is necessary to enhance the water level image and adjust the brightness to suit the processing effect. Image enhancement can be realized by the spatial domain method [14], which corrects and transforms the gray value of the image. It can also be achieved by the frequency domain method, which regards the image as a two-dimensional (2D) spectrum data, and improves image purity through low- or high-pass filtering. The other common image enhancement methods include: gray transformation, histogram processing, filtering, etc.
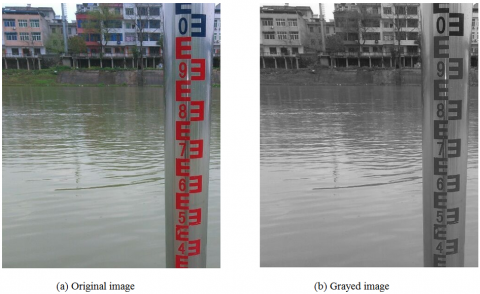
For the water level monitoring system, the original image is a color image. The color information takes up a large storage space, which slows down the recognition speed. Through preprocessing, the color image was converted into a gray image with much fewer data. This conversion greatly improves the speed of operation. Here, the weighted average method [15] is adopted for image graying. Figure 2 displays the grayed color image.
Figure 2. The effect of color image graying
During the real image shooting process, the contrast of the obtained image is very small, owing to the narrow gray distribution. As a result, the image details are not clear enough. For better clarify, the difference of gray value larger should be increased, i.e., widen the gray distribution, making the gray distribution more uniform. Then, the number of pixels will be roughly the same between gray intervals, and the image contrast will increase. In this case, the details will become clear and visible.
Histogram equalization [16] was introduced to stretch the image nonlinearly, resulting in a transformed image with uniform histogram distribution. Gray level histogram is the distribution function of gray level, which represents the number of pixels of each gray level in the image, and reflects the frequency of each gray value in the digital image.
In the gray interval of [0, L-1], the histogram of digital water level image can be expressed as a discrete function:
$p_{k}=h\left(g_{k}\right)$ (1)
where, $k=0,1, \ldots, L-1 ; g_{k}$ is the gray value of the $k$-th level; $p_{k}$ is the number of pixels with gray level $g_{k} ; L$ is the total grayscale.
If each value in the histogram is divided by the total number N of pixels in the digital water level image, the histogram can be normalized as:
$P\left(g_{k}\right)=p_{k} / N=h\left(g_{k}\right) / N$ (2)
Let $\mathrm{P}\left(g_{k}\right)$ be the estimated probability of occurrence of pixels with gray level $g_{k}$. The sum of all parts in the normalized histogram should equal 1. Equalization transformation can be defined as:
$\mathrm{s}\left(g_{k}\right)=\sum_{i=0}^{k} \mathrm{P}\left(q_{k}\right)=\sum_{i=0}^{k} p_{k} / p$ (3)
where, p is the total number of pixels.
3.2 Sobel-based recognition
The location of water level gauge is an important parameter in water level recognition. The local area of the gauge needs to be extracted by segmentation algorithm. Because the water level gauge has vertical edges, this paper chooses Sobel operator, which is sensitive to vertical and horizontal edges, to detect image edges. Then, the water level image was binarized to obtain the water level.
The Sobel-based recognition algorithm involves the following steps:
Step 1. The image is collected and preprocessed through graying and gray histogram equalization, producing image P.
Step 2. The Sobel operator for vertical edge detection is called to filter image P, calculate the coordinates of each vertical edge line of the gauge, and extract the local area of the gauge.
(1) The Sobel operator is adopted to filter image P, yielding the gradient image $G_{x}$ in the vertical direction:
$G_{x}=\left[\begin{array}{lll}-1 & 0 & 1 \\ -2 & 0 & 2 \\ -1 & 0 & 1\end{array}\right] * P$
(2) The gradient image is traversed to find the two vertical edges, whose gradient values are larger than the points on the left and right. The gradient values are summed by column, and two peaks appear on each vertical edge line. Then, a threshold is defined to extract the coordinates of the two vertical edge lines $x_{1}$ and $x_{2}$.
(3) The water level image Q is extracted from $x_{1}-x_{2}$.
Step 3. The pixel values on water level image are calculated by difference operation and threshold segmentation.
(1) Two images collected with a time interval t are processed through Steps 1 and 2, yielding the local areas Q1 and Q2 of the gauge. Then, a gray difference image C is obtained by differential operation of Q1 and Q2.
(2) In the difference image C, the gray value difference between Q1 and Q2 benchmarking parts is close to zero. This is because the position of the benchmarking remains stable, while the gray value difference of the water surface part changes with the continuous rippling of the water surface. The gray value of image C is normalized to the interval of [0, 255]. Then, the roughly dividing position between the benchmark and horizontal plane can be distinguished clearly.
Step 4. Threshold segmentation is performed on pixel value of water level.
(1) The relationship is drawn between the product between mean and variance of the gray value of image C and image ordinate.
(2) The relationship is properly filtered to reduce noise interference.
(3) The obtained water level coordinates are smoothed to minimize the influence of individual outliers on the monitored water level, and several images taken at similar time are taken to execute the above steps in pairs, yielding obtain their respective water level coordinates. After statistical processing, the extremely large and small values of these coordinates are removed, and the mean of the remaining data is taken as the pixel value of the current water level.
Step 5. The actual water level is calculated according to the mapping relationship between the actual benchmark length and image coordinates. According to the ratio of gauge width in the image to the gauge length above the horizontal plane, the gauge length above the actual water level line is calculated, and used to derive the real-time water level:
$L=L^{\prime} \frac{W}{W^{\prime}}$ (4)
$Y=H-L$ (5)
where, $L^{\prime}$ is the gauge length above horizontal plane in geometric mathematical model; L is the actual gauge length above the horizontal plane; W is the overall gauge width; H is the total gauge length; Y is the measured water level.
3.3 Dictionary learning-based recognition
Dictionary learning is applied to image processing, that is, the dictionary is trained with the target image or an image similar to the target image, and then the trained dictionary is used to process the target image [17]. The following rules are observed during the application: the signal of an image can be well represented by a linear combination of several elements from a set of representative modes; the whole set of representative modes is called a dictionary, and each element is called an atom. Dictionaries provide an effective tool for sparse representation of signals, and open a meaningful way to capture high-level semantics hidden in signals.
To construct a compact but discriminative dictionary suitable for the recognition task, an iterative supervised learning algorithm is called to label the training set. Supervised classification algorithms mainly use 1-norm or 0-norm to realize sparse coding, and usually adopt iterative optimization to handle non-smoothness.
Let $T=\left[t_{1}, t_{2}, \ldots, t_{k}\right] \in \mathbb{R}^{M \times N}$ be the dictionary to learn, where $N$ is a user-defined vocabulary; $M$ is the dimension of each atom; $k$ is the total number of atoms in the dictionary. Suppose the samples are selected from $W$ classes, and $S^{W}=$ $\left[s_{1}^{w}, s_{2}^{w}, \ldots, s_{N^{w}}^{w}\right] \in \mathbb{R}^{M \times N^{w}}$ denotes the training samples of class $w$, where $s_{i}^{w} \in \mathbb{R}^{M \times 1}$ is the $\mathrm{i}$-th sample. Let $X^{W}=$ $\left[x_{1}^{w}, x_{2}^{w}, \ldots, x_{N^{w}}^{w}\right] \in \mathbb{R}^{k \times N^{w}} \quad$ represent the related representation of $S^{W}$ in dictionary. Then, the classical dictionary learning model can be expressed as:
$\min _{T, X} \sum_{w=1}^{W}\left(\left\|S^{W}-T X^{W}\right\|_{F}^{2}+\beta \sum_{i=1}^{N^{w}}\left\|x_{i}^{w}\right\|_{p}\right)$ (6)
where, p-norm is a sparse regularization term belonging to [0, 1]; the first term is the reconstruction error of dictionary T; the second term is sparse regularization with coefficient $\beta$, with the aim to maximize the sparsity of the dictionary. The objective function is minimized such that each sample in S can be well represented as a sparse linear combination of the atoms in the learning dictionary.
After iterative learning, the learned dictionary can represent the testing image, and judge its label. According to the proposed dictionary structure and learning model, the large representation coefficient of a signal to be tested in the whole dictionary should concentrate in the atoms closely related to it. Therefore, this paper proposes a global coding classifier (GCC).
In addition, the signal should also be reconstructed well, if only the atoms of their specific labels and common atoms are used, because the atoms of other specific labels contribute little to its reconstruction. Hence, this paper presents another classifier called local coding classifier (LCC).
For a testing sample w and a learning dictionary T, the representation coefficient without cross suppression can be described as follows, because its label is unknown:
$\widehat{w}=\arg \min _{x}\|w-T x\|_{2}^{2}+\beta\|w\|_{2}^{2}$ (7)
According to the dictionary structure and learning algorithm, if sample w belongs to class c, the large coefficients should concentrate in the atoms and shared classes associated with the label of class c.
The images obtained by the camera are either about water gauge or about water flow. Therefore, the water level recognition algorithm aims to use the dictionary learning method to divide each image into two classes: water gauge and water flow. The water level can be easily calculated by looking for the boundary between the two classes.
Therefore, the water level recognition algorithm can be divided into three steps: First, all training images are transformed into a training matrix W, where each column represents a training sample and corresponds to a class label. Then, matrix W is imported into the dictionary learning model, and the trained dictionary T is obtained through iterative training. Next, the target image is classified into water gauge and water flow by dictionary T, which is compact and discriminatory for water level calculation.
Overall, image preprocessing is implemented through the following steps:
Step 1. Each training image is grayed, turning into a gray image.
Step 2. The region of interest (ROI) is extracted from the water level image, while the other regions are removed.
Step 3. The ROI is classified.
Step 4. The training samples are extracted from each class.
Step 5. Several training samples are synthesized into a training matrix W, and the corresponding class label vector L is obtained.
The dictionary training can be implemented through the following steps:
Step 1. Several training images are processed and converted into gray images.
Step 2. Through a series of preprocessing operation, each training image is transformed into a matrix W, where each column represents a training sample with a specific class label.
Step 3. The training matrix is input into the cross-suppression dictionary learning model, using group regularization, and the discriminative structured dictionary T is obtained through iterative training.
The water level is calculated in the following steps:
Step 1. The test samples are extracted from the testing set.
Step 2. A classifier is called to classify each test sample in the form of column vector, which is extracted from the water level image.
Step 3. The gauge-flow interface is found, yielding the value of pixel water level.
Step 4. The pixel water level is converted to the actual water level.
The proposed Sobel-based recognition algorithm was compared with the dictionary learning-based recognition algorithm on 700 water level images with different water levels, which were taken under natural conditions (Table 1).
Table 1. Comparison of recognition algorithm accuracy
|
Algorithm |
Mean processing time |
Proportion of images with error < 2cm |
Proportion of images with error > 5cm |
|
Sobel-based recognition algorithm |
169ms |
81% |
5% |
|
Dictionary learning-based recognition algorithm |
201ms |
86% |
2% |
As shown in Table 1, the Sobel-based recognition algorithm had a greater error in water level recognition than the dictionary learning-based algorithm. The main reason is that the former is easy to be affected by noise. Under poor illumination conditions, the water level in the test images is vague, which suppresses the detection effect of edge detectors. By contrast, the dictionary learning-based algorithm achieved a relatively small processing error and a relatively short processing time, and thus satisfies user demand for accurate detection of water level in real time.
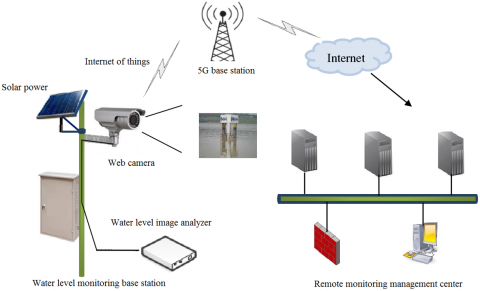
Our intelligent water level monitoring system consists of two parts: water level monitoring base station and remote monitoring management center. The system structure is shown in Figure 3.
The operation process of the system is as follows:
Step 1. The user initializes the system through the web server, which submits the input parameters to the water level image analyzer and web camera.
Step 2. The analyzer completes the initialization of the recognition algorithm.
Step 3. The camera transmits real-time streaming protocol (RTSP) video stream to the analyzer and web server. Then, the analyzer collects, analyzes, and processes the water level image to obtain the current water level. The web server will display the monitoring image in real time.
Step 4. The water level data, along with the field image data, are transmitted back to the web server via the IoT technology. The web server stores and analyzes the data, and enables query, early warning, and real-time display.
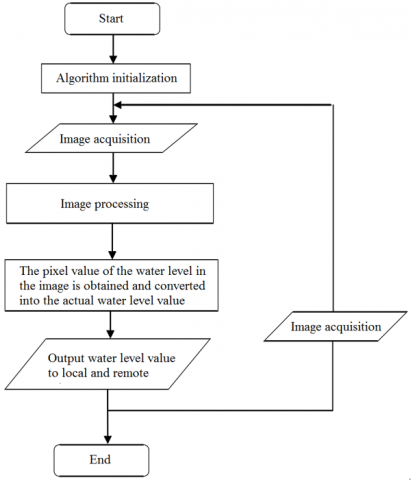
In general, the video collected by the web camera is transmitted to the water level image analyzer, where it is processed in real time to get the measurement results. After that, the water level data are transmitted to the web server through the IoT. The flow of water level image analysis is shown in Figure 4.
Figure 3. Structure of intelligent water level monitoring system
Figure 4. Flow of water level image analysis
Further, the video collected by the camera is transmitted to the water level image analyzer for real-time processing. The dictionary learning algorithm is called to get the measurement results. After that, the water level data are transmitted to the server at a specific time through the IoT. The specific steps are as follows:
Step 1. A measuring pole is fixed in the monitoring area, and the measuring pole and the area near the water surface are captured in real time by the camera.
Step 2. Several images are set as training samples, and classified one by one. Then, a sliding window is adopted to collect training data for each image block, and the corresponding classes are labeled.
Step 3. The training data are trained through dictionary learning, producing a dictionary.
Step 4. The dictionary is used to classify the collected images in real time, and the label vector of each image block is obtained, so as to obtain the water level value.
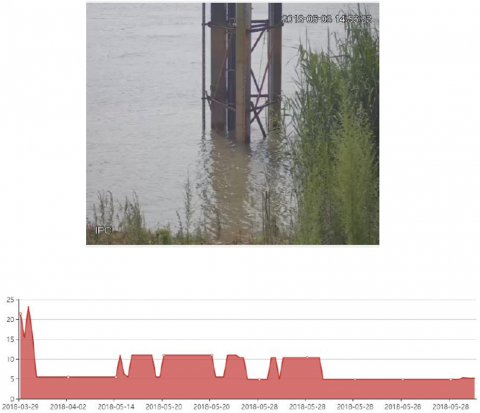
The actual recognition effect of the system is shown in Figure 5.
Figure 5. Historical data of water level at an actual monitoring point
Image recognition-based water level monitoring provides a novel non-contact recognition method for water level. This paper explores the automatic monitoring of water level using images captured in complex environments, and discusses the image recognition technologies related to the water level monitoring system, including video frame extraction, image preprocessing, image enhancement under harsh conditions, image denoising, and image classification, to name but a few. On this basis, the authors examined the key algorithms of water level recognition, and applied the recognition algorithm based on dictionary learning to the water level monitoring system. To facilitate data acquisition and display, this paper develops a remote water level monitoring system, in which the IoT is adopted to acquire, process, recognize, and transmit water level images. The proposed automatic, remote system can obtain the water level with intelligent recognition techniques, and provide data support to the monitoring of water regime.
This paper was supported by the Open Research Fund Program of State key Laboratory of Hydroscience and Engineering of Tsinghua University (Grant No.: sklhse-2020-A-01).
[1] Jekeli, C., Dumrongchai, P. (2003). On monitoring a vertical datum with satellite altimetry and water-level gauge data on large lakes. Journal of Geodesy, 77(7-8): 447-453. http://dx.doi.org/10.1007%2Fs00190-003-0345-2
[2] Zheng, G., Zong, H., Zhuan, X., Wang, L. (2010). High-accuracy surface-perceiving water level gauge with self-calibration for hydrography. IEEE Sensors Journal, 10(12): 1893-1900. https://doi.org/10.1109/JSEN.2010.2050138
[3] Mezikov, A.K., Mezikov, V.K., Khusainov, B.G., Nikiforov, A.I. (1993). Determining the shape of a sensor for a float-type level gauge. Measurement techniques, 36(1): 64-66. https://doi.org/10.1007/BF00986178
[4] Lewandowski, J., Lischeid, G., Nützmann, G. (2009). Drivers of water level fluctuations and hydrological exchange between groundwater and surface water at the lowland River Spree (Germany): field study and statistical analyses. Hydrological Processes: An International Journal, 23(15): 2117-2128. https://doi.org/10.1002/hyp.7277
[5] Matsumoto, K., Sobue, M., Asamoto, K., Nishimura, Y., Abe, S., Numazawa, T. (2011). Capacitive level meter for liquid hydrogen. Cryogenics, 51(2): 114-115. https://doi.org/10.1016/j.cryogenics.2010.11.005
[6] Yuan, C., Gong, P., Bai, Y. (2020). Performance assessment of ICESat-2 laser altimeter data for water-level measurement over lakes and reservoirs in China. Remote Sensing, 12(5): 770. https://doi.org/10.3390/rs12050770
[7] Zijl, F., Verlaan, M., Gerritsen, H. (2013). Improved water-level forecasting for the Northwest European Shelf and North Sea through direct modelling of tide, surge and non-linear interaction. Ocean Dynamics, 63(7): 823-847. https://doi.org/10.1007/s10236-013-0624
[8] Zhang, Z., Zhou, Y., Liu, H., Zhang, L., Wang, H. (2019). Visual measurement of water level under complex illumination conditions. Sensors, 19(19): 4141. https://doi.org/10.3390/s19194141
[9] Ding, S., Qu, S., Xi, Y., Sangaiah, A.K., Wan, S. (2019). Image caption generation with high-level image features. Pattern Recognition Letters, 123: 89-95. https://doi.org/10.1016/j.patrec.2019.03.021
[10] Kim, J., Han, Y., Hahn, H. (2011). Embedded implementation of image-based water-level measurement system. IET Computer Vision, 5(2): 125-133. https://doi.org/10.1049/iet-cvi.2009.0144
[11] Hwung, H.H., Kuo, C.A., Chien, C.H. (2009). Water surface level profile estimation by image analysis with varying overhead camera posture angle. Measurement Science and Technology, 20(7): 075104. http://dx.doi.org/10.1088/0957-0233/20/7/075104
[12] Fleury, G.R.D.O., do Nascimento, D.V., Galvão Filho, A.R., Ribeiro, F.D.S.L., de Carvalho, R.V., Coelho, C.J. (2020). Image-based river water level estimation for redundancy information using deep neural network. Energies, 13(24): 6706. https://doi.org/10.3390/en13246706
[13] Hu, X., Li, X. (2019). Information extraction of subsided cultivated land in high-groundwater-level coal mines based on unmanned aerial vehicle visible bands. Environmental Earth Sciences, 78(14). https://doi.org/10.1007/s12665-019-8417-7
[14] Sun, G., Chen, C.C., Bin, S. (2021). Study of cascading failure in multisubnet composite complex networks. Symmetry, 13(3): 523. https://doi.org/10.3390/sym13030523
[15] Lin, C.Y., Sheu, S.H., Hsu, T.S., Chen, Y.C. (2013). Application of generally weighted moving average method to tracking signal state space model. Expert Systems, 30(5): 429-435. https://doi.org/10.1111/j.1468-0394.2012.00647.x
[16] Bin, S., Sun, G. (2020). Optimal energy resources allocation method of wireless sensor networks for intelligent railway systems. Sensors, 20(2): 482. https://doi.org/10.3390/s20020482
[17] Wang, B., Kong, B., Ding, D., Wang, C., Yang, J. (2017). A novel traffic sign recognition algorithm based on sparse representation and dictionary learning. Journal of Intelligent & Fuzzy Systems, 32(5): 3775-3784. https://doi.org/10.3233/JIFS-169310