Veeranjaneyulu Naralasetti | Reshmi Khadherbhi Shaik | Gayatri Katepalli | Jyostna Devi Bodapati*
© 2021 IIETA. This article is published by IIETA and is licensed under the CC BY 4.0 license (http://creativecommons.org/licenses/by/4.0/).
OPEN ACCESS
Diagnosis based on chest X-rays is widely used and approved for the diagnosis of various diseases such as Pneumonia. Manually screening of theses X-ray images technician or radiologist involves expertise and time consuming. Addressing this, we propose an automated approach for the diagnosis of pneumonia by assisting doctors in spotting infected areas in the X-ray images. We propose a deep Convolutional Neural Network (CNN) model for efficiently detecting the presence of pneumonia in the X-ray images. The proposed CNN is designed with 5 convolution blocks followed by 4 fully connected layers. In order to boost the performance of the model, we incorporate batch normalization, dynamic dropout, learning rate decay, L2 regularization weight decay along with Adam optimizer and binary Cross-Entropy loss function while training the model using back propagating algorithm. The proposed model is validated on two publicly accessible benchmark datasets, and the experimental studies conducted on these datasets indicate that the proposed model is efficient. The suggested CNN architecture with specified hyper parameters allows the model to outperform several existing models by achieving accuracy of 97.73% and 91.17% respectively for binary and multi-class classification tasks of pneumonia disease.
Convolutional Neural Network, Pneumonia Prediction, RELU, Sigmoid, Softmax, Deep Neural Network
Medical X-ray images have been commonly used to diagnose areas of the human body that are vulnerable, such as bones, chest, teeth, skull, etc. For several years, health researchers have been using this method to analyse and envision fractures or anomalies from the body organ pattern. That is because X-beams are efficient diagnostic tools to discover neurotic alterations, regardless of their non-invasive properties and financial factors. A normal medical review by physicians today requires all types of knowledge about patients, but it is very hard for individuals to spend time on these examinations. According to the National Institutes of Health (NIH), chest X-rays are the safest choice for pneumonia examinations. Manual analysis of these X-ray images is highly challenging, requires domain expertise and is therefore time consuming, costly and vulnerable to error. For both physicians and patients, Computer Assisted Diagnostic (CAD) devices for analysing X-ray images would be useful. These CAD programmes can be useful for doctors to gain high-precision inferences from X-ray images. Similarly, by correct diagnosis, patients have high chances of extending their life by detecting the illness in the early stages.
Classical Pneumonia disease Prediction takes into account the factors such as (a) temperature above 37.8 (b) heart rate above 100bpm or (c) crackles/rales or (d) lower breath sounds or (e)Asthma for the identification of the disease. If the patient has more than one of these illnesses, then the patient is suspected to have Pneumonia. But the accuracy of these methods is substantial and predictions based on X-ray images are more efficient when compared to the classical methods. Hence, recent research focuses on various machine learning models for the diagnosis of pneumonia based on X-ray images.
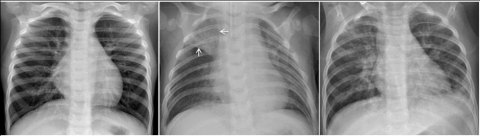
Machine learning models are proven to be more efficient for various real-time tasks like diabetic retinopathy identification, brain tumour recognition, lung disease prediction etc; Inspired by their success, these models are adapted to the pneumonia disease prediction based on X-ray images. In the initial days, usage of traditional machine learning models were quite popular for pneumonia prediction. Shallow models like Support Vector Machines (SVM) and Multi-Layer Perceptron (MLP) shown to be effective for the detection of pneumonia from lung X-ray images. The Support Vector Machine (SVM) is to plot the variation between the Pneumonia effected and the regular chest X–Ray images which are obtained from various clinical reports that are collected by considering the X-ray images (Figures 1 and 2). The Problems related to chest can be diagnosed based on the Machine Learning as well as Deep learning approaches which ultimately gives a final verdict for many apparent chest related problems. In this Paper, the proposed model focuses on the Pneumonia Detection where the Image Pre-processing is done by Histograms for training the Feed Forward Neural Networks.
In conclusion, detection of chest related problems such as infections are been diagnosed by using AI approaches such as Multilayer perceptron, probabilistic models, vector quantization, and recurrence neural networks. The discovery of unceasing obstructive aspiration and pneumonia disorders are updated using neural systems and artificial insusceptible frameworks.
a. Normal b. Bacterial c. Viral
Figure 1. Random sample images of chest
Figure 2. Sample images with pneumonia
Several researchers have recently proposed solutions to artificial intelligence (AI) problems such as CNN which made it possible for researchers to produce meaningful outcomes on a broad range of medical subjects such as the treatment of breast cancer, brain cancer detection, and tumour segmentation, X-ray disease recognition, etc. [1].
In addition to improving signalling and regularising of L2 for pneumonia detection, Jaiswal et al. [2] use the Deep Neural Network Mask-RCNN with its global and local role for the segmentation of the pulmonary signal.
Ge et al. [3] first contributed with the launch of a new ChestX-ray8 dataset containing photographs of 32,717 patients with 108,948 frontal X-rays. Using a deep CNN, they have obtained promising results.
For the use of machine learning methods, predictive pneumonia diagnosis, and the positioning system, Sirazitdinov et al. [4] has been proposed by the researchers. Two neural networks (Retina Net and Mask R-CNN) were developed. This model was implemented on dataset of 26,684 images from the Kaggle Pneumonia Identification Challenge, and findings were satisfactory.
To compare and correlate its performance with the top layer of the following DL architectures (CNN, ReLU, Sigmoid, Softmax Regression function), on analysis and Transfer Learning approach [5-7] the lack of a data set for medical imagery is great.
A deep learning system for the study of lung pneumonia and cancer has been proposed at [8]. Also, two separate techniques of deep education were proposed: the first was updated by Alex Net. Chest X-ray pictures were designed with Vector Machine help to be recognized in regular and pneumonia class and their output validation was done by other pre-trained Neural Networks such as (Alex Net, VGG16, VGG19, and ResNet50). The second was conducted, however, to enhance the precision of evaluations of lung cancer, a combination of hand made and learned features in the Individual. The research [9, 10] presented is a framework that allows the detection of radiological combinations in the chest using deep learning, and especially utilizing the Convolutional Neural Networks.
To improve model accuracy, authors have used the pre-trained Deep Convolutional Neural Network with ImageNetdata [11]. Then a three-step pre-processing technique was introduced to boost the generalization of models.
Roth et al. [12] acknowledged how this set of data could be extended by improving data strength and deliver excellent results, but also to practice on a small picture sample. Shin et al. [13] demonstrated how deep CNN can be used in other studies to classify lymph nodes. They also had positive results even though the Images are not in favour.
Rajpurkar et al. [14] worked on various CNN systems and worked on lymphatic and pulmonary disease problems. Woźniak et al. [15] indicated that CheXNeXt, a 121-layered CNN that detects fourteen different pathologies in the frontal X-rays of the chest, including pneumonia. Originally, neural networks were equipped to predict the likelihood of 14 X-ray abnormalities. A collection of these networks was then used to predict by measuring each network's mean predictions.
A novel PNN training algorithm that would allow us to develop smaller networks is proposed by Gu et al. [16]. A 3D deep CNN and a multi-level prediction system is suggested by Ho and Gwak [17] for the identification of lung nodules using the cube clustering and the multi-level cube estimation. DenseNet-121 was pre-processed by Bodapati et al. [18], as were four types of local characteristics and deep characteristics acquired using the SIFT, GIST, and local binary (LBP) patterns and Aligned Gradient Histogram (HOG) and CNN.
Bodapati and Veeranjaneyulu [19] used the 3D-deep CNN (3D-DCNN) with shortcuts and the thick DCNN 3D, overcome by shortcuts and complex relations to the problem of gradients fall.
Deep neural networks are included to get the characteristics of lung nodules. In the AUC range of 0.94-0.95, the Alex Net and Google Net have been used by Bodapati and Veeranjaneyulu [20] without able to pretrain the model and with better data. An advanced model using a transfer learning and a two-network system was used to achieve the AUC of 0.99.
A natural question emerges when using Deep Learning and image processing, particularly in medical imaging: how do we use this DL, and what is the best DL architecture to use [21]. In the context of the X-ray image classification [22], authors present a comparison of the new Deep Convolutional Neural Network architectures (CNN, ReLU, Sigmoid, Softmax Regression) for fine-tuned automated binary classification models.
Recently, Deep learning (DL) techniques have proved their immense potential through current image recognition and machine vision output. These methods are used to fragment, track, and identify different types of high-performance medical imaging. Other DL procedures on medical imaging include skin cancer identification, breast cancer screening, and evaluation, lung cancer screening etc., Even though these processes have proved to be extremely successful in medical imaging, a huge amount of data is needed which is not yet available in this field.
3.1 CNN architecture
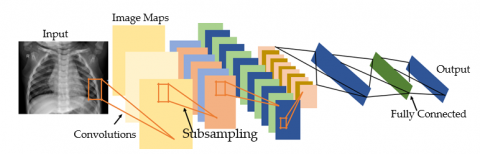
The CNN model typically consists of five layers: an input layer, a convolutional layer, a pooling layer, a fully connected layer, and an output layer (Figure 3). CNN models have been trained to essentially allow the feature extraction and selection, classification part and prediction. Generally where it is difficult to understand how the network is organised and used for processes the images. CNN is well established where the functions that have been used in various layers shows good performance.
3.2 The conceptual architecture of CNN
The very first layer takes an array of images, where the Convolutional operation is performed on the array by just multiplying the weights over inputs and when the filters are applied on the Multidimensional array it is multiplied with the Filters weight set. For each filter, there is a dimension of (kxk) which will be multiplied the image matrix of every channel and for each filter the weights different. For each channel in RGB the filter matrix is multiplied and the summation of the matrix of each element gives the element of a convolved feature.
Now after the images are convolved pooling operation is performed for dimensionality reduction of the convolved feature (Figure 4). After the pooling the array will be connected to the FC layer which is mainly responsible for the producing outputs from the features.
3.3 Enhanced data and transfer learning
Deep learning takes huge amount of data to produce an accurate result. Nevertheless, certain issues might not be considered for adequate evidence. Particularly on medical concerns, the data collection and documentation are very time-consuming and costly. There are different methodologies on images such as rotating them, zooming, pivoting etc., A method is implemented to improve performance on deep learning models, particularly in CNNs which is known as transfer learning. Transfer learning is the concept of changing the Deep learning model by applying similar methodology of other neural networks which will be able to gain and learn the important features and characteristics which will be able to produce a great performance on similar problems related to the model, instead of creating a CNN from scratch it is better to prefer a pre-trained CNNs on very broad datasets like Image Net comprising 1.2 million images and 1000 groups. There are three common methods to pass learning strategies on CNNs. For this analysis, we used an approach to finetune which is inspired by the observation of most common features including borders, colours, and blobs which will be given to early layers of CNNs. This layer would also be beneficial for several other activities. Precisely the last layers have more data characteristics compared to previous layers. We also set several early layers of our models and finetune the model except the predefined layers.
CNN's are a crucial cause of deep learning where an increasingly complex paradigm drives the creation of human-made knowledge by providing structures that mimic different forms of organic human brain behavior. A convolutional neural network contains an input and output layer as well as hidden layers. As in various types of Misclassified neural networks, a complicated neural network has an input layer, an output layer, and several hidden layers. Many of these layers are convolutional, utilizing a mathematical paradigm to offer progressive layers performance. It re-enacts part of the human visual cortex. This can be alluded to as a deep learning process, directed at learning, to break up knowledge. CNN's refer to the administration of images, the planning of characteristic vocabulary, and the different forms of intellectual enterprises.
Figure 3. Architecture of CNN
Figure 4. Convolutional structure
The CNNs comparatively have an edge over DNNs with a visual preparedness of plan which is identical to people and which incredibly improves the structure for images, 2D and 3D forms. The max pool layer of the convolutional neural network is strongly suited for fiddle assimilations and contains insufficient associations of attached loads. CNN's have an impressively smaller boundary measure when they are contrasted and connected to fully related (FC) systems of the same size. Slope-based learning approaches are used above all to plan CNNs architecture and are less inclined to decrease the angle problem. Because the angle measurement is responsible to prepare the whole framework to effectively minimize an error pattern. The proposed CNN architecture is built with 5 Convolutional blocks with max pooling and Standard batch Normalisation which are flattened with 4 fully connected layers with ReLU activation to reduce the problem of overfitting dropouts are used. Sigmoid activation is used at the last layer for Binary Classification with a cross–entropy function which is optimized by Adam.
The Softmax is a logistic regression that normalizes an input value to a vector following probability distribution. The performance values lie in the [0,1] range, which is good since we can get rid of binary labelling.
$\operatorname{Sigmoid}(x)=1 /\left(1+\exp ^{-x}\right)$
A sigmoid function is a mathematical equation of a standard "S" curve or sigmoid curve. The logistic function seen in the figure and described by the formula is a typical illustration of a sigmoid feature.
ReLU is a form of activation feature and stands for a straightened linear unit. It is known mathematically as y=max(0, x).
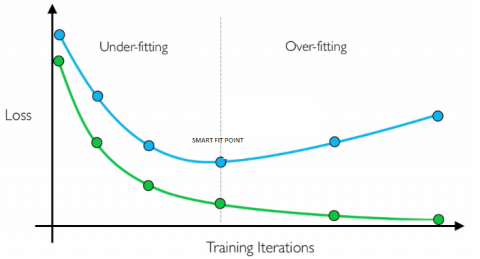
Where the model receives information such as noise from the training data, the regression reduces the degree that the output of the model is influenced by new data. In compliance with this definition, it refers that method that cannot estimate training data or generalize new data.
Since underfitting problem occurs on machine learning model is not suitable appropriate approach which gives a poor performance over train data.
The smart fit (Figure 5) is the point right before the error approximations in the test starts to rise, as both the testing dataset and the invisible test dataset are well-trained.
Figure 5. Fit model
This work uses accuracy, precision, recall, F1-score, AUC, sensitivity, and specificity as the performance evaluation metrices. These metrics are based on four terms, i.e., True Positive (TP), False Positive (FP), True Negative (TN), and False Negative (FN). TP refers to patients that have a disease and the test is positive while FP are those patients who do not have the disease but the test is positive. Similarly, TN refers to those patients who do not have the disease and the test is negative and FN are the patients with disease but the test is negative.
Figure 6. Confusion matrix
A confusion matrix is a synopsis of the prediction based on the algorithm that are chosen. The number of appropriate and insufficient plots which represents two groups, 1. Positive and 2. Negative. This becomes centre to the uncertainty matrix. The uncertainty matrix demonstrates how the proposed algorithm becomes puzzled as projections and forecasts are made. It (Figure 6) provides us a summary of not only the errors that a classifier produces but also the forms of errors such as type-1 and type-2.
Depending on the Confusion Matrix, the metric calculations are as follows:
Accuracy $=\frac{\mathrm{TP}+\mathrm{TN}}{\mathrm{TP}+\mathrm{FN}+\mathrm{TN}+\mathrm{FP}}$
Sensitivity $=\frac{\mathrm{TP}}{\mathrm{TP}+\mathrm{FN}}$
Specificity $=\frac{\mathrm{TN}}{\mathrm{TN}+\mathrm{FP}}$
Precision $=\frac{\mathrm{TP}}{\mathrm{TP}+\mathrm{FP}}$
Recall $=\frac{\mathrm{TP}}{\mathrm{TP}+\mathrm{FN}}$
F1_Score $=2 * \frac{\text { Precision } * \text { Recall }}{\text { Precision }+\text { Recall }}$
Here we separate data into two types: 1) discrete data and 2) categorical data. For our experiment, the total number of trainable parameters for binary data is 813,088, and for categorical data 813,475. We executed our dataset for 400 epochs using sigmoid and SoftMax for binary and categorical data. For binary data we got an accuracy of 97.73% and for categorical 97.17%. The below graph shows the results of both binary and multiclass classifications. The results obtained during the experimental analysis are shown in Table 1 and Table 2. Figure 7 and Figure 8 represents the Precision and recall values for both binary data and multiclass model.
Table 1. Performance results of binary classification
|
Batch size |
No.of epochs |
Loss |
Val_Loss |
Accuracy |
Val_Accuracy |
|
32 |
100 |
0.6844 |
0.7556 |
0.4644 |
0.4617 |
|
200 |
0.5628 |
0.6245 |
0.9044 |
0.8156 |
|
|
300 |
0.5118 |
0.5434 |
0.9146 |
0.8898 |
|
|
400 |
0.4852 |
0.5185 |
0.9257 |
0.9224 |
|
|
64 |
100 |
0.6974 |
0.7696 |
0.4884 |
0.4707 |
|
200 |
0.5628 |
0.6245 |
0.9244 |
0.8356 |
|
|
300 |
0.5217 |
0.5333 |
0.9234 |
0.9197 |
|
|
400 |
0.4962 |
0.5235 |
0.9267 |
0.9394 |
|
|
128 |
100 |
0.6924 |
0.7676 |
0.4764 |
0.4697 |
|
200 |
0.5758 |
0.6645 |
0.9344 |
0.8256 |
|
|
300 |
0.5417 |
0.5532 |
0.9668 |
0.9497 |
|
|
400 |
0.4752 |
0.5085 |
0.9773 |
0.9703 |
Table 2. Performance results of multi-value classification
|
Batch size |
No.of epochs |
Loss |
Val_Loss |
Accuracy |
Val_Accuracy |
|
32 |
100 |
0.6964 |
0.7686 |
0.4784 |
0.4747 |
|
200 |
0.5748 |
0.6375 |
0.9184 |
0.8286 |
|
|
300 |
0.5238 |
0.5564 |
0.9286 |
0.9028 |
|
|
400 |
0.4972 |
0.5315 |
0.9397 |
0.9354 |
|
|
64 |
100 |
0.7094 |
0.7826 |
0.5024 |
0.4837 |
|
200 |
0.5748 |
0.6375 |
0.9384 |
0.8486 |
|
|
300 |
0.5337 |
0.5463 |
0.9374 |
0.9327 |
|
|
400 |
0.5082 |
0.5365 |
0.9407 |
0.9524 |
|
|
128 |
100 |
0.7044 |
0.7806 |
0.4904 |
0.4827 |
|
200 |
0.5878 |
0.6775 |
0.9484 |
0.8386 |
|
|
300 |
0.5537 |
0.5662 |
0.9808 |
0.9627 |
|
|
400 |
0.4952 |
0.5315 |
0.9717 |
0.9691 |
Figure 7. Precision and failure of the model for binary data
Figure 8. Performance and degradation of multiclass model
This study aims at developing an efficient model for detecting pneumonia from X-ray images and the same has been accomplished with the proposed CNN architecture. In comparison to the existing models for pneumonia classification, the suggested architectural differences introduced in the proposed CNN offers a robust model. From the results of our experimental studies on the benchmark dataset, we conclude that parameter tuning is very critical for the success of a CNN model. Especially, model regularization methods such as batch normalization, dynamic dropout, learning rate decay, kernel regularization weight decay avoids model over-fitting and enhances performance. The proposed model exhibits improved performance over existing models for the classification of pneumonia by achieving 97.73% and 97.17% accuracy respectively for binary and multi-class cases.
[1] Liang, G., Zeng, L. (2020). A transfer learning method with deep residual network for pediatric pneumonia diagnosis. Computer Methods and Programs in Biomedicine, 187: 104964. https://doi.org/10.1016/j.cmpb.2019.06.023
[2] Jaiswal, A.K., Tiwari, P., Kumar, S., Gupta, D., Khanna, A., Rodrigues, J.J.P.C. (2019). Identifying pneumonia in chest X-rays: A deep learning approach. Measurement, 145: 511-518. https://doi.org/10.1016/j.measurement.2019.05.076
[3] Ge, Y., Wang, Q., Wang, L., Wu, H., Peng, C., Wang, J., Xu, Y., Xiong, G., Zhang, Y., Yi, Y. (2019). Predicting post-stroke pneumonia using deep neural network approaches. International Journal of Medical Informatics, 132: 103986. https://doi.org/10.1016/j.ijmedinf.2019.103986
[4] Sirazitdinov, I., Kholiavchenko, M., Mustafaev, T., Yuan, Y., Kuleev, R., Ibragimov, B. (2019). Deep neural networkensemble for pneumonia localization from a large-scale chest x-ray database. Computers & Electrical Engineering, 78: 388-399. https://doi.org/10.1016/j.compeleceng.2019.08.004
[5] Bhandary, A., Prabhu, G.A., Rajinikanth, V., Thanaraj, K.P., Satapathy, S.C., Robbins, D.E., Shasky, C., Zhang, Y.D., Tavares, J.M.R.S., Raja, N.S.M. (2020). Deep-learning framework to detect lung abnormality - a study with chest X-Ray and lung CT scan images. Pattern Recognition Letters, 129: 271-278. https://doi.org/10.1016/j.patrec.2019.11.013
[6] Dondeti, V., Bodapati, J.D., Shareef, S.N., Naralasetti, V. (2020). Deep convolution features in non-linear embedding space for fundus image classification. Revue d'Intelligence Artificielle, 34(3): 307-313. https://doi.org/10.18280/ria.340308
[7] Zhang, Q., Wang, H., Yoon, S.W., Won, D., Srihari, K. (2019). Lung nodule diagnosis on 3D computed tomography images using deep convolutional neural networks. Procedia Manufacturing, 39: 363-370. https://doi.org/10.1016/j.promfg.2020.01.375
[8] Bodapati, J.D., Veeranjaneyulu, N. (2019). Feature extraction and classification using deep convolutional neural networks. Journal of Cyber Security and Mobility, 8(2): 261-276. https://doi.org/10.13052/jcsm2245-1439.825
[9] Kallianos, K., Mongan, J., Antani, S., Henry, T., Taylor, A., Abuya, J., Kohli, M. (2019). How far have we come? Artificial intelligence for chest radiograph interpretation. Clinical Radiology, 74(5): 338-345. https://doi.org/10.1016/j.crad.2018.12.015
[10] Wang, X., Peng, Y., Lu, L., Lu, Z., Bagheri, M., Summers, R.M. (2017). Chestx-ray8: Hospital scale chest x-ray database and benchmarks on weakly-supervised classification and localization of common thorax diseases. 2017 IEEE Conference on Computer Vision and Pattern Recognition (CVPR), pp. 3462-3471. https://doi.org/10.1109/CVPR.2017.369
[11] Ronneberger, O., Fischer, P., Brox, T. (2015). U-Net: Convolutional networks for biomedical image segmentation. In: Navab N., Hornegger J., Wells W., Frangi A. (eds) Medical Image Computing and Computer-Assisted Intervention – MICCAI 2015. MICCAI 2015. Lecture Notes in Computer Science, vol 9351. Springer, Cham. https://doi.org/10.1007/978-3-319-24574-4_28
[12] Roth, H.R., Lu, L., Seff, A., Cherry, K.M., Hoffman, J., Wang, S., Liu, J., Turkbey, E., Summers, R.M. (2014). A new 2.5D representation for lymph node detection using random sets of deep convolutional neural network observations. In: Golland P., Hata N., Barillot C., Hornegger J., Howe R. (eds) Medical Image Computing and Computer-Assisted Intervention – MICCAI 2014. MICCAI 2014. Lecture Notes in Computer Science, vol 8673. Springer, Cham. https://doi.org/10.1007/978-3-319-10404-1_65
[13] Shin, H.C., Roth, H.R., Gao, M., Lu, L., Xu, Z., Nogues, I., Yao, J., Mollura, D., Summers, R.M. (2016). Deep convolutional neural networks for computer-aided detection: CNN architectures, dataset characteristics and transfer learning. IEEE Transactions on Medical Imaging, 35(5): 1285-1298. https://doi.org/10.1109/TMI.2016.2528162
[14] Rajpurkar, P., Irvin, J., Ball, R.L., Zhu, K., Yang, B., Mehta, H., Duan, T., Ding, D., Bagul, A., Langlotz, C.P., Patel, B.N., Yeom, K.W., Shpanskaya, K., Blanenberg, F.G., Seekins, J., Amrhein, T.J., Mong, D.A., Halabi, S.S., Zucker, E.J., Ng, A.Y., Lungren, M.P. (2018). Deep learning for chest radiograph diagnosis: A retrospective comparison of the CheXNeXt algorithm to practicing radiologists. PLoS Medicine, 15: e1002686. https://doi.org/10.1371/journal.pmed.1002686
[15] Woźniak, M., Połap, D., Capizzi, G., Sciuto, G.L., Kośmider, L., Frankiewicz, K. (2018). Small lung nodules detectionbased on local variance analysis and probabilistic neural network. Computer Methods and Programs in Biomedicine, 161: 173-180. https://doi.org/10.1016/j.cmpb.2018.04.025
[16] Gu, Y., Lu, X., Yang, L., Zhang, B., Yu, D., Zhao, Y., Gao, L., Wu, L., Zhou, T. (2018). Automatic lung nodule detection using a 3D deep convolutional neural network combined with a multi-scale prediction strategy in chest CTs. Computer in Biology and Medicine, 103: 220-231. https://doi.org/10.1016/j.compbiomed.2018.10.011
[17] Ho, T.K.K., Gwak, J. (2019). Multiple feature integration for classification of thoracic disease in chest radiography. Applied Sciences, 9(19): 4130. https://doi.org/10.3390/app9194130
[18] Bodapati, J.D., Naralasetti, V., Shareef, S.N., Hakak, S., Bilal, M., Maddikunta, P.K.R., Jo, O. (2020). Blended multi-modal deep ConvNet features for diabetic retinopathy severity prediction. Electronics, 9(6): 914. https://doi.org/10.3390/electronics9060914
[19] Bodapati, J.D., Veeranjaneyulu, N. (2017). Abnormal network traffic detection using support vector data description. In: Satapathy S., Bhateja V., Udgata S., Pattnaik P. (eds) Proceedings of the 5th International Conference on Frontiers in Intelligent Computing: Theory and Applications. Advances in Intelligent Systems and Computing, vol 515. Springer, Singapore. https://doi.org/10.1007/978-981-10-3153-3_49
[20] Bodapati, J.D., Veeranjaneyulu, N. (2016). Performance of different classifiers in non-linear subspace. 2016 International Conference on Signal and Information Processing (IConSIP), pp. 1-4. https://doi.org/10.1109/ICONSIP.2016.7857483
[21] Veeranjaneyulu, N., Bodapati, J.D. (2014). Scene classification using support vector machines with LDA. Journal of Theoretical and Applied Information Technology, 63: 741.
[22] Kancherla, D., Bodapati, J.D., Veeranjaneyulu, N. (2019). Effect of different kernels on the performance of an SVM based classification. Int. J. Recent Technol. Eng., 5: 1-6.