Akhilesh Verma* | Vijay Kumar Gupta | Savita Goel | Akbar | Arun Kumar Yadav | Divakar Yadav
© 2021 IIETA. This article is published by IIETA and is licensed under the CC BY 4.0 license (http://creativecommons.org/licenses/by/4.0/).
OPEN ACCESS
A self-learning, secure and independent open-set solution is essential to be explored to characterise the liveness of fingerprint presentation. Fingerprint spoof presentation classified as live (a Type-I error) is a major problem in a high-security establishment. Type-I error are manifestation of small number of spoof sample. We propose to use only live sample to overcome above challenge. We put forward an adaptive ‘fingerprint presentation attack detection’ (FPAD) scheme using interpretation of live sample. It requires initial high-quality live fingerprint sample of the concerned person. It uses six different image quality metrics as a transient attribute from each live sample and record it as ‘Transient Liveness Factor’ (TLF). Our study also proposes to apply fusion rule to validate scheme with three outlier detection algorithms, one-class support vector machine (SVM), isolation forest and local outlier factor. Proposed study got phenomenal accuracy of 100% in terms of spoof detection, which is an open-set method. Further, this study proposes and discuss open issues on person specific spoof detection on cloud-based solutions.
transient liveness factor (TLF), presentation attack detection (PAD), open-set approach
Identification of a live fingerprint image is a major challenge nowadays. Earlier researchers proposed approaches on spoof detection using close-set methods. These methods bound them to fail under a certain condition. One of limitation is presence of Type-I error, spoof classified as live, which is not good for critical system. In recent history, FPAD implementation came out in a variety of the form. Reported studies suggest a threefold increase in the error rates of fingerprint spoof detectors when spoofs using new materials come during the testing or operational stage. This means the generalization capability of existing fingerprint spoof detectors is limited across materials.
Conventional approach learns a few spoof and live samples, a dataset limitation. All the spoof detection proposals in the studies [1-4] works fine in test condition. Often, investigators focus on designing a testbed to show the ‘spoof’ detection. System in form testbed is specific or work under constraint condition. Several challenges as described in the study [5] mentions a detailed explanation of these conditions. Recent progress in FPAD resolution introduces the open-set solution which is not susceptible to the small sample size [6-10]. In this approach, the training sample volume is scaled up, so the unseen condition is identified with a greater probability by turning down the null hypothesis. The ways of detecting spoof are getting better day by day. The primary goal of our present work is to expand the existing work [11], that talks about transient liveness factor, the last two sections describe a prototype based on it.
Our inspiration for this work extends from usage and penetration to fingerprint based biometric systems. Among all the biometrics accepted so far, fingerprints are in use because of its uniqueness. Fingerprint helps to establish authenticity of the person. Fingerprint based authentication are susceptible to presentation attack, so many users do not use it for critical applications like a bank vault. It is imperative to establish these attacks to diminish the risks of perception loss in the biometric market, Is it trustworthy to rely on FPADs?
A consistent effort by the researchers towards the liveness mitigation process shows a trend "Acceptance of a biometric-based authentication" the popularity is rising. Without mitigation process, the growth as conceived below may not build-up, we expect many newer forms of applications that may soon become a reality. It is possible Facebook and the Twitter post may get authenticated with fingerprint biometric. Social media access to a user via biometric, even comments, tweets, likes, sharing of multimedia may require biometric authentication. The user will trust content, which is spoof proof. Micro-banking application for fund collection, cash handling based on biometrics. Federated ID [12], a system for interlinking of related biometric systems for a worldwide operation like a virtual passport can be a reality soon. Following two subsection outline efforts of the researcher aiming for the fingerprint presentation attack detection.
This section sums up related work in two parts, close-set and open-set approach to spoof detection. The purpose here is to acknowledge past practices. Other than this we wish to understand chronology in action, Intentions of past work and the opportunity for future.
2.1 FPAD in close-set scenario, a conservative approach
Handling fingerprint presentation attack in close-set scenario identifies the following problem areas [5] in the current spoof detection paradigm:
(1) Non-uniform evaluation scheme for performance measures of FPAD-system.
(2) FPAD-system works in specific condition & depends on external factor.
A. Sensor variation.
B. Spoof-Material variation.
C. Limited-Universe of Dataset
(3) Limited scope and constraint mitigation approach.
We can see the FPAD solution improves every year in comparison of previous year benchmark, which further motivates developers to propose an improved solution in subsequent years. Many researchers are working in this broad area, several good publications coming every year. These trends improve confidence and reflect researcher interest in this problem area. But generalization capability and reproducible results were missing in the past causes interoperability issues.
A large-scale empirical study in the work of Ref. [13, 14] highlights interoperability issues. We often use biometric systems in supervisory, defense services and financial/civilian operations. There is a variety of sensors and matching algorithms available from various vendors. This makes up an aggressive market for these products, which is suitable for the users but shows the relevance of interoperability. Interoperability is the capacity of a biometric system to deal with changes introduced in the biometric sample because of various capture mechanisms. Using various biometric devices may increase failure percentages. It shows the extensive-scale experimental investigation of the condition of interoperability between fingerprint sensors and determines the performance effect when interoperability countermeasure is lacking.
The research community still cannot define a more general FPAD system. There are lots of many generalization attributes that hampers FPAD implementation. We may use one broad generalization; PAD applies across boundaries of Geographical/Political/ Individual beliefs. On the same line, the PAD system expects to work on different hardware conditions too. Most of the techniques having anti-spoofing capability do not perform well with generalization and robustness across geographical boundaries. So, Anjos et al. [15] propound the need for an open-source platform for testing and reporting FPAD. As per them, it is difficult to reproduce results too. Many researchers often overlook this requirement, or rather address it in an optimistic and in biased manner. Natural complications of R&D ‘research and development’ as discussed in the study [16] a probable reason behind such a gap in breakthrough solutions. Other essential reasons are, biometric data is private and protected data in the public domain, so hard to get sample; software frameworks difficult to install and maintain; an extensive set of intricate steps in the test protocol difficult to handle.
In a nutshell, underlying constraint includes research complexity, lack of the universe of data for testing, reproducible results and generalization requirement. If we survey the above discussion in deep, the researcher is working on ‘How to Do’ without addressing ‘What to Do’. We can ask a research question ‘Is it possible to model liveness’, if yes, what to do next. Shift our focus, it is better to identify presentation attack using liveness factors instead of spoof characterization. To generalize the PAD model, learning spoof samples may not be a good idea. Before we propose our approach, how to deal with fingerprint attack detection in its most innate ‘Well formed, organized, natural’ way, it is important to look FAPD approaches in open-set environment. Next subsection summarizes efforts of researchers and issues left by them while handling FPAD in a more liberal way.
2.2 FPAD in open-set scenario, a liberal approach
The need for generalized liveness detection model arises because of very few independent results that are available and out of which largely self-declared [17] in close-set FPAD system. Hence, it is difficult to deploy large scale and wide area based biometric authentication systems integrated with liveness detector. So, it is now time to implement the FPAD algorithm over and above testbed system that works in specific conditions. A FAPD system is a must and integral part within an authentication system. It is generalizing enough as a system and reproduces result too. Thus, we may not argue over which spoof pattern classification technique is best, we focus on a wider context of spoof detection that are universal.
Classification of spoof sample as a live sample, a false positive (FP) response is due to lack of a wider context which is always missing in close-set scenario. These are the recognition problem where full knowledge of spoof and live samples are limited (~2000-4000 sample), at the time of training. If we test this model with a known sample using various cross-validation approaches it give the best results as an average classification error ‘ACE’ of (~3) [18]. On a complementary course to generalize a PAD operation, in an open-set implementation, there is requirements for every type of representative dataset, which may not be a great idea. On contrary, the earlier methods proposed under close-set approach succumbed on a limited dataset, weak to detect unknown sample. In recent past, the world is now opening up, biometrics are being used in many organizations and many applications. Which is why many efforts are being made to create an open set solution. This section summaries them and conclude its limitation.
In case of capable intruders, a new fake sample presented to the sensor is always there. The work by argued that one cannot set our aim to model the fake samples in totality. With two reasons, first-fake sample are available in limited numbers to get them train and we do not know it beforehand [19]. So, they proposed a semi-supervised approach for live samples. The work by Kho et al. [20] propounded the identical scheme handle this obstacle, they come up with an existing spoof detector that should learn in steps to sustain this problem. A strong observation by Evans et al. [21] emphasized that the research community had taken one step forward to develop generalized countermeasure approach, but two-step backwards in terms of data homogeneity and reproducible research. So, the need for a de facto standard on datasets, metrics and protocols for spoof detection is a must and still missing. A recent survey by Galbally et al. [22] has also addressed a generalized approach to counter liveness detection. They enlisted with an example of how to design, develop and validate FPAD approaches based on benchmarks and what should be a systematic and replicable protocol.
There is an increasing number of investigations that apply the Convolutional Neural Network (CNN) in recent past [8], [23-26]. CNN based approach has high categorization performance for detecting fake fingerprints with best results in known material as average classification error of 0.25 [9]. But, for unknown-material and cross-sensor data-set CNN approach fallen on the classification error. Apart from the above performance variance, CNN has following accompanying issues in past for fake fingerprint detection approach. CNN model learns parameter from images of all kinds through a pre-trained network. Thus, parameters tuned here cannot be considered as optimized parameters for fake fingerprint detection. They give most of the concentration on increasing classification performance rather than looking at the size of data-set while training the model. Many investigations [27, 28] have shown that improved performance is attained when a deeper and wider network is used. But, when examining the expandability FPAD technique, the model must incorporate only narrow parameters so it can run in a slow machine. Further, many pre-processing steps such as cropping, segmentation, resize of the input image before applying it to CNN, thus an FPAD through a CNN cannot be proposed in generalization and with isolation.
One of the earliest citations of learning liveness is available in Refs. [29-32] which argues “Behavioral biometrics for active authentication program” that can learn and adapt over a period. Behavioral biometrics attributed for liveness aspect. In a work by [10] showed the feasibility of an optimized Android app for FPAD that can run on the smartphone which can predict PA ‘presentation attack’ in less than 300 milliseconds. A patented and commercial solution by Systems [33] performs user authentication with PAD as a service. As claimed, it has security, easy-to-install, easy-to-use, add biometrics anywhere like feature. Even though private firms are using it in a close organization, so they bound the user to use it. But an expansion of the solution in the public domain has less acceptance. So, it cannot be accepted as it is. It will create opposition as similar to ‘Unique Identification Authority of India’ AADHAR project [34] row in India, even though the private sector is using the above solution under their service condition. This public acceptance is still missing in biometric solution because of the lack of liveness solutions universality. Another solution by Aware et al. [35] is a biometric solution, available as cloud-based software-as-a-service (SaaS). They design it to deliver a useful functionality and powerful biometric matching performance, without requiring integration and configuration. Work by Talreja et al. [36] showed a cloud-based model for platform-as-a-service that enables the recognition. Above three examples are enough to motivate us to architect a liveness detection model as service.
The solution as a service has several advantages, it is easy to update algorithm, we can mature varying algorithm(s) of liveness detection in incremental conditions, thus the developer gets motivated for continuous innovation. We may link developer’s motivation to acceptance of an algorithm as a social contribution or some rewards. This architecture has shown its feasibility as a case study based on recognition problem, so applicable for liveness services too. Interoperability issue that deals with generalization capability and reproducible results are missing in the conventional approach.
With the steady advancement of attack modes, the attacks come in ‘realistic-looking’ and ‘End-less variety’ form known as fake fingerprint presentations. Unlike the existing schemes, the study uses person-specific live sample to extract liveness feature. The live-sample has inherent liveness feature, with multiple live sample collected during enrollment or over a period, undergoes for measuring liveness aspects of each finger, calling it as ‘Transient Live Feature’. To establish the fingerprint PAD system to be more authentic, many live fingerprint samples will perform better.
This task is imperative, and it is one of the most significant contributions of this work, people in the fingerprint PAD community can exploit it. With these collected data of liveness known as ‘Transient Liveness Factor’ (TLF), a simple model developed and showed that it can predict the presence or absence of an attack on a test image. Here, the liveness characteristics of the different live samples of an individual are taken from the standard data-set, several sets of independent properties are measured, finally these features are correlated with traditional machine learning approaches.
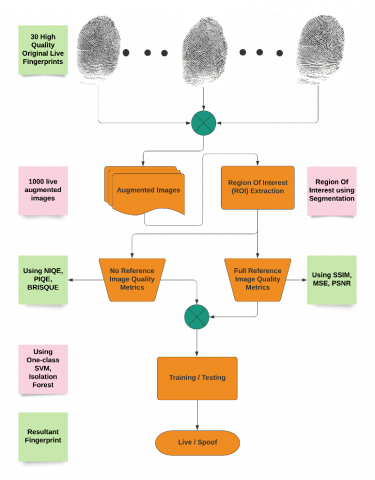
To understand our scheme from the implementation point of view let us check it using algorithms and flowchart of proposed method, see Algorithm-1, 2, and Figure 1.
Figure 1. Flowchart for proposed FPAD scheme using TLF
3.1 Training phase
We take 30 live images in first step from a person. In step-2 we convert these 30 high quality images to 1000 images so we could train our model in a better way as 30 samples are less for a model to work and may lead to over fitting of the data and it is also not possible for us to take 1000 live images of a person, hence augmentation of these 30 images to form 1000 is the best way possible. Here we have done augmentation of images by performing image shifting like vertical shift, horizontal shift, adding noise in varied amounts, blurring the image to an extent and warp shift. This completes the process of augmentation of image.
In Step 3, we create an image set which contains the 800 images with which we need to train our model. In Step 4, we create an empty matrix of zeros to store the values of different referential and non-referential image quality metrics. Step 5 is for taking a reference image for our different referential metrics to compare. Here we have taken a simple white image for calculating the referential values. As the white images provide the best way of comparison of the metrics. Step 6 is the main feature extraction phase. Here we are extracting the different image quality metrics of the images and storing it in the matrix A. To do this we loop over all the 800 images. First step is to extract the region of interest of the image. Then we calculate the ‘Perception based Image Quality Evaluator’ PIQE, ‘Naturalness Image Quality Evaluator’ NIQE and ‘Blind/Reference less Image Spatial Quality Evaluator’ BRISQUE value of images. To do this we are using the built-in models of MATLAB. Next, we calculate the three referential image quality metrics which are ‘Mean-squared error’ IMMSE, ‘Peak Signal-to-Noise Ratio’ PSNR and ‘Structural similarity index’ SSIM, using the built-in functions of MATLAB, only difference being that this time we require to pass a reference image too for calculation purposes. After we get these scores, we write it to the matrix A. More information about these metrics discussed in Table 1 as given below. Results are stored with comma-separated values, in a CSV file.
|
Algorithm 1: |
Training Algorithm |
|
|
Step 1: |
Take as input 30 high quality Live Fingerprints of an image. |
|
|
Step 2: |
Augment these images to create 1000 live images from these 30 images using functions like flipping image, rotating image, adding noise, warp shifting etc. |
|
|
Step 3: |
imageSet = Set of 800 augmented images. Rest 200 are used for testing purposes. |
|
|
Step 4: |
A= zeros(800,6); |
|
|
Step 5: |
referenceImage = A simple image with full white background. |
|
|
Step 6: |
for i = 1 to 800: |
|
|
|
ROI = Find ROI of imageSet(i); |
|
|
|
A(i,1) = piqe(ROI); |
|
|
|
A(i,2) = niqe(ROI); |
|
|
|
A(i,3) = brisque(ROI); |
|
|
|
A(i,4) = immse(ROI,referenceImage); |
|
|
|
A(i,5) = psnr(ROI,referenceImage); |
|
|
|
A(i,6) = ssim(ROI,referenceImage); |
|
|
|
end for |
|
|
Step 7: |
writematrix(A,data.csv); |
|
|
Step 8: |
data = read_csv(‘data.csv’); |
|
|
Step 9: |
svmModel = OneClassSVM(); |
|
|
|
isoationForestModel = IsolationForest(); |
|
|
|
lofModel = LocalOutlierFactor(); |
|
|
Step 10: |
svmModel.fit(data); /* in Python */ |
|
|
|
isoationForestModel.fit(data); |
|
|
|
lofModel.fit(data); |
|
Table 1. Image quality metrics (model available in MATLAB)
|
Metrics |
Description |
|
PIQE: |
It stands for perception-based image quality evaluator. The PIQE algorithm is opinion-unaware and unsupervised algorithm, which means it does not require a trained model. It calculates a block-wise distortion and measures the local variance of perceptibly distorted blocks to compute the quality score. |
|
NIQE: |
It stands for naturalness image quality evaluator. The model can measure the quality of images with arbitrary distortion. It is opinion unaware and does not use subjective quality scores. It calculates the naturalness content of an image based on a pre-trained model of MATLAB trained on pristine images. |
|
BRISQUE: |
Blind / reference less image spatial quality evaluator. It is an opinion aware model trained on a dataset of images with known distortion. Subjective quality scores accompany the training images. Return a score about the presence of distortion in images. |
|
MSE: |
It stands for the mean square error. It is calculated between two images. It is the average squared difference between the pixel values of two images. |
|
PSNR: |
It stands for peak signal to noise ratio. It is a derived version of mean square error and indicates the ratio of the maximum pixel intensity to the power of the distortion |
|
SSIM: |
It stands for the structural similarity index metric. It combines local image structure, luminance, and contrast into a single local quality score. In this metric, structures are patterns of pixel intensities, especially among neighbouring pixels, after normalizing for luminance and contrast. |
The Step 1 to Step 7 of the Algorithm are coded and run on an online MATLAB R2020a version. The Step 8 to Step 10 are done on Python v3.8. The machine learning part is done in Python and the Image Processing and feature extraction on MATLAB. In Step 8, we read our comma separated value in python to train our models. In Step 9, we create three types of model for our training purposes. The models we create here are one class SVM, isolation forest and local outlier factor. A fusion rule with these three predictions is used for the testing purposes. In evaluation phase we focus on how much accurately our model is able to predict spoof as spoof. As spoof sample should not be labelled as live while some cases of live called as spoof is acceptable. In this case person can try again to give his fingerprint, and the concerned authorities can check for foul play. Testing of our model is done on spoof samples.
3.2 Testing phase
In Step 1, we take the image which is to be evaluated by or model. Step 2 we are taking the reference image as same, a white image, for calculating the referential parameters. Step 3 finds the ROI of the evaluating image. Step 4 we create an array to store the values of different parameters for the prediction purpose. In Step 5 we calculate the metric values and store it in the array. In Step 6 the values of the models for the evaluatingImage is returned. The returned value is ‘1’ if the evaluatingImage belongs to the trained model and ‘-1’ if it is an outlier to the model. Thus, ‘1’ means that the model says that, the image evaluated is ‘Live’ and ‘-1’ means ‘Spoof’. We can do this task directly also using a single model alone which are alone enough to give us the result. We are using a fusion rule in our scheme to come at 100% accuracy. In Step 7-10, we are labelling the image as ‘Live’ only when all the three models call it ‘Live’ and else the image is labelled as ‘Spoof’. This is done to make sure that no spoof image is being labelled as live as spoof being labelled as live, our prime objective.
|
Algorithm 2: |
Evaluation Algorithm (Testing) |
|
|
Step 1: |
evaluatingImage = The image which is to be evaluated. |
|
|
Step 2: |
referenceImage = A simple image with full white background. |
|
|
Step 3: |
ROI = ROI of ‘evaluatingImage’. |
|
|
Step 4: |
A=[] |
|
|
Step 5: |
A(1) = piqe(ROI); |
|
|
|
A(2) = niqe(ROI); |
|
|
|
A(3) = brisque(ROI); |
|
|
|
A(4) = immse(ROI,referenceImage); A(5) = psnr(ROI,referenceImage); A(6) = ssim(ROI,referenceImage); |
|
|
Step 6: |
valueSVM = svmModel.predict(A); |
|
|
|
valueIF = isolationForestModel.predict(A); |
|
|
|
valueLOF = lofModel.predict(A); |
|
|
Step 7: |
if valueSVM == 1 and valueIF == 1 and valueLOF == 1: |
|
|
Step 8: |
The ‘evaluatingImage’ is ‘LIVE’. |
|
|
Step 9: |
else |
|
|
Step 10: |
The ‘evaluatingImage’ is ‘SPOOF’. |
|
The proposed approach is being tested on data of two persons from LivDet, crossmatch 2015. We have created the dataset based on the subject ID, the dataset contains 30 live images of both persons. It also contains 74 spoof samples of first person named ‘A’ and 64 spoof samples of second person named ‘B’ for testing. The composition of the dataset is: Person A (Live: 30, BodyDouble: 15, EcoFlex: 15, Gelatin: 15, OO:14, PlayDoh:15) and Person B (Live: 30, Body Double: 12, Ecoflex: 13, Gelatin: 13, OO: 12, PlayDoh: 14). Now from these 30 images we have created 1000 images out of which 800 is for training and we use rest 200 for testing of the approach. We now test our trained model for both the persons as discussed in the previous section using test data. The test data for Person A use 200 Live images and rest 74 spoof samples. We got the following results for our Person-A.
The confusion matrix see Table 2 for our proposed model for Person A shows following outcome. Out of 274 sample, in 200 live images, we predicted 123 as live and rest 77as spoof. In 74 spoof images, we predicted all as spoof, this an essential requirement for secure access control in the critical system. Thus, the main motive of our proposed approach, use of only the live images of a person we can create an authentication system which rejects all type of spoof samples. The Table 3 explains more about the different performance scores. We are getting F1-score of 0.7616 which is decent score meaning that our model is not just making random guesses. The average precision score is also around 90% which is good. Our model lacks on the overall accuracy as we can see from the confusion matrix, that 77 out of 200 live samples classed as spoof. But it completes the primary motive of detecting spoof samples as we are getting a false positive rate of zero, no spoof is ever called live. Next, we discuss our approach in a much more elaborate manner. The results of different classifier are shown in next section, they are playing an important role in the overall calculation of our results. We are using three different classifiers for the learning purposes.
Table 2. Overall confusion matrix, Person-A
|
Predicted / True |
Live |
Spoof |
|
Live |
123 |
0 |
|
Spoof |
77 |
74 |
Table 3. Overall other metrics, Person-A
|
Metrics |
values |
Metrics |
values |
|
F1 Score |
0.7616 |
Accuracy |
0.7190 |
|
Average Precision Score |
0.8960 |
False Positive Rate |
0.0000 |
4.1 One-class SVM
The first model used is a one class SVM classifier. Support Vector Machine (SVM) is a supervised classification algorithm proposed by Laplace and Gauss in the year 1930 based on statistical learning theory. This algorithm creates a line or a hyperplane such that the data is partitioned into various classes based on the line or the hyperplane defined earlier. Here the algorithm tries to create an optimized hyperplane covering the labeled data. In Table 4, we can see that the accuracy of prediction of live has increased compared to combine-model, but the false negatives have also increased. All other metrics according for SVM, see Table 5 finds that the F1-score and the accuracy of this model alone is higher than that of our model, but the precision and false positive rate are less. The primary concern is that the false positive rate is 0.25 meaning that in every 4 spoofs 1 ‘spoof’ will be called as ‘live’ which is a major concern for our authentication system. As we cannot deploy a model which accepts 1 spoof as live of every 4 spoofs. Next, try to understand this notion using a graphical approach, Figure 2. Here a line on the positive side means we label the image as ‘Live’ by our classifier and if it is in the negative side meaning that the image is labelled as ‘Spoof’. It shows all the 274 test images and to the class it labels them by our model. The major takeaways from this graph is major of the spoof samples are quite a good outlier to the model.
Table 4. SVM, confusion matrix, Person-A
|
Predicted / True |
Live |
Spoof |
|
Live |
184 |
26 |
|
Spoof |
16 |
48 |
Table 5. SVM metrics, Person-A
|
Metrics |
Values |
|
F1 Score |
0.8976 |
|
Average Precision Score |
0.8644 |
|
Accuracy |
0.8467 |
|
False Positive Rate |
0.2500 |
4.2 Isolation forest
Isolation Forest algorithm is an unsupervised algorithm used for detection of anomalies in our data. This algorithm tries to isolate the outliers existing in our data rather than focusing on giving larger weights or focusing more on the normal points. We have used this algorithm for making our model much more global as isolation forest is a different algorithm from normal outlier detection algorithms. We want our model to be strict toward spoof, the outlier detection by this method saves us from such type of errors. The confusion matrix shown in Table 6 indicates effectiveness of isolation forest for outlier.
The results shown in Table 7 for isolation forest are much better than SVM. Our approach becomes universal and robust with this training. Thus, we get a generalized solution to problems and not just some overlay fit solution. The graphical plot for each sample, Figure 3, shows the class boundary.
Table 6. Isolation forest, confusion matrix, Person-A
|
Predicted / True |
Live |
Spoof |
|
Live |
157 |
1 |
|
Spoof |
43 |
73 |
Table 7. Isolation forest, Person-A
|
Metrics |
Live |
|
F1 Score |
0.8771 |
|
Average Precision Score |
0.9369 |
|
Accuracy |
0.8394 |
|
False Positive Rate |
0.0135 |
4.3 Local outlier factor
Local outlier factor used for finding anomalous data points by measuring the local deviation for data point with its neighbors. This algorithm uses the concept of local density for outlier detection in data. Here we are comparing the densities of the k-nearest neighbors, and based on this we find areas with similar density. Data points, which are having a much lesser density than their neighbors, considered outliers to the data. Thus, the algorithm uses distance from neighbors as a major metric for calculation of density. The confusion matrix and other metrics in Tables 8, 9, and Figure 4, a week feature boundary is visible between type-I and type-II error. We can see from the graph distance metrics used for deciding are similar and some are quite a great outlier.
A similar result for person-B is shown in Tables 10, 11, and Figure 5. Out of 264 sample, in 200 live images, we predicted 122 as live and rest 78 as spoof. Out of 64 spoof images, all are predicted as spoof, this fulfills our essential requirement for secure access control to critical system.
Table 8. Local outlier factor, confusion matrix, Person-A
|
Predicted / True |
Live |
Spoof |
|
Live |
155 |
46 |
|
Spoof |
45 |
28 |
Table 9. Local outlier factor, Person A
|
Metrics |
Values |
|
F1 Score |
0.7730 |
|
Average Precision Score |
0.7618 |
|
Accuracy |
0.6679 |
|
False Positive Rate |
0.6216 |
Table 10. Confusion matrix, Person-B
|
Predicted / True |
Live |
Spoof |
|
Live |
122 |
0 |
|
Spoof |
78 |
64 |
Table 11. Other metrics, Person-B
|
Metrics |
Values |
|
F1 Score |
0.7578 |
|
Average Precision Score |
0.9054 |
|
Accuracy |
0.7045 |
|
False Positive Rate |
0.0000 |
Figure 2. Class boundary, SVM
Figure 3. Class boundary, isolation forest
Figure 4. Class boundary, local outlier factor
Figure 5. Class boundary with fusion approach using SVM, IF and LOF, Person-B
Table 12. Comparison with state of art
|
Approach |
Performance |
|
Temporal analysis of perspiration pattern along friction ridges (Parthasaradhi et al. [37]) |
Avg. Classification Accuracy = 90% |
|
Blood flow detection using a sequence of 40 Laser Speckle Contrast Images (Kolberg et al. [38]) |
TDR = 90.99% @ FDR = 0.05% |
|
Fusion of static (LBP and CNN) and dynamic (changes in color ratio) features using a sequence of 2 color frames (Plesh et al. [39]) |
TDR = 96.45% (known-material) @ FDR = 0.2% |
|
Temporal Analysis of Image Sequence (Chugh and Jain [40]) |
TDR = 99.25% (known-material) @ FDR = 0.22% TDR = 86.20% (unknown material) @ FDR = 0.2% |
|
Person Specific approach using Transient Liveness Factor (Proposed) |
TDR=71.90 % @ FDR=0.0% TDR=66.79 % @ FDR=0.0% (Augmented Live sample only, no spoof sample are trained) |
4.4 Critical review with state of art
Consider a (Positive Classes-Live presentation), the poor recall with a reasonable F-measure score is acceptable and not a major challenge in biometric authentication. But, for (Negative Classes-Spoof presentation) the high specificity levels are demanded-a major challenge in high-security establishment. The specificity finds True Negative Rate (TNR) which is important, but more important metrics is False Negative Rate (FNR). Detecting spoof presentation as a live fingerprint is a major challenge. In this proposal, we experimented a scheme to reduce FNR to zero. The proposal works well when the system’s acceptance comes under question mark it affects ‘trust’ on biometric system, like application of financial transaction and entry to restricted area. In our case we able to show (see Table 12) that proposed approach reduces FNR to zero, which better than several close-set and open-set FPAD solution which assumes (0.2%) FNR [10] is acceptable for non-critical (civil) application. Mission critical system related to security of country and privacy preservation requirement cannot assume such a relaxation. is acceptable for non-critical (civil) application.
We have given a scheme that can be extended as an architecture for liveness-server for extraction/updating transient liveness factor. We project, liveness identification is penultimate scope during design, development for testifying the FPAD system to a user. Efforts can used to model a system with generalization. We have discussed here a small step forward towards generalized and reproducible system. This addresses a concern towards the requirement for the uniform system is need of today for future application. The approach proposed will act as a technology of future. A wider scope (usages) over smartphones and smart devices apart from conventional devices is possible then. Only requirement is to design a liveness server according to end user machine(s). With this intelligence gained from TLF, the liveness server will become a new biometric technology backbone. Hackers will find it difficult to access any device. Because of this dynamism, the future machine may match the user access pattern together for more robust system.
[1] Sousedik, C., Busch, C. (2014). Presentation attack detection methods for fingerprint recognition systems: A survey. IET Biometrics, 3(4): 219-233. https://doi.org/10.1049/iet-bmt.2013.0020
[2] Hadid, A., Evans, N., Marcel, S., Fierrez, J. (2015). Biometrics systems under spoofing attack: an evaluation methodology and lessons learned. IEEE Signal Processing Magazine, 32(5): 20-30. https://doi.org/10.1109/MSP.2015.2437652
[3] Marasco, E., Ross, A. (2014). A survey on antispoofing schemes for fingerprint recognition systems. ACM Computing Surveys (CSUR), 47(2): 1-36. https://doi.org/10.1145/2617756
[4] Biggio, B., Fumera, G., Marcialis, G.L., Roli, F. (2016). Statistical meta-analysis of presentation attacks for secure multibiometric systems. IEEE Transactions on Pattern Analysis and Machine Intelligence, 39(3): 561-575. https://doi.org/10.1109/TPAMI.2016.2558154
[5] Akhtar, Z., Micheloni, C., Foresti, G.L. (2015). Biometric liveness detection: Challenges and research opportunities. IEEE Security & Privacy, 13(5): 63-72. https://doi.org/10.1109/MSP.2015.116
[6] Engelsma, J.J., Jain, A.K. (2019). Generalizing fingerprint spoof detector: Learning a one-class classifier. 2019 International Conference on Biometrics (ICB), pp. 1-8. https://doi.org/10.1109/ICB45273.2019.8987319
[7] Rattani, A., Scheirer, W.J., Ross, A. (2015). Open set fingerprint spoof detection across novel fabrication materials. IEEE Transactions on Information Forensics and Security, 10(11): 2447-2460. https://doi.org/10.1109/TIFS.2015.2464772
[8] Gajawada, R., Popli, A., Chugh, T., Namboodiri, A., Jain, A.K. (2019). Universal material translator: Towards spoof fingerprint generalization. 2019 International Conference on Biometrics (ICB), pp. 1-8. https://doi.org/10.1109/ICB45273.2019.8987320
[9] Chugh, T., Cao, K., Jain, A.K. (2018). Fingerprint spoof buster: Use of minutiae-centered patches. IEEE Transactions on Information Forensics and Security, 13(9): 2190-2202. https://doi.org/10.1109/TIFS.2018.2812193
[10] Chugh, T., Jain, A.K. (2019). Fingerprint presentation attack detection: Generalization and efficiency. 2019 International Conference on Biometrics (ICB), pp. 1-8. https://doi.org/10.1109/ICB45273.2019.8987374
[11] Verma, A., Gupta, V.K., Goel, S. (2020). Fingerprint presentation attack detection in open-set scenario using transient liveness factor. Recent Advances in Computer Science and Communications, 13: 1-9.
[12] Ashbourn, J. (2014). Biometrics in the New World. Springer International Publishing Switzerland. https://doi.org/10.1007/978-3-319-04159-9
[13] Francis, D.K.K. (2002). City research online city, University of London Institutional Repository. City Res. Online, 37(9): 1591-1601.
[14] Ghiani, L., Mura, V., Tuveri, P., Marcialis, G.L. (2017). On the interoperability of capture devices in fingerprint presentation attacks detection. In First Italian Conference on Cybersecurity, pp. 66-75.
[15] Anjos, A., El-Shafey, L., Marcel, S. (2017). BEAT: An open-source web-based open-science platform. arXiv preprint arXiv:1704.02319.
[16] Wadhwa, R. (2014). Image quality assessment for fake biometric detection. International Journal for Scientific Research and Development, 2(3): 1407-1409.
[17] Goicoechea-Telleria, I., Kiyokawa, K., Liu-Jimenez, J., Sanchez-Reillo, R. (2019). Low-cost and efficient hardware solution for presentation attack detection in fingerprint biometrics using special lighting microscopes. IEEE Access, 7: 7184-7193. https://doi.org/10.1109/ACCESS.2018.2888905
[18] Mura, V., Orrù, G., Casula, R., Sibiriu, A., Loi, G., Tuveri, P., Marcialis, G.L. (2018). LivDet 2017 fingerprint liveness detection competition 2017. 2018 International Conference on Biometrics (ICB), pp. 297-302. https://doi.org/10.1109/ICB2018.2018.00052
[19] Sequeira, A.F., Cardoso, J.S. (2015). Fingerprint liveness detection in the presence of capable intruders. Sensors, 15(6): 14615-14638. https://doi.org/10.3390/s150614615
[20] Kho, J.B., Lee, W., Choi, H., Kim, J. (2019). An incremental learning method for spoof fingerprint detection. Expert Systems with Applications, 116: 52-64. https://doi.org/10.1016/j.eswa.2018.08.055
[21] Evans, N., Li, S.Z., Marcel, S., Ross, A. (2015). Guest editorial: Special issue on biometric spoofing and countermeasures. IEEE Transactions on Information Forensics and Security, 10(4): 699-702. https://doi.org/10.1109/TIFS.2015.2406111
[22] Galbally, J., Fierrez, J., Cappelli, R. (2019). Handbook of Biometric Anti-Spoofing. Springer International Publishing. https://doi.org/10.1007/978-3-319-92627-8
[23] Oza, P., Patel, V.M. (2018). One-class convolutional neural network. IEEE Signal Processing Letters, 26(2): 277-281. https://doi.org/10.1109/LSP.2018.2889273
[24] Yuan, C., Xia, Z., Jiang, L., Cao, Y., Wu, Q.J., Sun, X. (2019). Fingerprint liveness detection using an improved CNN with image scale equalization. IEEE Access, 7: 26953-26966. https://doi.org/10.1109/ACCESS.2019.2901235
[25] Marasco, E., Wild, P., Cukic, B. (2016). Robust and interoperable fingerprint spoof detection via convolutional neural networks. 2016 IEEE Symposium on Technologies for Homeland Security (HST), pp. 1-6. https://doi.org/10.1109/THS.2016.7568925
[26] Labati, R.D., Genovese, A., Muñoz, E., Piuri, V., Scotti, F. (2018). A novel pore extraction method for heterogeneous fingerprint images using convolutional neural networks. Pattern Recognition Letters, 113: 58-66. https://doi.org/10.1016/j.patrec.2017.04.001
[27] Zhang, Y., Shi, D., Zhan, X., Cao, D., Zhu, K., Li, Z. (2019). Slim-ResCNN: A deep residual convolutional neural network for fingerprint liveness detection. IEEE Access, 7: 91476-91487. https://doi.org/10.1109/ACCESS.2019.2927357
[28] Ruff, L., Vandermeulen, R., Goernitz, N., Deecke, L., Siddiqui, S. A., Binder, A., Kloft, M. (2018). Deep one-class classification. Proceedings of the 35th International Conference on Machine Learning, 80: 4393-4402.
[29] Bhardwaj, I., Londhe, N.D., Kopparapu, S.K. (2017). A spoof resistant multibiometric system based on the physiological and behavioral characteristics of fingerprint. Pattern Recognition, 62: 214-224. https://doi.org/10.1016/j.patcog.2016.09.003
[30] Bhardwaj, I., Londhe, N.D., Kopparapu, S.K. (2017). A novel behavioural biometric technique for robust user authentication. IETE Technical Review, 34(5): 478-490. https://doi.org/10.1080/02564602.2016.1203271
[31] Bhardwaj, I., Londhe, N.D., Kopparapu, S. K. (2016). Study of imposter attacks on novel fingerprint dynamics based verification system. IEEE Access, 5: 595-606. https://doi.org/10.1109/ACCESS.2016.2646398
[32] Deutschmann, I., Lindholm, J. (2013). Behavioral biometrics for DARPA's active authentication program. In 2013 International Conference of the BIOSIG Special Interest Group (BIOSIG), pp. 1-8.
[33] Systems, I. (2019). IWS GoVerifyID. Available: https://www.iwsinc.com/products/goverifyid/, accessed on 27 April 2019.
[34] GOI, What is Aadhaar. Available: https://uidai.gov.in/what-is-aadhaar.html, accessed on 27 April 2019.
[35] Aware, I. (2019). IndigoTM, Aware, Inc. Available: https://www.aware.com/biometrics/indigo-biometrics-saas/, accessed on 27 April 2019.
[36] Talreja, V., Ferrett, T., Valenti, M.C., Ross, A. (2018). Biometrics-as-a-service: A framework to promote innovative biometric recognition in the cloud. 2018 IEEE International Conference on Consumer Electronics (ICCE), pp. 1-6. https://doi.org/10.1109/ICCE.2018.8326075
[37] Parthasaradhi, S.T., Derakhshani, R., Hornak, L.A., Schuckers, S.A. (2005). Time-series detection of perspiration as a liveness test in fingerprint devices. IEEE Transactions on Systems, Man, and Cybernetics, Part C (Applications and Reviews), 35(3): 335-343. https://doi.org/10.1109/TSMCC.2005.848192
[38] Kolberg, J., Gomez-Barrero, M., Busch, C. (2019). Multi-algorithm benchmark for fingerprint presentation attack detection with laser speckle contrast imaging. In 2019 International Conference of the Biometrics Special Interest Group (BIOSIG), pp. 1-5.
[39] Plesh, R., Bahmani, K., Jang, G., Yambay, D., Brownlee, K., Swyka, T., Schuckers, S. (2019). Fingerprint presentation attack detection utilizing time-series, color fingerprint captures. 2019 International Conference on Biometrics (ICB), pp. 1-8.
[40] Chugh, T., Jain, A.K. (2019). Fingerprint spoof detection: Temporal analysis of image sequence. In 2020 IEEE International Joint Conference on Biometrics (IJCB), pp. 1-10. https://doi.org/10.1109/IJCB48548.2020.9304921