Haiyue Zhang | Daoyun Xu* | Yongbin Qin
© 2021 IIETA. This article is published by IIETA and is licensed under the CC BY 4.0 license (http://creativecommons.org/licenses/by/4.0/).
OPEN ACCESS
Salient feature extraction is an important task in image classification and recognition. Although classification techniques focus on the bright part of an image, many pixels of the image are of similar saliency. To address the issue, this paper proposes the logarithmic function-based novel representation algorithm (LFNR) to apply a novel representation for each image. The original and novel representations were fused to improve the classification accuracy. Experimental results show that, thanks to the simultaneous use of original and novel representations, the test samples could be better classified. The classification algorithms coupled with the LFNR all witnessed lower error rates than the original algorithms. In particular, the collaboration representation-based classification coupled with the LFNR significantly outperformed the other sparse representation algorithms, such as homotopy, primal augmented Lagrangian method (PALM), and sparse reconstruction by separable approximation algorithm (SpaRSA). The no-parameter property of the LFNR is also noteworthy.
image classification, sparse representation, image representation, fusion method
How to represent images competently and complementarily remains a challenge in computer vision. This issue has long been a hot topic because competent and complementary image representation greatly facilitates automatic diagnosis and target recognition [1]. Face recognition is one of the principal applications of this technique. However, the application effect is challenged by varying illumination, facial expressions, and poses. The huge differences between the images on the same face add to the difficulty of face recognition. To improve target recognition and image classification, it is critical to describe the subject more effectively [2-5].
New representations of true face images can be constructed by multiple methods [6]. Some researchers proposed a new representation scheme based on the mathematical and geometric features of face. For example, Ryu and Oh [7] derived the feature point distribution from intra-class feature angle, and generated virtual training samples for face recognition. Thian et al. [8] produced shifted and scaled face patterns as virtual samples through multiple geometric transforms.
The biological features of human face are a research hotspot. Xu et al. [9] offered a new method to generate new samples based on face symmetry, and proved the method competent in face recognition. Some scholars [10-12] also proposed mirror face images, which adapt well to the potential changes induced by the variation in facial expressions and environment.
Apart from the face features, environmental factors of face images also attract much attention. From a single face image, Sharma et al. [13] created multiple virtual images of a person with different poses and illuminations, aiming to track every training image: the virtual multi-view images were synthetized from eigen-faces through global linear regression (GLR).
There are some other methods that effectively represent and recognize face images [14-16]. Guo et al. [17] developed a pairwise classification framework of Bayes classifier and adaptive boosting (AdaBoost) for face recognition. Fuzzy logic has also been successfully applied in image processing [18].
The accuracy of face recognition partly depends on the classification algorithms. Among the various approaches for image classification [19-21], sparse representation-based classification (SRC) is recognized for its simplicity and state-of-the-art performance [22]. Conventionally, sparse representation encodes a sample over a dictionary by a sparse vector [23]. The sparsity of the vector is ensured by minimizing the l0-norm. The l1-minimization is often adopted, due to the non-deterministic polynomial-time (NP) hardness of combinatorial l0-minimization [24, 25].
The typical sparse representation algorithms based on l1-minimization includes homotopy [26], fast iterative shrinkage and thresholding algorithm (FISTA) [27], primal augmented Lagrangian method (PALM) [28-30], and dual augmented Lagrangian method (DALM). Considering the role of collaboration, Yang et al. [31] proposed a collaboration representation-based classification (CRC) strategy, which replaces l1-norm with the less complex l2-norm. Many evidences show that the l2-norm CRC is more accurate and simpler than the SRC in face recognition [32, 33].
To enhance the influence of low-intensity pixels in an image, this paper develops a novel image representation method based on logarithmic function: the sparse representation classification was applied to both original and novel representations, and the two classification results were fused automatically into the final classification result. The proposed algorithm is called the logarithmic function-based novel representation algorithm (LFNR).
The proposed algorithm is innovative in the following aspects: First, a novel representation of images is developed as new training samples; Second, the classification results of original and novel representations are combined effectively; Third, the proposed algorithm achieves an excellent accuracy in face recognition and the classification of non-face images.
The remainder of this paper is structured as follows: Section 2 reviews the relevant research; Section 3 introduces the main steps of the LFNR; Section 4 analyzes the proposed algorithm; Section 5 verifies the algorithm through experiments; Section 6 offers the conclusions.
Sparse representation has sparkled increasing interest in the past years. The SRC algorithm was developed and successfully used in image processing and classification. Conventional sparse representation strategies encode a single as a sparse vector by minimizing the l0-norm. Because of the NP-hardness of l0-minimization, the l1-minimization is widely employed in sparse representation.
The SRC describes the entire training set as a matrix X, as the concatenation of the n training samples of all C classes:
$\begin{array}{l}
X=\left[X_{1}, X_{2}, \cdots, X_{c}\right] \\
=\left[v_{1,1}, v_{1,2}, \cdots, v_{1, n_{1}}, \cdots, v_{C, 1}, \cdots, v_{C, n_{c}}\right] \in \mathbb{R}^{m \times n}
\end{array}$ (1)
where, $X_{i}=\left[v_{i, 1}, v_{i, 2}, \cdots, v_{i, n_{i}}\right] \in \mathbb{R}^{m \times n_{i}}(i=1, \ldots, C)$; vi,j is a column vector containing m dimensional features; ni is the number of samples in i-th class.
Then, a test sample y can be written as a linear representation of all training samples:
$y=A x \in \mathbb{R}^{m}$ (2)
This problem can be resolved by choosing the minimum l-norm solution and relaxing the constraint of formula (2).
$(\hat{\alpha})=\arg \min _{\alpha}\left\{\|y-X \cdot \alpha\|_{2}^{2}+\lambda\|\alpha\|_{1}\right\}$ (3)
where, λ is the control variable of the small noise in y.
The collaboration representation-based classification method pays a special effort to promote inter-class collaboration in representing the query sample. The corresponding minimization problem can be expressed as:
$(\hat{p})=\arg \min _{\rho}\left\{\|y-X \cdot p\|_{2}^{2}+\lambda\|p\|_{2}^{2}\right\}$ (4)
Despite being less sparse than the l1-norm, this approach makes the solution more stable and introduces sparsity. The solution to formula (4) can be easily derived as:
$\hat{p}=\left(X^{T} X+\lambda I\right)^{-1} X^{T} y$ (5)
The solution makes the algorithm fast, for $Q=\left(X^{T} X+\lambda I\right)^{-1} X^{T}$ can be calculated in advance. Then, the residual is computed to identify the class of each test sample.
The above analysis indicates that l2-regularized collaboration representation-based classification is a very simple way to achieve competitive recognition accuracy.
3.1 Novel representation generation method
This subsection introduces the novel representation generation method of an original image. Let O stand for an original image, and oij denote the pixel in row i and column j of image O. The novel representation N of image O can be defined as:
$n_{i j}=\log \left(o_{i j}+\alpha\right)$ (6)
where, nij is the intensity of the novel representation, i.e., the gray value of the pixel in row i and column j; α is a constant added to avoid emerging infinitesimal when oij equals 0. According to experimental evidences, the α value was set to 1.
The novel representations generated by formula (1) have the following properties:
(1) The image features become more salient through the nonlinear operation of the logarithmic function;
(2) The relativeness between novel and original representations does not change due to the monotonicity of the logarithmic function;
(3) The logarithmic function increases the brightness of the dark region, making the dark part of the novel representation more refined and sensitive.
3.2 Fusion between original and novel representations
According to their properties, the novel representations were treated as new training samples. Then, both original and novel samples were processed by the SRC algorithm, producing two classification results. For each test sample, two residuals can be obtained by formula (5). Afterwards, the two residuals were merged by the following method.
Let $d_{i}^{o}$ (i=1,…,C) denote the distance, i.e., the residual, between the test sample and original samples of the i-th class; $d_{i}^{n}$ (i=1,…,C) denote the distance between test sample and the novel samples of the i-th class, with C being the total number of classes. The shorter the distance between a test sample and a class, the greater the probability that the test sample belongs to that class. Further, $S_{1}^{o} \text { and } S_{2}^{o}$ were defined as the two shortest distances in $d_{i}^{o}$ (i=1,…,C); $S_{1}^{n} \text { and } S_{2}^{n}$ were defined as the two shortest distances in $d_{i}^{n}$ (i=1,…,C). The weights of original and novel representations can be calculated by $w_{o}=\frac{w_{1}}{w_{1}+w_{2}} \text { and } w_{n}=\frac{w_{2}}{w_{1}+w_{2}}$, respectively, where $w_{1}=S_{2}^{o}-S_{1}^{o} \text { and } w_{2}=S_{2}^{n}-S_{1}^{n}$. The score of the test sample belonging to a class can be described as $q_{i}=w_{o} d_{i}^{o}+w_{n} d_{i}^{n}(i=1, \ldots, C)$. Finally, the test sample was assigned to the i-th class by:
$r=\arg \min _{i} q_{i}$ (7)
3.3 Steps of the LFNR
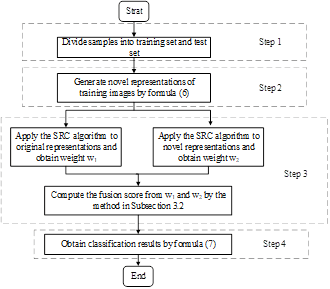
As shown in Figure 1, the LFNR is implemented in four steps: Divide each sample in the dataset into two subsets: a training set and a test set; Generate novel representations of training images by formula (6); Apply the SRC algorithm to both original and novel representations, and compute the fusion score by the method in subsection 3.2; Classify the test samples.
Figure 1. Main steps of the LFNR
Many recognition algorithms focus on pixels, because different pixels in the same image vary in intensity. In this sense, it is rational to attach greater importance to the pixels with noteworthy importance. This idea is adopted by the LFNR to generate a new representation of each original representation.
To prevent the overlook of the dark part of an image with important information, the logarithmic function is called to reduce the gray value interval, and retain the virtual relationship between pixels in the original representation. That is, the logarithmic function in the LFNR lowers the brightness of the bright part by raising the brightness of the dark part. In addition, the nonlinear operation of logarithmic function preserves the edge feature of the image, while removing noises from the image, making the image smoother. Without any additional parameter, the LFNR is fast and efficient.
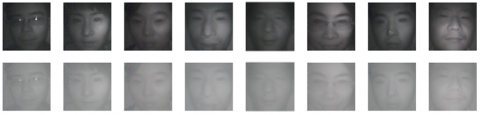
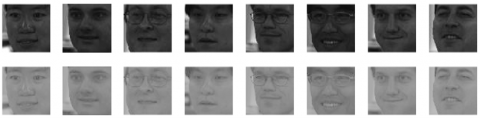
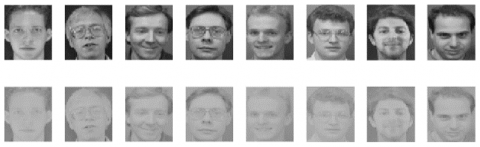
For better illustration, Figures 2-4 present eight original training samples from the Lab2 face database [34], the CMU_PIE face database [35], and the ORL database [36], as well as their corresponding novel training samples, respectively. In each figure, the images in the first row are original representations, and those in the second row are novel representations. It can be seen that, rather than directly associated with the corresponding original representations, the novel representations clearly differed from the latter in appearance.
If an image is too bright or too dark, the image features will be vague. In a high contrast image, the gray values tend to obey uniform distribution. The general contrast is positively correlated with the standard deviation. It is known to all that, the curve of logarithmic function changes greatly, when the independent variable is small, and changes insignificantly, when the independent variable is large. Therefore, the LFNR can concentrate the gray values in the dark region, and convert a bisection of that region into a bright region. For instance, the glitter of the glasses from three people in Figure 4 was smoothed out in the corresponding novel representations. Simultaneously, the details of obscure regions were enhanced in the novel representations.
Figure 2. Original and novel training samples based on the Lab2 database
Figure 3. Original and novel training samples based on the CMU_PIE database
Figure 4. Original and novel training samples based on the ORL database
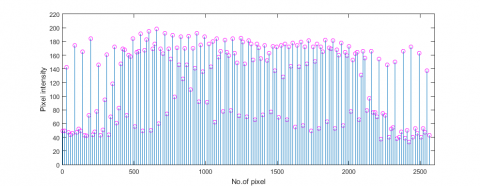
Figure 5. Pixel intensity of original representation of the first image in Lab2 face dataset
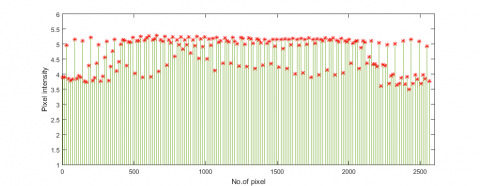
Figure 6. Pixel intensity of novel representation of the first image in Lab2 face dataset
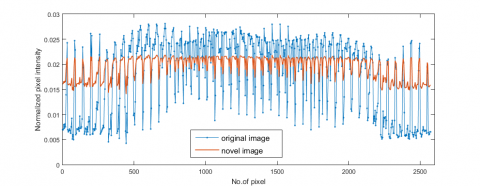
The rationale of the LFNR can be better demonstrated by data presentation. Figures 5 and 6 show the original and novel pixels for the first sample of the first person in the Lab2 face dataset. For clarity, the pixels of Figures 5 and 6 were converted into unit vectors with norm 2 (Figure 7). It can be seen that the pixel intensity in the dark region was enhanced, while that in the bright region was reduced. The novel representation had more stable pixel intensity than the original representation.
Figure 7. Normalized original representation and the corresponding novel representation of the first image in Lab2 face dataset
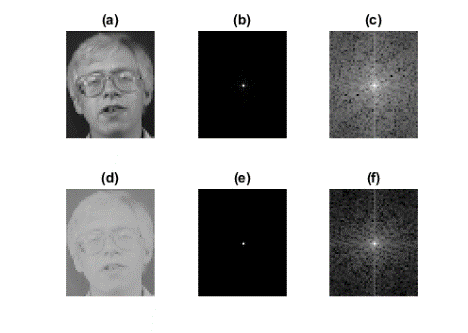
(a) Original representation (b) Fourier spectrum of original representation (c) Fourier spectrum after logarithmic transform (d) Novel representation (e) Fourier spectrum of novel representation (f) Fourier spectrum after logarithmic transform
Figure 8. The Fourier spectrums of an original and novel representation from ORL database
Figure 8 presents the Fourier spectrum of an original representation from the ORL database and that of the corresponding novel representation. Subgraphs (a) and (d) are original and novel representations of the subject, respectively; subgraphs (b) and (e) are homologous Fourier spectra of the original and novel representations, respectively; subgraphs (c) and (f) are the Fourier spectra (b) and (e) after logarithmic transform, respectively.
After the transform, the brightest point in the middle of each spectrum has the lowest frequency. The higher the frequency at this point, the greater the frequency outside the edge. During image processing, the frequency domain reflects the intensity of gray value variation in the spatial domain, that is, the change speed of gray value. The edge of each representation mutates quickly, making it a high-frequency component in the frequency domain; the noise of the representation is mostly a high-frequency component; the uniform area of the representation is generally a low-frequency component.
The components at the center of each Fourier spectrum are of low frequency. The Fourier spectrum (f) was mainly composed of low-frequency components, indicating that the high-frequency noises had been largely removed.
Low-frequency information, as the main component of an image, determines the basic gray value of the image, and has little impact on image structure; the medium-frequency information determines the image structure, and forms the main edge of the image; the high-frequency information makes up the edge and details of the image, further enhancing the image contents on the basis of the medium-frequency information.
For face recognition, the image contents, i.e., the basic facial features, should be the main components, while the interference of mutation factors like glasses, beards, and hair must be minimized. As shown in Figure 8, the representations processed by our method were mainly of low frequency. This means the image contents have been largely preserved, and the mutation components have been removed. Thus, our method is suitable for face images with strong light changes, or severe occlusions.
The above analysis on pixel intensity and Fourier spectrum shows that our algorithm is both reasonable and efficient. Moreover, the novel representations preserve the natural faces and differ greatly from the original representations. The simultaneous use of the original and novel representations may reveal more details of the subject. This calls for an effective fusion method.
According to subsection 3.2, the fusion method finds two minimum distances between the test sample and the original samples, and take the differences of the distances as the weights. The same operation is applied to the test sample and the novel samples. The greater the weight (w1 or w2), the more noticeable the classification. In other words, a large weight is more decisive. This proves the rationality of our fusion method.
Our LFNR was verified on three face databases, namely, the Lab2 face database [34], the CMU_PIE face database [35], and the ORL database [36], and one non-face database, that is, COIL 100 database [37]. The classification algorithm is the collaboration representation-based classification method.
For comparison, several state-of-the-art sparse representation algorithms were also tested as the classification algorithm, including homotopy [27], FISTA [28], sparse reconstruction by separable approximation algorithm (SpaRSA) [38].
Firstly, the LFNR was applied to generate novel representations from one dataset. Then, one of the classification algorithms was selected to classify both original representations and novel representations. The fusion was carried out by the abovementioned approach.
In the following parts, the collaboration representation-based classification method coupled with LFNR is denoted as: LFNR with collaboration representation; similarly, homotopy, FISTA, and SpaRSA coupled with LFNR are denoted as: LFNR with homotopy, LFNR with FISTA, and LFNR with SpaRSA, respectively. The directly application of homotopy, FISTA, SpaRSA and collaboration representation-based classification method on original representations are denoted as primitive homotopy, primitive FISTA, primitive SpaRSA, and primitive collaboration representation, respectively.
5.1 Experiments on Lab2 face database
The verification experiments were firstly carried out on Lab2 face database. A total of 1,000 gray images about 50 subjects were selected. For each subject, there were 20 images shot under different illuminations. All the images from the database have a resolution of 200×200 pixels.
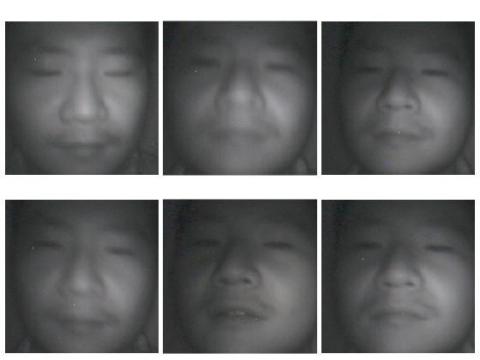
Figure 9 shows six images on one subject from Lab2 database. Two to six of the six images were taken as the original training samples in turn, with the remaining images as test samples. The experimental results are reported in Table 1.
It can be seen that our algorithm clearly outshined the contrastive algorithms. The classification error rates of LFNR with homotopy on 2 and 3 training samples were 31.67% and 31.06%, respectively; those of LFNR with FISTA on 2 and 3 training samples were 33.44% and 32.12%, respectively; those of LFNR with collaboration representation on 2 and 3 training samples were 30.44% and 29.18%, respectively. On four training samples, the classification error rates of primitive FISTA and primitive SpaRSA were 38.40% and 46.38%, respectively; after the inclusion of LFNR, the two error rates dropped to 32.13% and 46.27%, respectively. Hence, the LFNR can effectively suppress the error rate, and improve the performance of the primitive algorithms.
Figure 9. Six images on one subject from Lab2 database
Table 1. Error rates (%) on the Lab2 dataset
|
Sample number |
2 |
3 |
4 |
5 |
6 |
|
Primitive collaboration representation |
31.00 |
29.76 |
26.00 |
25.73 |
21.57 |
|
LFNR with collaboration representation |
30.44 |
29.18 |
25.50 |
24.53 |
22.14 |
|
Primitive homotopy |
36.44 |
35.41 |
34.38 |
33.20 |
30.00 |
|
LFNR with homotopy |
31.67 |
31.06 |
32.00 |
31.33 |
27.14 |
|
Primitive FISTA |
36.78 |
36.24 |
36.38 |
38.40 |
35.00 |
|
LFNR with FISTA |
33.44 |
32.12 |
31.62 |
32.13 |
28.86 |
|
Primitive SpaRSA |
44.00 |
46.71 |
46.38 |
46.80 |
42.43 |
|
LFNR with SpaRSA |
42.56 |
44.71 |
45.63 |
46.27 |
42.00 |
5.2 Experiments on CMU_PIE face database
The CMU_PIE face database contains over 750,000 images of 337 people taken in four sessions over five months. Each subject was short from 15 view points and under 19 different illuminations, while he/she was displaying a wide range of facial expressions. Our experiment uses a subset of the CMU_PIE face database, which includes 1,632 images on 68 people. For each person, there were 24 images with the resolution of 64×64 pixels.
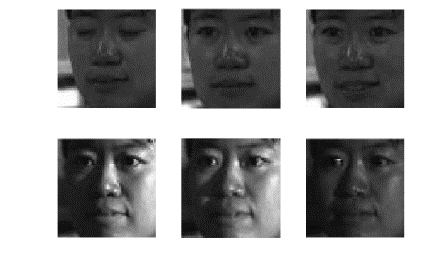
Figure 10 shows six images on one subject with different facial expressions taken under different illuminations from CMU_PIE. Two to six of the six images were taken as the original training samples in turn, with the remaining images as test samples. The experimental results are reported in Table 2.
Figure 10. Six images on one subject with different facial expressions taken under different illuminations from CMU_PIE
It can be seen that the coupling between the LFNR and collaborative representation, homotopy, FISTA, and SpaRSA lowered the classification error rates. The LFNR with collaborative representation performed exceptionally well, achieving the minimum error rates of 77.87%, 76.96%, 48.53%, 42.65% and 38.48%, respectively, under different number of samples.
Table 2. Error rates (%) on the CMU_PIE dataset
|
The number of training samples |
2 |
3 |
4 |
5 |
6 |
|
Sample number |
80.21 |
79.76 |
49.12 |
43.65 |
38.48 |
|
Primitive collaboration representation |
77.87 |
76.96 |
48.53 |
42.65 |
38.48 |
|
LFNR with collaboration representation |
88.44 |
92.02 |
69.78 |
68.11 |
65.11 |
|
Primitive homotopy |
82.75 |
85.15 |
62.65 |
61.92 |
59.64 |
|
LFNR with homotopy |
87.30 |
93.07 |
70.74 |
53.17 |
55.39 |
|
Primitive FISTA |
80.82 |
89.71 |
64.41 |
51.01 |
54.08 |
|
LFNR with FISTA |
88.97 |
92.58 |
89.49 |
86.30 |
84.23 |
|
Primitive SpaRSA |
88.84 |
92.51 |
87.87 |
85.99 |
83.50 |
5.3 Experiments on ORL face database
Next, experiments were carried out on the ORL face database, which contains 400 images on 40 people, 10 for each person. The images have a resolution of 200×200 pixels.
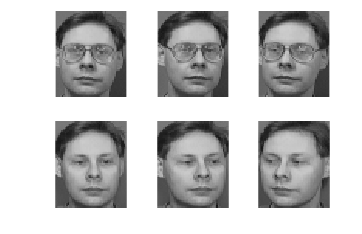
Figure 11 shows six images on one subject with different facial expressions taken under different illuminations from ORL. Two to six of the six images were taken as the original training samples in turn, with the remaining images as test samples. The experimental results are reported in Table 3.
Figure 11. Six images on one subject with different facial expressions taken under different illuminations from ORL
Table 3. Error rates (%) on the ORL dataset
|
Sample number |
2 |
3 |
4 |
5 |
6 |
|
Primitive collaboration representation |
16.56 |
13.93 |
10.83 |
11.50 |
8.13 |
|
LFNR with collaboration representation |
12.81 |
12.50 |
9.17 |
7.50 |
5.63 |
|
Primitive homotopy |
19.69 |
18.57 |
13.75 |
13.00 |
12.50 |
|
LFNR with homotopy |
12.81 |
11.43 |
8.33 |
9.50 |
6.25 |
|
Primitive FISTA |
18.44 |
16.79 |
12.08 |
13.50 |
14.38 |
|
LFNR with FISTA |
18.44 |
15.00 |
9.58 |
12.00 |
13.13 |
|
Primitive SpaRSA |
18.44 |
16.79 |
12.92 |
11.00 |
10.00 |
|
LFNR with SpaRSA |
17.81 |
16.79 |
12.08 |
11.00 |
9.38 |
It can be seen that the LFNR outshined all the sparse representation methods being tested. After the introduction of the LFNR, the classification error rate of primitive FISTA declined from 16.79% to 15.00% on three training samples; that of primitive SpaRSA dropped from 10.00% to 9.38% on six training samples. This fact confirms that the LFNR and the fusion method are beneficial for classification.
5.4 Experiments on COIL100 database
Finally, experiments were carried out on a non-face database called COIL100. The test set contains 7,200 images from 100 classes, 72 in each class. All images have a resolution of 128×128 pixels.
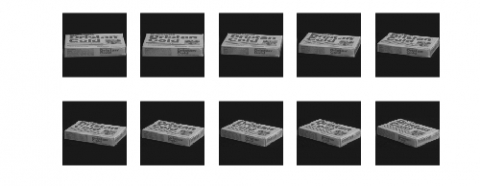
Figure 12 shows ten images on the same subject shot from different view points from the database. Then, one to five of the six images were taken as the original training samples in turn, with the remaining images as test samples. The experimental results are reported in Table 4.
It can be seen that the LFNR with collaboration representation achieved the minimum classification error rates on one to five training samples: 46.36%, 47.59%, 48.32%, 48.31%, and 48.37%, respectively. Therefore, the LFNR also performs well in non-face recognition.
Figure 12. Ten images on one subject taken from different view points
Table 4. Error rates (%) on the COIL100 dataset
|
Sample number |
1 |
2 |
3 |
4 |
5 |
|
Primitive collaboration representation |
47.70 |
49.06 |
49.16 |
49.34 |
49.38 |
|
LFNR with collaboration representation |
46.36 |
47.59 |
48.32 |
48.31 |
48.37 |
|
Primitive homotopy |
52.08 |
51.97 |
52.09 |
51.72 |
50.91 |
|
LFNR with homotopy |
50.38 |
50.64 |
50.51 |
49.66 |
49.06 |
|
Primitive FISTA |
53.49 |
54.26 |
55.35 |
55.88 |
55.55 |
|
LFNR with FISTA |
53.65 |
54.53 |
55.80 |
56.00 |
56.04 |
|
Primitive SpaRSA |
52.41 |
53.97 |
53.30 |
52.88 |
52.54 |
|
LFNR with SpaRSA |
52.06 |
52.09 |
52.17 |
52.00 |
51.39 |
This paper designs a method to generate a new representation from the original representation. The novel representation is fast to compute and easy to understand. Neither the generation of the novel representation nor the fusion between novel and original representations has any parameter. This makes the LFNR mathematically tractable and completely automatic. More importantly, the novel representations enhance the details of dark regions and preserve the edge features of the images. In addition to producing a novel representation of images, the LFNR uses both the original and novel representations to assist with image classification. Experiments show that the fusion method can improve the classification accuracy by a maximum of 6%. The test results on three face datasets and a non-face dataset demonstrate that the LFNR is an effect way to improve the correctness of target recognition.
This work was supported by National Natural Science Foundation of China (Grant No.: 61540050, 61262006, and 61462013), and Major Applied Basic Research Program of Guizhou Province, China (Grant No.: JZ20142001).
[1] Mansano, A., Matsuoka, J.A., Afonso, L.C.S., Papa, J.P., Faria, F., Torres, R.D.S. (2012). Improving image classification through descriptor combination. In 2012 25th SIBGRAPI Conference on Graphics, Patterns and Images, pp. 324-329. https://doi.org/10.1109/SIBGRAPI.2012.52
[2] Hou, J., Zhang, B.P., Qi, N.M., Yang, Y. (2011). Evaluating feature combination in object classification. In International Symposium on Visual Computing. Springer, Berlin, Heidelberg, 597-606. https://doi.org/10.1007/978-3-642-24031-7_60
[3] Xu, Y., Zhang, D., Yang, J., Yang, J.Y. (2011). A two-phase test sample sparse representation method for use with face recognition. IEEE Transactions on Circuits and Systems for Video Technology, 21(9): 1255-1262. https://doi.org/10.1109/TCSVT.2011.2138790
[4] Turk, M.A., Pentland, A.P. (2015). Face recognition using eigenface. International Journal of Computer Applications, 118(5):12-16.
[5] Punnappurath, A., Rajagopalan, A.N., Taheri, S., Chellappa, R., Seetharaman, G. (2015). Face recognition across non-uniform motion blur, illumination, and pose. IEEE Transactions on Image Processing, 24(7): 2067-2082. https://doi.org/10.1109/TIP.2015.2412379
[6] Song, X., Yang, X., Shao, C., Yang, J. (2017). Parity symmetrical collaborative representation-based classification for face recognition. International Journal of Machine Learning and Cybernetics, 8(5): 1485-1492. https://doi.org/10.1007/s13042-016-0520-4
[7] Ryu, Y.S., Oh, S.Y. (2002). Simple hybrid classifier for face recognition with adaptively generated virtual data. Pattern Recognition Letters, 23(7): 833-841. https://doi.org/10.1016/S0167-8655(01)00159-3
[8] Thian, N.P.H., Marcel, S., Bengio, S. (2003). Improving face authentication using virtual samples. In 2003 IEEE International Conference on Acoustics, Speech, and Signal Processing (ICASSP'03), 3: III-233. https://doi.org/10.1109/ICASSP.2003.1199150
[9] Xu, Y., Zhu, X., Li, Z., Liu, G., Lu, Y., Liu, H. (2013). Using the original and ‘symmetrical face’ training samples to perform representation based two-step face recognition. Pattern Recognition, 46(4): 1151-1158. https://doi.org/10.1016/j.patcog.2012.11.003
[10] Wu, S., Cao, J. (2014). ‘Symmetrical face’ based improved LPP method for face recognition. Optik, 125(14): 3530-3533. https://doi.org/10.1016/j.ijleo.2014.01.057
[11] Xu, Y., Li, X., Yang, J., Lai, Z., Zhang, D. (2013). Integrating conventional and inverse representation for face recognition. IEEE Transactions on Cybernetics, 44(10): 1738-1746. https://doi.org/10.1109/TCYB.2013.2293391
[12] Tang, D., Zhu, N., Yu, F., Chen, W., Tang, T. (2014). A novel sparse representation method based on virtual samples for face recognition. Neural Computing and Applications, 24(3): 513-519. https://doi.org/10.1007/s00521-012-1252-3
[13] Sharma, A., Dubey, A., Tripathi, P., Kumar, V. (2010). Pose invariant virtual classifiers from single training image using novel hybrid-eigenfaces. Neurocomputing, 73(10-12): 1868-1880. https://doi.org/10.1016/j.neucom.2009.10.027
[14] Ma, B., Su, Y., Jurie, F. (2012). Bicov: A novel image representation for person re-identification and face verification. In British Machive Vision Conference, 11.
[15] Ding, C., Tao, D. (2016). A comprehensive survey on pose-invariant face recognition. ACM Transactions on Intelligent Systems and Technology (TIST), 7(3): 1-42. https://doi.org/10.1145/2845089
[16] Ding, C., Choi, J., Tao, D., Davis, L.S. (2015). Multi-directional multi-level dual-cross patterns for robust face recognition. IEEE Transactions on Pattern Analysis and Machine Intelligence, 38(3): 518-531. https://doi.org/10.1109/TPAMI.2015.2462338
[17] Guo, G.D., Zhang, H.J., Li, S.Z. (2001). Pairwise face recognition. In Proceedings Eighth IEEE International Conference on Computer Vision. ICCV 2001, 2: 282-287. https://doi.org/10.1109/ICCV.2001.937637
[18] Melin, P., Gonzalez, C.I., Castro, J.R., Mendoza, O., Castillo, O. (2014). Edge-detection method for image processing based on generalized type-2 fuzzy logic. IEEE Transactions on Fuzzy Systems, 22(6): 1515-1525. https://doi.org/10.1109/TFUZZ.2013.2297159
[19] Zhang, Z., Xu, Y., Yang, J., Li, X., Zhang, D. (2015). A survey of sparse representation: Algorithms and applications. IEEE Access, 3: 490-530. https://doi.org/10.1109/ACCESS.2015.2430359
[20] Xu, Y., Li, Z., Zhang, B., Yang, J., You, J. (2017). Sample diversity, representation effectiveness and robust dictionary learning for face recognition. Information Sciences, 375: 171-182. https://doi.org/10.1016/j.ins.2016.09.059
[21] Xu, Y., Zhang, Z., Lu, G., Yang, J. (2016). Approximately symmetrical face images for image preprocessing in face recognition and sparse representation based classification. Pattern Recognition, 54: 68-82. https://doi.org/10.1016/j.patcog.2015.12.017
[22] Wright, J., Yang, A.Y., Ganesh, A., Sastry, S.S., Ma, Y. (2008). Robust face recognition via sparse representation. IEEE Transactions on Pattern Analysis and Machine Intelligence, 31(2): 210-227. https://doi.org/10.1109/TPAMI.2008.79
[23] Buciu, I., Pitas, I. (2004). A new sparse image representation algorithm applied to facial expression recognition. In Proceedings of the 2004 14th IEEE Signal Processing Society Workshop Machine Learning for Signal Processing, 2004, 539-548. https://doi.org/10.1109/MLSP.2004.1423017
[24] Huang, M.W., Wang, Z.W., Ying, Z.L. (2010). A new method for facial expression recognition based on sparse representation plus LBP. In 2010 3rd International Congress on Image and Signal Processing, 4: 1750-1754. https://doi.org/10.1109/CISP.2010.5647898
[25] Liu, L., Tran, T.D., Chin, S.P. (2016). Partial face recognition: A sparse representation-based approach. In 2016 IEEE International Conference on Acoustics, Speech and Signal Processing (ICASSP), pp. 2389-2393. https://doi.org/10.1109/ICASSP.2016.7472105
[26] Yang, A.Y., Sastry, S.S., Ganesh, A., Ma, Y. (2010). Fast ℓ 1-minimization algorithms and an application in robust face recognition: A review. In 2010 IEEE International Conference on Image Processing, pp. 1849-1852. https://doi.org/10.1109/ICIP.2010.5651522
[27] Kim, S.J., Koh, K., Lustig, M., Boyd, S., Gorinevsky, D. (2007). An interior-point method for large-scale ℓ1-regularized least squares. IEEE Journal of Selected Topics in Signal Processing, 1(4): 606-617.
[28] Donoho, D.L., Tsaig, Y. (2008). Fast solution of ℓ1-norm minimization problems when the solution may be sparse. IEEE Transactions on Information Theory, 54(11): 4789-4812. https://doi.org/10.1109/TIT.2008.929958
[29] Beck, A., Teboulle, M. (2009). A fast iterative shrinkage-thresholding algorithm for linear inverse problems. SIAM Journal on Imaging Sciences, 2(1): 183-202. https://doi.org/10.1137/080716542
[30] Yang, A.Y., Zhou, Z., Balasubramanian, A.G., Sastry, S.S., Ma, Y. (2013). Fast l1 minimization algorithms for robust face recognition. IEEE Transactions on Image Processing, 22(8): 3234. https://doi.org/10.1109/TIP.2013.2262292
[31] Yang, A.Y., Sastry, S.S., Ganesh, A., Ma, Y. (2010). Fast ℓ1-minimization algorithms and an application in robust face recognition: A review. In 2010 IEEE International Conference on Image Processing, 1849-1852. https://doi.org/10.1109/ICIP.2010.5651522
[32] Zhang, L., Yang, M., Feng, X. (2011). Sparse representation or collaborative representation: Which helps face recognition? In 2011 International Conference on Computer Vision, pp. 471-478. https://doi.org/10.1109/ICCV.2011.6126277
[33] Li, Z., Lai, Z., Xu, Y., Yang, J., Zhang, D. (2015). A locality-constrained and label embedding dictionary learning algorithm for image classification. IEEE Transactions on Neural Networks and Learning Systems, 28(2): 278-293. https://doi.org/10.1109/TNNLS.2015.2508025
[34] http://www.yongxu.org/Database
[35] Gross, R., Matthews, I., Cohn, J., Kanade, T., Baker, S. (2010). Multi-pie. Image and Vision Computing, 28(5): 807-813. https://doi.org/10.1016/j.imavis.2009.08.002
[36] http://www.cl.cam.ac.uk/research/dtg/attarchive/facedatabase.html.
[37] http://www.cs.columbia.edu/CAVE/software/softlib/coil-100.php.
[38] Wright, S.J., Nowak, R.D., Figueiredo, M.A. (2009). Sparse reconstruction by separable approximation. IEEE Transactions on Signal Processing, 57(7): 2479-2493. https://doi.org/10.1109/TSP.2009.2016892